• Übersicht
  • Bewertungen
  • Diskussion (3)
  • Neue Funktionen

SimSim Waves Indicator

Indikator. "Indikatorwelle oder Indikator Ma".

Unter Verwendung von 23 Standardindikatoren und dem Algorithmus des Autors werden die Einkäufe (von 0 bis +100) und die Verkäufe (von 0 bis -100) berechnet.
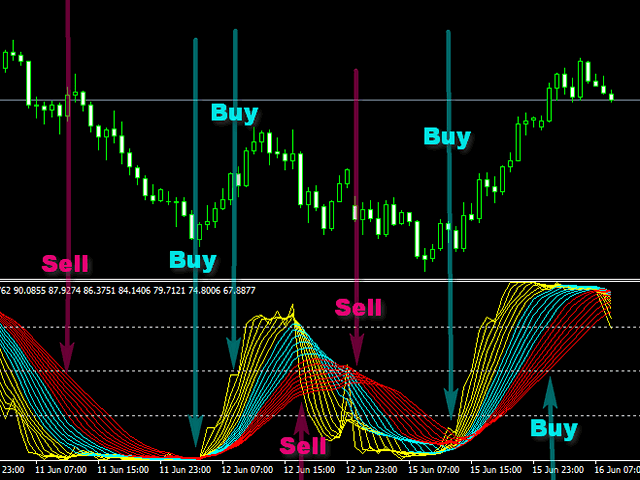
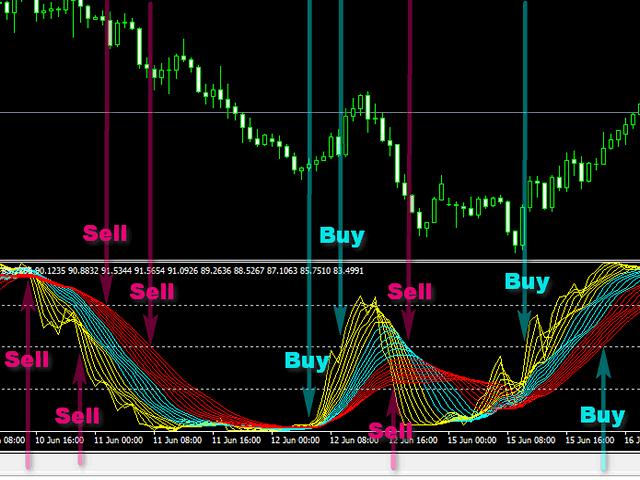
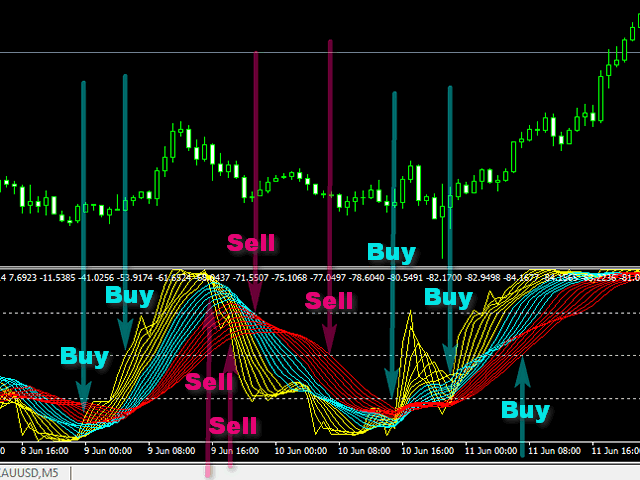
Dann zeichnet der "Wave Indicator" mit den berechneten Levels eine Welle mit 21 gleitenden Durchschnitten.

Die Wellenzahl entspricht der Mittelungsperiode der berechneten Pegel.
Wellen Nr. 1 - 7 sich schnell bewegende Durchschnitte
Wellen von Nr. 8 bis 14 gleitender Durchschnitte
Wellen von Nr. 15-21 langsam gleitender Durchschnitte


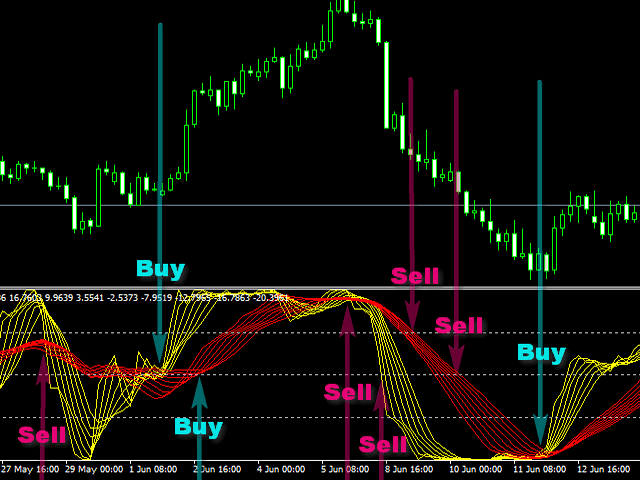
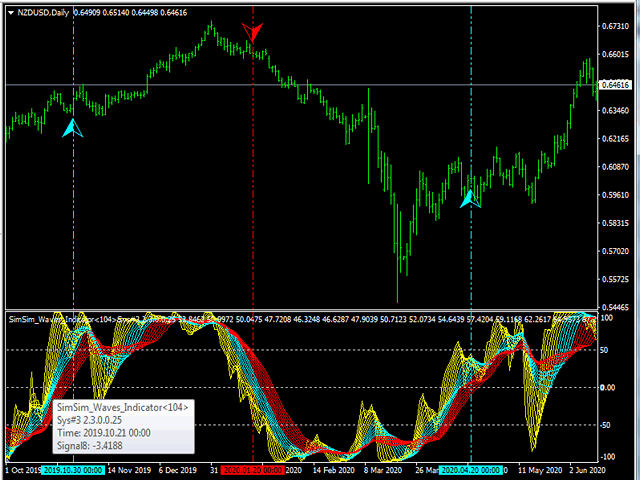
Wenn Sie sich die vom Indikator gezeichneten Zahlen ansehen, können Sie viele interessante Punkte für den Markteintritt erkennen.
Die Screenshots zeigen viele Situationen, in denen Sie kaufen oder verkaufen könnten. Der Indikator funktioniert in jedem Zeitrahmen und auf jedem Instrument gut.
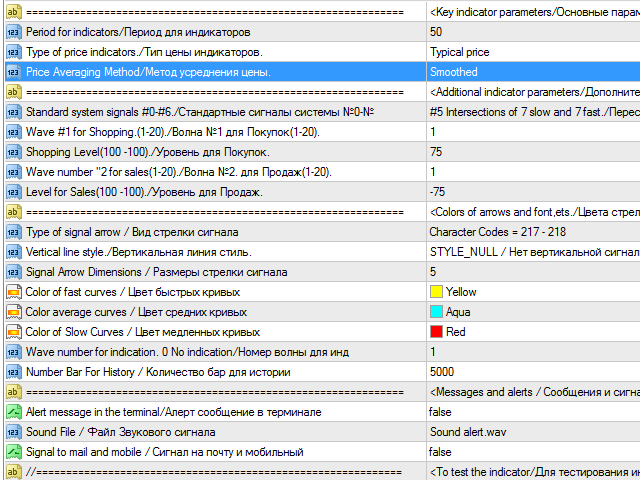
Indikatorparameter:

    <Drei Hauptparameter, genug, damit der Indikator funktioniert>
    Zeitraum für Indikatoren (0-999) - Zeitraum für den Indikator
    Art der Preisindikatoren. - Preistyp.
    Preismittelungsmethode - Preismittelungsmethode.

    <Hilfsparameter zum Einstellen von Anzeigesignalen>
    Erste Welle Nummer Ma # 1 (1-21). - Wellennummer für Käufe Ma№1.
    Level für Kaufen (+100 -100). - Ebene zum Einkaufen.
    Zweite Wellennummer Ma # 2 (1-21) .- Wellennummer für den Verkauf Ma№2.
    Verkaufslevel (+100 -100). - Ebene für den Verkauf.

    <7 vorgefertigte Signale zur Hilfe. Signale auf dem Monitor in Form von Pfeilen oder einer vertikalen Linie>
        Bei Käufen geben wir die Wellennummer in Ma #1 und die Kaufstufe an.
        Für Verkäufe geben wir die Wellennummer in Ma # 2 und die Verkaufsebene an.
        0 Wave Ma #1 durchquert das Level = 0 von unten nach oben - ein Kaufsignal. Wave Ma #2 durchquert das Level = 0 von oben nach unten - ein Verkaufssignal. Kauf- und Verkaufslevel werden nicht verwendet.
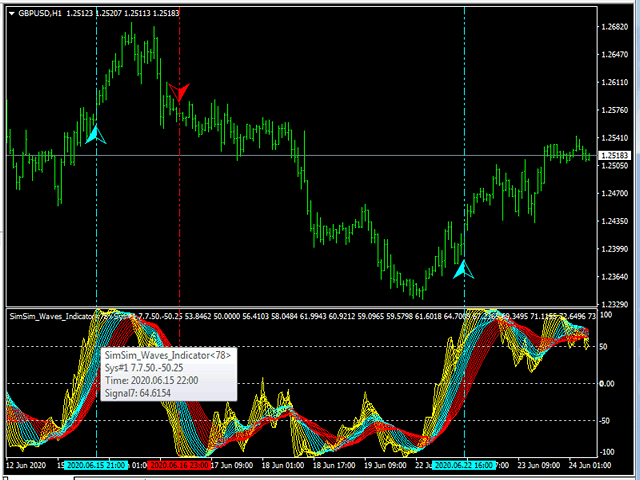
        Wave 1 Ma #1 kreuzt das Kaufniveau nach oben - ein Kaufsignal. Wave Ma #2 durchquert das Sell-Level von oben nach unten - ein Sell-Signal. Sie können Ihre eigenen Kauf- und Verkaufsstufen festlegen.
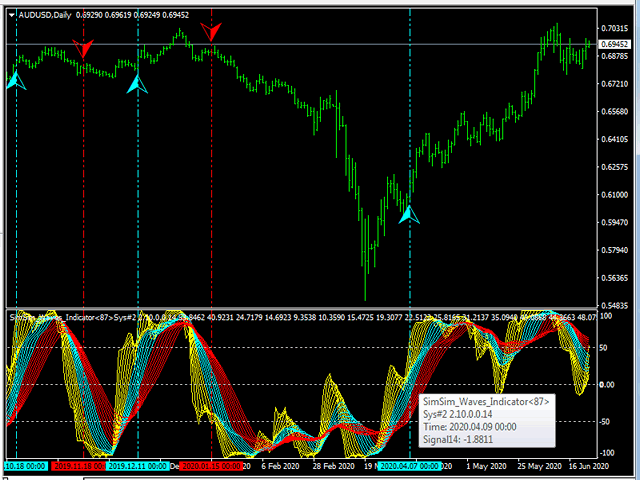
        2 Eine Gruppe von Wellen von Ma #1 bis Ma #2 in eine Richtung (alle wachsen) und das Kaufniveau überschritten - ein Kaufsignal. Wenn die Wellen von Ma #1 bis Ma #2 in eine Richtung verlaufen (alle fallen) und das Verkaufsniveau überschritten haben - ein Verkaufssignal. Sie können Ihre eigenen Kauf- und Verkaufsstufen festlegen.
        3 Wave Ma #1 kreuzt Welle Ma #2 nach oben - ein Kaufsignal. Wolf Ma #1 kreuzt Welle Ma #2 von oben nach unten - ein Verkaufssignal. Sie können Ihre eigenen Kauf- und Verkaufsstufen festlegen.
        4 Wave Ma #1 bildete ein Loch (überverkauft) - Kaufsignal Wave Ma #2 bildete ein Top (überkauft) - Verkaufssignal. Sie können Ihre eigenen Kauf- und Verkaufsstufen festlegen.
        5 Sieben schnell (Wellen von 1-7) kreuzen sieben langsame (Wellen von 15-21) von unten nach oben - Kaufsignal Kauf. Sieben schnelle (Wellen von 1-7) kreuzen sieben langsame (Wellen von 15-21) auf und ab - ein Verkaufssignal. Sie können Ihre eigenen Kauf- und Verkaufsstufen festlegen.
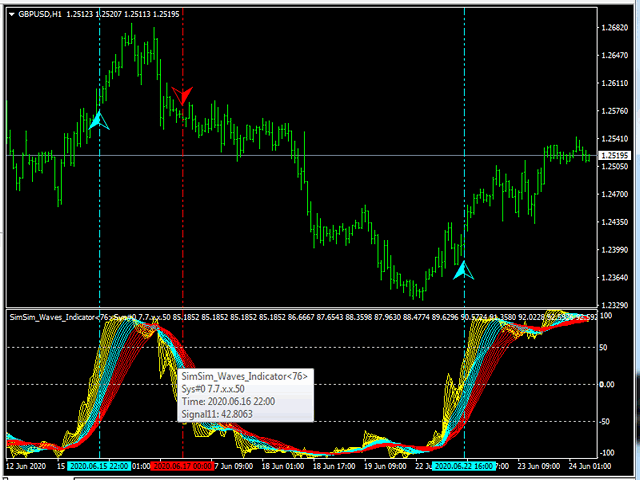
        6 Signal des Emulators des Indikators "SimSim arrow open or down", wenn es über dem Kaufniveau liegt - ein Kaufsignal Wenn es unter dem Verkaufsniveau liegt - ein Verkaufssignal. Die Parameter für Ma #1 und Ma #2 werden nicht verwendet. Sie können Ihre eigenen Kauf- und Verkaufsstufen festlegen.

    <Pfeile und vertikale Linien>
    Art des Signalpfeils - Signalpfeiltyp
    Vertikaler Linienstil. - Vertikaler Linienstil.
    Abmessungen des Signalpfeils - Abmessungen des Signalpfeils
    Farbe der schnellen Kurven (1-7) - Farbe der schnellen Kurven
    Farbmittelwertkurven (8-13) - Farbmittelwertkurven
    Farbe der langsamen Kurven (14-20) - Farbe der langsamen Kurven
    Wellennummer zur Anzeige. 0 Keine Anzeige - Wellennummer (Ma) für Textanzeige.
    Number Bar For History (1500) - Anzahl der Balken für die Historie

    <Signale und Warnungen>
    Warnmeldung im Terminal (true / false) - Warnmeldung im Terminal
    Tondatei oder keine Datei - Tonsignaldatei
    Signal an Mail und Handy (wahr / falsch) - Signal an Mail und Handy

    <Nur zum Testen des Indikators>
    Textfarbe - Textfarben
    Schriftgröße für Text - Schriftgröße für Text
    Gewinnfarbe - Farbe der Gewinnergebnisse
    Farbe unrentabler Ergebnisse - Farbe unrentabler Ergebnisse
    Gewinnstufe für Test (0-99999) - Gewinnstufe für Test


Empfohlene Produkte
Daily Candle Predictor ist ein Indikator, der den Schlusskurs einer Kerze vorhersagt. Der Indikator ist in erster Linie für die Verwendung in D1-Charts gedacht. Dieser Indikator eignet sich sowohl für den traditionellen Devisenhandel als auch für den Handel mit binären Optionen. Der Indikator kann als eigenständiges Handelssystem oder als Ergänzung zu Ihrem bestehenden Handelssystem verwendet werden. Dieser Indikator analysiert die aktuelle Kerze und berechnet bestimmte Stärkefaktoren innerhalb
65 USD
Trendiness Index
Libertas LLC
5 (3)
"The trend is your friend" is one of the best known sayings in investing, because capturing large trendy price movements can be extremely profitable. However, trading with the trend is often easier said than done, because many indicators are based on price reversals not trends. These aren't very effective at identifying trendy periods, or predicting whether trends will continue. We developed the Trendiness Index to help address this problem by indicating the strength and direction of price trend
49 USD
The Th3Eng PipFinite indicator is based on a very excellent analysis of the right trend direction with perfect custom algorithms. It show the true direction and the best point to start trading. With StopLoss point and Three Take Profit points. Also it show the right pivot of the price and small points to order to replace the dynamic support and resistance channel, Which surrounds the price. And Finally it draws a very helpful Box on the left side on the chart includes (take profits and Stop loss
89 USD
Noize Absorption Index - is the manual trading system that measures the difference of pressure between bears forces and bulls forces. Green line - is a noize free index that showing curent situation. Zero value of index shows totally choppy/flat market.Values above zero level shows how powerfull bullish wave is and values below zero measures bearish forces.Up arrow appears on bearish market when it's ready to reverse, dn arrow appears on weak bullish market, as a result of reverse expectation. S
199 USD
Der Indikator berechnet und zeichnet automatisch Fibonacci-Unterstützungs- und Widerstandsniveaus - eines der effektivsten Werkzeuge für die Marktanalyse. Die Berechnung verwendet die gemittelten Preisdaten für den ausgewählten Zeitraum und Zeitraum. Das Minimum und das Maximum für diesen Zeitraum gelten als Beginn und Ende der Bewegung. Fibonacci-Niveaus ermöglichen es Ihnen, potenzielle Referenzpunkte zu erkennen, um die sich die Preisbewegung verlangsamen oder umkehren kann, dh sie werden ver
30 USD
Tunafish EA MT4
Ismaele Daniele Lodetti
Tunafish EA is the most efficient EA on my profile. I spent a lot of time and effort to make this software sophisticated with possibilities of high potential returns while keeping the drawdown below 25%. The algorithms of the robot provide investors of any level of training with an investment opportunity that is both safe and aggressive. Tunafish EA imitating the work of the brain, capable of learning and adapting to changing conditions and predicting situations. When applied to trading in fina
69 USD
TWO PAIRS SQUARE HEDGE METER INDICATOR Try this brilliant 2 pairs square indicator It draws a square wave of the relation between your two inputs symbols when square wave indicates -1 then it is very great opportunity to SELL pair1 and BUY Pair2 when square wave indicates +1 then it is very great opportunity to BUY pair1 and SELL Pair2 the inputs are : 2 pairs of symbols         then index value : i use 20 for M30 charts ( you can try other values : 40/50 for M15 , : 30 for M30 , : 10 for H1 ,
10 USD
The indicator displays the data of the Stochastic oscillator from a higher timeframe on the chart. The main and signal lines are displayed in a separate window. The stepped response is not smoothed. The indicator is useful for practicing "manual" forex trading strategies, which use the data from several screens with different timeframes of a single symbol. The indicator uses the settings that are identical to the standard ones, and a drop-down list for selecting the timeframe. Indicator Parame
30 USD
Infinity Trend Pro
Yaroslav Varankin
1 (1)
This is a trend indicator without redrawing Developed instead of the binary options strategy (by the color of the Martingale candlestick) Also works well in forex trading When to open trades (binary options) A signal will appear in the place with a candle signaling the current candle It is recommended to open a deal for one candle of the current timeframe M1 and M5 When a blue dot appears, open a deal up When a red dot appears, open a trade down. How to open trades on Forex. When a signal is rec
1 000 USD
Trend Ray
Andriy Sydoruk
The indicator shows the potential trend direction by cyclical-wave dependence. Thus, all the rays of the intersection will be optimal rays, in the direction of which the price is expected to move, taking into account the indicator period. Rays can be used as a direction for potential market movement. But we must not forget that the approach must be comprehensive, the indicator signals require additional information to enter the market.
59 USD
An indicator of pattern #31 ("Long Island") from Encyclopedia of Chart Patterns by Thomas N. Bulkowski. The second gap is in the opposite direction. Parameters: Alerts - show alert when an arrow appears   Push - send a push notification when an arrow appears (requires configuration in the terminal) GapSize - minimum gap size in points ArrowType - a symbol from 1 to 17 ArrowVShift - vertical shift of arrows in points   ShowLevels - show levels ColUp - color of an upward line ColDn - color of
30 USD
MT4-Indikatoren. Drei Ebenen von Fibonacci-Unterstützungs- und Widerstandsebenen werden automatisch gezeichnet. Sie sind: Monatsstufe: Mittlere Orchidee Wochenlevel: Orangerot Tageslinienniveau: Türkis Die Farbe kann über Parameter angepasst werden. MT5 Version: https://www.mql5.com/EN/market/product/80068 Dieser Indikator wird hauptsächlich verwendet, um zukünftige Unterstützungs- und Widerstandsniveaus für eine bessere Handelsanalyse zu analysieren. Wenn das Unterstützungsniveau v
40 USD
The RSI with Trend Catcher signal is an easy-to-follow mt4 indicator that works like the traditional RSI. The RSI Trend Catcher plots a signal line similar to RSI but with some alterations. The indicator tells you overbought oversold areas and presents buying and selling opportunities. In addition, it catches the bullish and bearish divergences and locate trends better than the traditional RSI indicator. The RSI trend catcher consists of three colors; red, green, and yellow, with each color havi
30 USD
Trade with Gann on your side!! MASTER CIRCLE 360 CIRCLE CHART, originally created by Gann admitted that this is “The Mother of all charts”. It is one of the last studies that this great trader left for us. The numeric tab le is apparently quite simple like all the tables and is based on square numbers, the SQUARE OF 12 and is by evolution, one of the most important square numbers. Here we can find CYCLE, PRICE AND TIME thanks to angles and grades, to show past and future support and resistance.
149.99 USD
FXDragunovAutoFibo
Asep Saepudin
1 (1)
Fibonacci retracements is a popular instrument used by technical analysts to determine support and resistance areas. In technical analysis, this tool is created by taking two extreme points (usually a peak and a minimum) on the chart and dividing the vertical distance by the key Fibonacci coefficients equal to 23.6%, 38.2%, 50%, 61.8%, and 100%. Once these levels are defined, horizontal lines are then drawn and used to determine possible support and resistance levels. When using the Auto Fibonac
30 USD
ZhiBiCCI MT4
Qiuyang Zheng
5 (1)
[ZhiBiCCI] Indikatoren sind für alle Zyklusanwendungen und auch für alle Marktsorten geeignet. [ZhiBiCCI] Die grüne durchgezogene Linie ist eine Umkehrung der bullischen Divergenz. Die grüne gestrichelte Linie ist eine klassische bullische Divergenz. [ZhiBiCCI] Die durchgehende Linie zum Rot ist eine umgekehrte bearishe Divergenz. Die rote gepunktete Linie ist eine klassische bearishe Divergenz. [ZhiBiCCI] kann in den Parametern (Alert, Mail senden, Benachrichtigung senden) eingestellt wer
58 USD
This is a new strategy for SUPPLY DEMAND areas It is based on a calculation using the tick volume to detect the big price action in market for both bear /bull actions this smart volume action candles are used to determine the supply and demand areas prices in between main supply and demand lines indicate sideway market  up arrows will be shown when prices moves above the main supply and the secondary supply lines Down arrows will be shown when prices moves below the main demand and the secondary
30 USD
Buy Sell Strength (BSS) (For MT4 ) is a stock technical analysis oscillator, showing bullish (buy) and bearish (sell) strength by comparing upward and downward stock momentum movements. The BSS is easy to interpret: 1. When BBS Histogram is moving Upward, it is bullish, when it is Downward, it is bearish. 2. When the Orange rectangle is changing shorter and shorter, it shows the trend will change direction. when it dispears, it shows Buy or Sell signals. 3. BSS is considered overbought whe
30 USD
Super Gator
Agustinus Biotamalo Lumbantoruan
This indi shows the following 1. Supertrend 2. Alligator (Not a regular alligator) 3. ZigZag 4. Moving Average 5. Trend Continuation/Mini correction Signal (plotted in X) (See screenshots in green background color 6. Early Signal Detection (See screenshots in green background color) You may treat Alligator as the lagging indicator The leading indicator is the supertrend. The zig zag is based on the leading indicator where it gets plotted when the leading indicator got broken to the opposite.
150 USD
Cosmic Diviner X Planet
Olena Kondratenko
4 (2)
This unique multi-currency strategy simultaneously determines the strength of trends and market entry points, visualizing this using histograms on the chart. The indicator is optimally adapted for trading on the timeframes М5, М15, М30, Н1. For the convenience of users, the indicator renders the entry point (in the form of an arrow), recommended take profit levels (TP1, TP2 with text labels) and the recommended Stop Loss level. The take profit levels (TP1, TP2) are automatically calculated for
79 USD
FreqoMaster
Stanislav Korotky
The main idea of this indicator is rates analysis and prediction by Fourier transform. The indicator decomposes exchange rates into main harmonics and calculates their product in future. The indicator shows 2 price marks in history, depicting price range in the past, and 2 price marks in future with price movement forecast. Buy or sell decision and take profit size are displayed in a text label in the indicator window. The indicator uses another indicator as an engine for calculations - FreqoMet
75 USD
Master Scalping M1 ist ein innovativer Indikator, der einen Algorithmus verwendet, um den Trend schnell und genau zu bestimmen. Der Indikator berechnet den Zeitpunkt zum Öffnen und Schließen von Positionen, die Indikatoralgorithmen ermöglichen es Ihnen, die idealen Zeitpunkte für den Einstieg in einen Handel (Kauf oder Verkauf eines Vermögenswerts) zu finden, was den Erfolg von Transaktionen für die meisten Händler erhöht. Vorteile des Indikators: Einfach zu bedienen, überladen Sie das Diagramm
30 USD
The Infinity Expert Advisor is a scalper. When the resistance and support levels are broken, trades are opened in the direction of the price movement. Open positions are managed by several algorithms based on the current market situation (fixed stop loss and take profit, trailing stop, holding positions in case of trend indication, etc.). Requirements for the broker The EA is sensitive to spread, slippages and execution quality. It is strongly recommended not to use the EA for currencies with
150 USD
Trend Scanner
Vladimir Kalendzhyan
4.33 (6)
By purchasing this indicator, you have the right to receive a free copy of one of   my other indicator's or advisor’s!  (All future updates are included. No limits) . To get it , please contact me by  mql5 message ! The Trend Scanner trend line indicator displays the trend direction and its changes. The indicator works on all currency pairs and  timeframes. The indicator simultaneously displays multiple readings on the price chart: the support and resistance lines of the currency pair, the exist
50 USD
The indicator detects and displays 3 Drives harmonic pattern (see the screenshot). The pattern is plotted by the extreme values of the ZigZag indicator (included in the resources, no need to install). After detecting the pattern, the indicator notifies of that by a pop-up window, a mobile notification and an email. The indicator highlights the process of the pattern formation and not just the complete pattern. In the former case, it is displayed in the contour triangles. After the pattern is com
30 USD
Laguerre SuperTrend Clouds adds an Adaptive Laguerre averaging algorithm and alerts to the widely popular SuperTrend indicator. As the name suggests, Laguerre SuperTrend Clouds (LSC) is a trending indicator which works best in trendy (not choppy) markets. The SuperTrend is an extremely popular indicator for intraday and daily trading, and can be used on any timeframe. Incorporating Laguerre's equation to this can facilitate more robust trend detection and smoother filters. The LSC uses the impro
30 USD
RTrends
Nikolay Likhovid
The RTrends indicator does two things: first, it automatically draws the layout of the price chart by plotting trend lines and, secondly, it produces bearish and bullish signals. The layout reflects the fractal nature of the market. Trends from different time horizons are applied simultaneously on the chart. Thus, from a single chart a trader can see trend lines of higher timeframes. The lines, depending on the horizon, differ in color and width: the older the horizon, the thicker the line is. T
60 USD
Accuracy of correct predictions 83%! This indicator was tested on the basis of real statistics for all market indicators according to indicators for 3 months of trading. 83% of correct trade forecasts for usd / jpy on the m30 time frame were received on our statistics! if you have any questions, please contact us in private messages or in discussions under this indicator and we will figure it out and help any questions will arise personal messages or in discussions under this indicator As soon
100 USD
Trend Divergence Finder – индикатор, позволяющий выявлять дивергенции цены и графика выбранного индикатора. С помощью Trend Divergence Finder вы сможете подобрать тот индикатор, который наиболее эффективен для Вас, и использовать его с наглядным отображением на графике. В индикатор включены 9 базовых индикаторов : 1.        RSI 2.        MACD 3.        MOMENTUM 4.        RVI 5.        STOCHASTIC 6.        CCI 7.        Standard Deviation 8.        Derivative 9.        William Blau Присутст
69 USD
To download MT5 version please click here . - This is the exact conversion from TradingView: "Trend Direction Force Index - TDFI [wm]" By "causecelebre". - This indicator uses multiple levels of averaging to detect trend strength. - You can optimize filter low and filter high levels to achieve best results. - You have access to buffers to use in EAs. - This is a light-load processing and non-repaint indicator. - You can message in private chat for further changes you need.
40 USD
Käufer dieses Produkts erwarben auch
RelicusRoad Pro
Relicus LLC
4.94 (87)
JETZT 147 $ (602 $ RABATT) - UNBEGRENZTE KONTEN - PREISERHÖHUNGEN BEIM NÄCHSTEN UPDATE - VERGESSEN SIE NICHT, EINE 5-STERNE-BEWERTUNG ZU VERLASSEN RelicusRoad Benutzerhandbuch + Schulungsvideos + Zugang zur privaten Discord-Gruppe + VIP-Status EINE NEUE ART, DEN MARKT ZU BETRACHTEN RelicusRoad ist der weltweit leistungsstärkste Handelsindikator für Forex, Futures, Kryptowährungen, Aktien und Indizes und gibt Händlern alle Informationen und Tools, die sie benötigen, um profitabel zu bleib
147 USD
Ultimate Sniper Dashboard
Hispraise Chinedum Abraham
4.78 (18)
Ermäßigt auf $299! Die Preise können in Zukunft steigen! Lesen Sie die Beschreibung unten! Bestes Einstiegssystem für Ultimate Sniper Dashboard: ULTIMATIVE DYNAMISCHE EBENEN. (Bitte überprüfen Sie meine Produkte) Das Ultimate Sniper Dashboard funktioniert NUR auf Live-Märkten aufgrund der MT4 Multicurrency Testlimits. Wir stellen Ihnen das Ultimate-Sniper Dashboard vor! Unser bestes, das sowohl HA-Sniper, MA-Sniper und viele spezielle Modi enthält. Das Ultimate Sniper Dashboard ist ein
299 USD
DERZEIT 26% RABATT Die beste Lösung für jeden Newbie oder Expert Trader! Dieser Indikator ist ein einzigartiges, qualitativ hochwertiges und erschwingliches Trading-Tool, da wir eine Reihe von proprietären Funktionen und eine neue Formel integriert haben. Mit nur EINEM Chart können Sie die Währungsstärke für 28 Forex-Paare ablesen! Stellen Sie sich vor, wie sich Ihr Handel verbessern wird, weil Sie in der Lage sind, den genauen Auslösungspunkt eines neuen Trends oder einer Scalping-Gelegenh
148 USD
Advanced Supply Demand
Bernhard Schweigert
4.94 (285)
Derzeit 33% Rabatt! Die beste Lösung für jeden Anfänger oder erfahrenen Händler! Dieser Indikator ist ein einzigartiges, qualitativ hochwertiges und erschwingliches Trading-Tool, da wir eine Reihe von proprietären Funktionen und eine neue Formel integriert haben. Mit diesem Update werden Sie in der Lage sein, doppelte Zeitrahmenzonen anzuzeigen. Sie können nicht nur einen höheren TF (Zeitrahmen) anzeigen, sondern sowohl den Chart-TF als auch den höheren TF: SHOWING NESTED ZONES. Alle Supply Dema
148 USD
Gold Stuff
Vasiliy Strukov
4.89 (144)
Gold Stuff-Ein Trendindikator, der speziell für Gold entwickelt wurde, kann auch auf allen Finanzinstrumenten verwendet werden. Der Indikator wird nicht neu gezeichnet und verzögert sich nicht. Empfohlener Zeitrahmen H1. Nach diesem Indikator geschrieben EA Gold Stuff Berater, können Sie es in meinem Profil finden. WICHTIG! Kontaktieren Sie mich sofort nach dem Kauf, um Anweisungen und Bonus zu erhalten! DATEN Draw Arrow - inkl.aus. zeichnen von Pfeilen in einem Diagramm. Alerts-inkl.aus.
125 USD
Scalper Vault
Oleg Rodin
5 (11)
Scalper Vault ist ein professionelles Scalping-System, das Ihnen alles bietet, was Sie für erfolgreiches Scalping benötigen. Dieser Indikator ist ein komplettes Handelssystem, das von Forex- und Binäroptionshändlern verwendet werden kann. Der empfohlene Zeitrahmen ist M5. Das System liefert Ihnen genaue Pfeilsignale in Richtung des Trends. Es liefert Ihnen auch Top- und Bottom-Signale und Gann-Marktniveaus. Die Indikatoren bieten alle Arten von Warnungen, einschließlich PUSH-Benachrichtigungen.
65 USD
Italo Volume Indicator
Italo Santana Gomes
4.96 (68)
BUY INDICATOR AND GET EA FOR FREE AS A BONUS + SOME OTHER GIFTS! ITALO VOLUME INDICATOR  is the best volume indicator ever created, and why is that? The Indicator works on all time-frames and assets, indicator built after 6 years of experience on forex and many other markets. You know many volume indicators around the internet are not complete, does not help, and it's difficult to trade, but the Italo Volume Indicator is different , the Italo Volume Indicator shows the wave volume, when market
65 USD
A top and bottom indicator that can intuitively identify the trend of the band. It is the best choice for manual trading, without redrawing or drifting. For any novice and programming trading friend, you can write the signal into the EA to play freely. Array 3 and array 4, for example, 3>4 turns green, 3<4 turns red. If you don't understand, please contact me. Original price of USD 198 ( current price of USD 69 ) - Next update price increase- unlimited account - do not forget to leave 5 star com
69 USD
Ultimate Dynamic Levels
Hispraise Chinedum Abraham
4.86 (7)
Derzeit auf Urlaub Rabatt bei $ 399! Die Preise können in Zukunft steigen. Lesen Sie die Beschreibung unten!  Einführung von Ultimate Dynamic Levels - der BESTE Einstiegsindikator für das Ultimate Sniper Dashboard! Extrem risikoarme, rechtzeitige Einstiege und hohe RR!! Finden Sie das Ultimate Sniper Dashboard HIER. Die wichtigste Fähigkeit sowohl für Anfänger als auch für Profis ist es, genau zu erkennen, wo und wann ein Markt am wahrscheinlichsten dreht, und wie man sicher einsteigt und mi
199 USD
Derzeit 20% Rabatt! Die beste Lösung für jeden Neueinsteiger oder Expert Händler! Dieses Dashboard arbeitet mit 28 Währungspaaren. Es basiert auf 2 unserer Hauptindikatoren (Advanced Currency Strength 28 und Advanced Currency Impulse). Es bietet einen hervorragenden Überblick über den gesamten Forex-Markt. Es zeigt die Werte der Advanced Currency Strength, die Veränderungsrate der Währungen und die Signale für 28 Devisenpaare in allen (9) Zeitrahmen. Stellen Sie sich vor, wie sich Ihr Hande
199 USD
ICT, SMC, SMART MONEY CONCEPTS, SMART MONEY, Smart Money Concept, Support and Resistance, Trend Analysis, Price Action, Market Structure, Order Blocks, BOS/CHoCH,   Momentum Shift, HH/LL/HL/LH,    Fair Value Gap, FVG,  Premium  &   Discount   Zones, Fibonacci Retracement, OTE, Buy Side Liquidity, Sell Side Liquidity, BSL/SSL Taken, Equal Highs & Lows, MTF, Multiple Time Frame, BigBar, HTF OB, HTF Market Structure,  Liquidity Voids, Long Wicks, Candle Timer, Fractals, ZigZag, Time Zone, Market Se
60 USD
Italo Trend Indicator
Italo Santana Gomes
4.78 (27)
BUY INDICATOR AND GET EA FOR FREE AS A BONUS + SOME OTHER GIFTS! ITALO TREND INDICATOR  is the best trend indicator on the market, the Indicator works on all time-frames and assets, indicator built after 6 years of experience on forex and many other markets. You know many trend indicators around the internet are not complete, does not help, and it's difficult to trade, but the Italo Trend Indicator is different , the Italo Trend Indicator shows the signal to buy or sell, to confirm the signal t
65 USD
Entry Points Pro
Yury Orlov
4.72 (214)
Dies ist ein Indikator für MT4, der genaue Signale für den Einstieg in einen Handel ohne Repainting (Neuzeichnen) liefert. Er kann auf alle Finanzwerte angewendet werden: Forex, Kryptowährungen, Metalle, Aktien, Indizes. Er liefert ziemlich genaue Schätzungen und sagt Ihnen, wann es am besten ist, eine Position zu eröffnen und zu schließen. Sehen Sie sich das Video (6:22) mit einem Beispiel für die Verarbeitung nur eines Signals an, das sich für den Indikator gelohnt hat! Die meisten Händler ver
125 USD
Owl smart levels
Sergey Ermolov
5 (6)
Indikator-Leitfaden  |  Owl Smart Levels-Strategie  |   MT5-Version  |  Wie installiert man?   |   FAQ Der   Owl Smart Levels Indikator   ist ein komplettes Handelssystem innerhalb eines Indikators, der so beliebte Marktanalysetools wie die   fortschrittlichen Fraktale von Bill Williams , Valable ZigZag, das die   richtige Wellenstruktur   des Marktes aufbaut, und   Fibonacci-Levels , die die genauen Einstiegslevels markieren, enthält in den Markt und Orte, um Gewinne mitzunehmen. Eine detailli
85 USD
Strong Support
Vasiliy Strukov
5 (14)
Unterstützungs- und Widerstandsniveaus sind seit der Antike ein mächtiges Werkzeug für die Marktanalyse. Strong Support Der Indikator baut Unterstützungsniveaus auf lokalen Preistiefs und Widerstandsniveaus auf lokalen Preishochs auf.  Meine anderen Entwicklungen finden Sie hier Es wird empfohlen, in Verbindung mit einem Trendindikator wie Gold Stuff zu verwenden, um den Trend zu handeln und gleichzeitig Konsolidierungs- oder Umkehrzonen zu definieren sowie Stop-Loss und Take-Profit auf Unt
125 USD
DERZEIT 31% RABATT! Die beste Lösung für jeden Newbie oder Expert Trader! Dieser Indikator ist ein einzigartiges, qualitativ hochwertiges und erschwingliches Handelsinstrument, da wir eine Reihe von proprietären Funktionen und eine geheime Formel eingebaut haben. Mit nur EINEM Chart liefert er Alerts für alle 28 Währungspaare. Stellen Sie sich vor, wie sich Ihr Handel verbessern wird, weil Sie in der Lage sind, den genauen Auslösepunkt eines neuen Trends oder einer Scalping-Gelegenheit zu e
88 USD
PRO Renko System ist ein hochpräzises Handelssystem, das speziell für den Handel mit RENKO-Charts entwickelt wurde. Dies ist ein universelles System, das auf verschiedene Handelsinstrumente angewendet werden kann. Das System neutralisiert effektiv so genannte Marktgeräusche, die Ihnen Zugang zu genauen Umkehrsignalen geben. Der Indikator ist sehr einfach zu bedienen und hat nur einen Parameter, der für die Signalerzeugung verantwortlich ist. Sie können das Tool einfach an jedes Handelsinstr
75 USD
Trend Scanner GS
Vasiliy Strukov
5 (15)
Trend Scanner scannt Markttrends aus Multi-Symbolen und Multi-Time-Frames und zeigt sie auf einem beweglichen Panel auf dem Chart an, den er zur Analyse verwendet. Der Händler kann mehrere Paare seiner Wahl zur Anzeige auswählen. Trend Scanner ist ein großartiges Tool, um die Richtung des Trends zu sehen, und kann für den manuellen Handel oder den EA-Handel verwendet werden, indem nur Kauf- oder Verkaufsaufträge gemäß dem Trend zugelassen werden. Echtzeit-Ergebnisse können hier eingesehen wer
125 USD
Cycle Sniper
Elmira Memish
4.63 (30)
NEW YEAR SALE PRICE FOR LIMITED TIME!!! Please contact us after your purchase and we will send you the complimentary indicators to complete the system. Cycle Sniper is not a holy grail but when you use it in a system which is explained in the videos, you will feel the difference. If you are not willing to focus on the charts designed with Cycle Sniper and other free tools we provide, we recommend not buying this indicator. We recommend watching the videos about the indiactor and system before
200 USD
Spirit mt4
Alena Snigireva
5 (1)
Spirit mt4 is an indicator that works without flashing, the signals are triggered after the arrow at the beginning of the next candle Includes several indicators for overbought and oversold levels. Works with any currency pair: EUR/USD, AUD/USD and others. After the purchase, send me a private message and I will send you the settings that I use for this indicator. Suitable for trading cryptocurrencies. I like to trade cryptocurrency more, so I use it more there. It can also be used
800 USD
AW Trend Predictor
Alexander Nechaev
4.82 (28)
Die Kombination von Trend- und Aufschlüsselungsebenen in einem System. Ein fortschrittlicher Indikatoralgorithmus filtert Marktrauschen, bestimmt den Trend, Einstiegspunkte sowie mögliche Ausstiegsniveaus. Indikatorsignale werden in einem Statistikmodul aufgezeichnet, das es Ihnen ermöglicht, die am besten geeigneten Tools auszuwählen, die die Wirksamkeit der Signalhistorie zeigen. Der Indikator berechnet Take-Profit- und Stop-Loss-Marken. Handbuch und Anleitung ->   Hier   / MT5-Version ->   H
55 USD
TrendLine PRO MT4
Evgenii Aksenov
4.88 (249)
The Trend Line PRO indicator is an independent trading strategy. It shows the trend change, the entry point to the transaction, as well as automatically calculates three levels of Take Profit and Stop Loss protection Trend Line PRO is perfect for all Meta Trader symbols: currencies, metals, cryptocurrencies, stocks and indices Advantages of Trend Line PRO Never redraws its signals The possibility of using it as an independent strategy It has three automatic levels Take Profit and Stop Loss leve
75 USD
Please send me Direct message on MQL5 CHAT after purchasing the Indicator for Training and Installation Support There are some additional files that is important to use with the Indicator . So be sure to contact me after purchasing the Indicator So that I can add you for training and support . If you find any difficulty with installation then send me Direct message here So that I can connect with you via Anydesk or Teamview for the product installation. " Smart Order Block Indicator " to find
249 USD
Matrix Arrow Indicator MT4
Juvenille Emperor Limited
5 (1)
Matrix Arrow Indicator MT4 ist ein einzigartiger 10-in-1-Trend, der zu 100 % nicht neu gezeichnet werden kann. Multi-Timeframe-Indikator, der für alle Symbole/Instrumente verwendet werden kann: Forex, Rohstoffe, Kryptowährungen, Indizes, Aktien. Der Matrix Arrow Indicator MT4 wird den aktuellen Trend in seinen frühen Stadien bestimmen und Informationen und Daten von bis zu 10 Standardindikatoren sammeln, die sind: Durchschnittlicher Richtungsbewegungsindex (ADX) Rohstoffkanalindex (CCI) Klassis
75 USD
M1 Arrow
Oleg Rodin
5 (5)
Eine Intraday-Strategie, die auf zwei Grundprinzipien des Marktes basiert. Der Algorithmus basiert auf der Analyse von Volumina und Preiswellen mit zusätzlichen Filtern. Der intelligente Algorithmus des Indikators gibt nur dann ein Signal, wenn sich zwei Marktfaktoren zu einem vereinen. Der Indikator berechnet Wellen eines bestimmten Bereichs auf dem M1-Diagramm unter Verwendung der Daten des höheren Zeitrahmens. Und um die Welle zu bestätigen, verwendet der Indikator eine Volumenanalyse. Dieser
65 USD
Advanced Currency Strength Indicator The Advanced Divergence Currency Strength Indicator. Not only it breaks down all 28 forex currency pairs and calculates the strength of individual currencies across all timeframes , but, You'll be analyzing the WHOLE forex market in 1 window (In just 1 minute) . This indicator is very powerful because it reveals the true movements of the market.  It is highly recommended to  analyze charts knowing the performance of individual currencies or the countries ec
149 USD
Dieser Indikator ist eine hervorragende Kombination aus unseren 2 Produkten Advanced Currency IMPULSE with ALERT  +   Currency Strength Exotics . Es funktioniert für alle Zeitrahmen und zeigt grafisch Impulse der Stärke oder Schwäche für die 8 wichtigsten Währungen plus ein Symbol! Dieser Indikator ist darauf spezialisiert, die Beschleunigung der Währungsstärke für beliebige Symbole wie Gold, Exotische Paare, Rohstoffe, Indizes oder Futures anzuzeigen. Als erster seiner Art kann jedes Sym
149 USD
Full Forex Market View Dashboard
Opengates Success International
5 (2)
VOLLSTÄNDIGE FOREX-MARKTANSICHT Dashboard-Anzeige Dies ist ein benutzerdefinierter Indikator, der erstellt wurde, um Händlern einen vollständigen Überblick darüber zu geben, was auf dem Markt vor sich geht. Es verwendet Echtzeitdaten, um auf den Markt zuzugreifen und alle Informationen anzuzeigen, die für einen erfolgreichen Handel erforderlich sind. INSTALLATION: Bevor Sie diesen Indikator an Ihren Fenster-Chart anhängen, gehen Sie zum Market Watch Panel Ihres MT4 und AUSBLENDEN Sie al
650 USD
Scalper Inside PRO
Alexey Minkov
4.67 (42)
This is an innovative indicator that uses an exclusive algorithm to quickly and accurately determine the trend. The indicator automatically calculates the opening and closing time of positions, as well as detailed statistics of the indicator's performance for a certain period of history, which allows you to choose the best trading tool for your trade. You can also connect your custom arrow indicators to Scalper Inside Pro to check and calculate their statistics and profitability. Scalper Inside
139 USD
Blahtech Supply Demand
Blahtech Limited
4.62 (34)
Supply Demand uses previous price action to identify potential imbalances between buyers and sellers. The key is to identify the better odds zones, not just the untouched ones. Blahtech Supply Demand indicator delivers functionality previously unavailable on any trading platform. This 4-in-1 indicator not only highlights the higher probability zones using a multi-criteria strength engine, but also combines it with multi-timeframe trend analysis, previously confirmed swings and engulfing detector
142 USD
Weitere Produkte dieses Autors
"SimSim Expert Assistant" утилита для сопровождению сделок трейдера в терминале МТ4. Утилита бесплатная, пользуйтесь. Кроме того, утилита открывает сделки по сигналам индикаторов SimSim Trading (через глобальные). Параметр индикатора "Signal shaping for SimSim Expert Assistan" указывает на это. Как работать с утилитой. Expert Assistant работает в терминале МТ4 и устанавливается в папку Expert, в утилите нет ни одного параметра при старте. Все параметры находятся в списке глобальных переменных
FREE
SimSim-Pfeil nach oben oder unten öffnen Der Indikator berechnet und fasst Daten aus 23 Standardindikatoren zusammen. Welche Standardindikatoren verwendet werden sollen, wählt der Händler selbst aus. Als Ergebnis der Berechnung erhalten wir den aktuellen Signalpegel. Positive Werte des Signals zeigen einen möglichen Kauf an, negative Werte zeigen einen Verkauf an.  Der Indikator implementiert ein Testsystem, das durch Herunterladen der Demoversion getestet werden kann. Ein Indikator kann
50 USD
SimSim Histogram open up or down Der Indikator berechnet und fasst Daten aus 25 Standardindikatoren zusammen. Welche Standardindikatoren verwendet werden sollen, bestimmt der Händler selbst. Als Ergebnis der Berechnung erhalten wir den aktuellen Signalpegel und färben das Histogramm nach Farbe: Kauf, Verkauf oder neutraler Wert. Der Indikator implementiert ein Testsystem, das durch Herunterladen der Demoversion getestet werden kann. Ein Indikator kann eine gute Ergänzung Ihrer Handelsstrate
50 USD
SimSim Tournament Currency Strength Table   This is a multi-currency indicator; it shows the relative strength of the currency and 28 major currency pairs. There are many similar indicators on the market, but let there be one more. In this indicator, unlike others, you can specify weighting factors for each timeframe. Weighting factors. Why are they? Each trader prefers to work with a specific time frame, which is the main one for him, and the signals from him are most important. Examples of
30 USD
Der Indikator berechnet und fasst Daten aus 25 Standardindikatoren zusammen. Als Ergebnis der Berechnung erhalten wir den aktuellen Signalpegel. Geben Sie in den Eingangsparametern den minimalen Signalpegel an. Diese Ebene wird als Histogramm (Hauptindikator) und Indikatorpfeile (zweiter Indikator) angezeigt. Positive Werte des Signals zeigen einen möglichen Kauf an, negative Werte zeigen einen Verkauf an.  Der Indikator implementiert ein Testsystem, das durch Herunterladen der Demoversion ge
50 USD
Это стрелочный индикатор. Он выбирает данные от 23-х стандартных индикаторов и расчитывает уровень сигнала который показывает предполагаемое движение цены инструмента торговли. Минимальный уровень сигнала индикатора установлен в пределах -100 до +100%. Используйте усреднение для формирования сигнала. Как работать с индикаторам. Следим за сигналом и принимаем решения. Индикатор перерисовывается только на нулевой свечи, поэтому решения принимаются после закрытия свечи с новым сигналом, и сигн
50 USD
Это линейный индикатор. Он выбирает данные от 23-х стандартных индикаторов и рассчитывает уровень сигнала, который показывает предполагаемое движение цены инструмента торговли. Минимальный уровень сигнала индикатора установлен в пределах -100 до +100%. Используйте усреднение для формирования сигнала. Как работать с индикаторам. Следим за сигналом и принимаем решения. При пересечении нулевого уровня индикатора снизу вверх можно рассматривать покупки. При пересечении нулевого уровня сверху
50 USD
Это индикатор гистограмма. Он выбирает данные от 23-х стандартных индикаторов и расчитывает уровень сигнала который показывает предполагаемое движение цены инструмента торговли. Минимальный уровень сигнала индикатора установлен в пределах -100 до +100%. Используйте усреднение для формирования сигнала. Как работать с индикаторам. Следим за сигналом и принимаем решения, цвета гистограммы показывают когда возможны покупки а когда продажи, или нейтральный цвет - сделать паузу. Индикатор перерис
50 USD
MT4 trend indicator works without redrawing. Provides signals for entering trades, works on charts of any instrument. Трендовый индикатор МТ4, работает без перерисовки.  Выдает сигналы для входа в сделки, работает на графиках любого инструмента. Input parameters are for styling and messages only. / Входные параметры только для оформления и сообщений. All original signal calculations do not need additional parameters. / Все оригинальные расчеты сигнала, не нуждаются в дополнительных параметрах.
30 USD
MT5 trend indicator works without redrawing. Provides signals for entering trades, works on charts of any instrument. Трендовый индикатор МТ5, работает без перерисовки.  Выдает сигналы для входа в сделки, работает на графиках любого инструмента. Input parameters are for styling and messages only. / Входные параметры только для оформления и сообщений. All original signal calculations do not need additional parameters. / Все оригинальные расчеты сигнала, не нуждаются в дополнительных параметрах.
30 USD
Auswahl:
Keine Bewertungen
Antwort auf eine Rezension
Version 1.1 2020.06.26
Some graphic objects remained on the chart, but did not go away. Fixed.