Colored candles and patterns MT5
- Indikatoren
- Alexander Nikolaev
- Version: 1.0
- Aktivierungen: 10
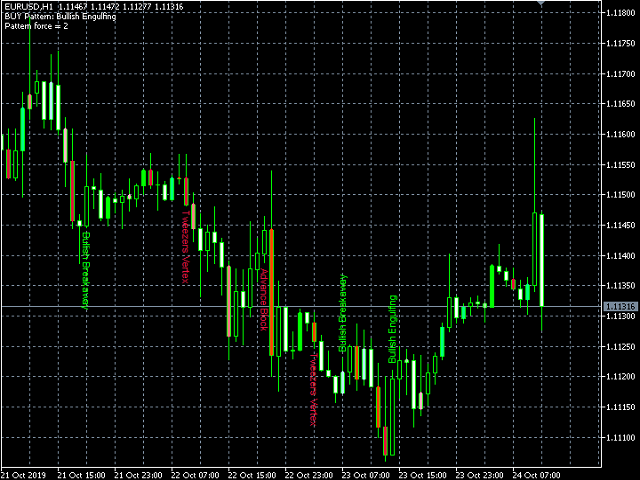
Einige Kerzen neigen stark dazu, die Bewegung oder ihre Drehung fortzusetzen. Mit dem Indikator Farbige Kerzen und Muster sind solche Kerzen
deutlich sichtbar. Dieser Indikator berechnet die Parameter jeder Kerze sowie ihr Volumen und färbt danach die Kerzen je nach Stärke
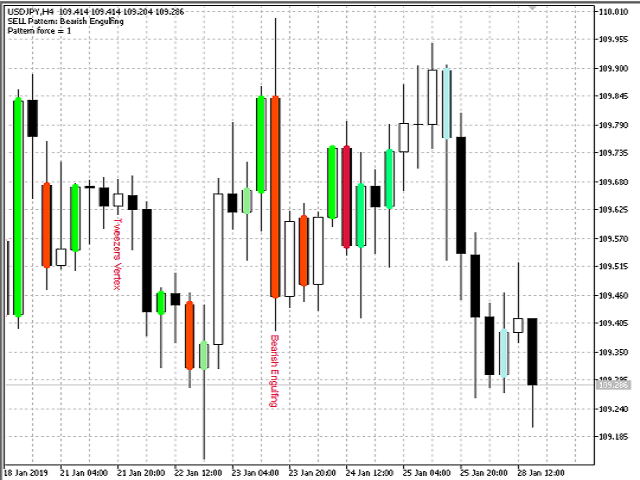
und Richtung. Bullische Kerzen werden grün und bärische Kerzen werden rot. Je stärker die Bullen oder Bären sind, desto heller ist die
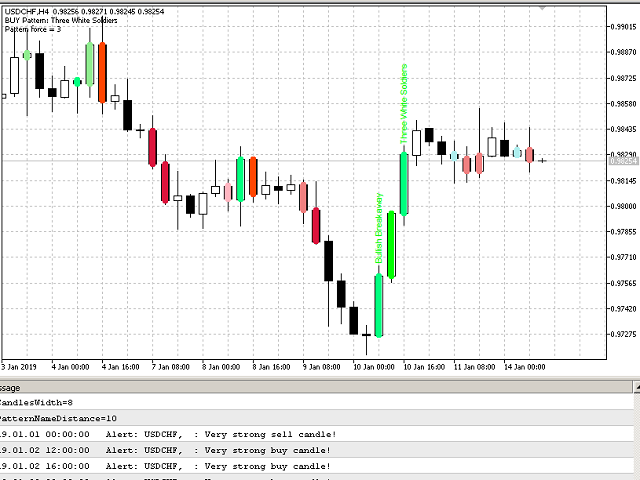
Farbe. Falls gewünscht, können die Farben geändert werden. Darüber hinaus färbt dieser Indikator nicht nur Kerzen, sondern zeigt
auch bekannte Kerzenmuster an. Es ist möglich, Warnungen so zu konfigurieren, dass keine wichtige Kerze in der Tabelle übersehen
wird, und rechtzeitig einen Deal zu eröffnen.
Der Indikator funktioniert für jedes Währungspaar und jeden Zeitrahmen. Es hilft, die Preisbewegung sowie die Momente des Eintritts in die Transaktion zu analysieren. Genauere Signale werden in großen Zeitrahmen erzeugt.
Parameter
- History - die Anzahl der Kerzen in der Geschichte zum Analysieren und Färben;
- Minimum length candle - die minimale Länge der analysierten Kerze;
- PeriodADX - Periode des ADX-Indikators;
- ADX and high-low relation - Abhängigkeit des ADX-Indikators und der minimalen Kerzenlänge;
- CountCandlesVolume - die Anzahl der Kerzen zum Vergleichen des Volumens (wenn 0 angegeben ist, wird das Volumen der Kerze nicht analysiert);
- StrongSignalAlert - Wenn diese Option aktiviert ist, werden Warnungen angezeigt, wenn die zuletzt geschlossene Kerze stark ist (hat die Farbe ColorBuy3 oder ColorSell3).
- VeryStrongSignalAlert - Wenn diese Option aktiviert ist, werden Warnungen angezeigt, wenn der zuletzt geschlossene Kerzenhalter sehr stark ist.
- EnablePatternVolumes - Aktiviert die Volumenanalyse bei der Suche nach Candlestick-Mustern.
- CountCandlesLength - Die Anzahl der Kerzen in der Historie für die Analyse von Kerzenmustern.
- EnablePatternAlert - Aktiviert Warnungen, wenn das Candlestick-Modell angezeigt wird.
- MinPatternForce - minimale Signalstärke des Candlestick-Modells für das Auftreten eines Alarms (1-3);
- ColorBuy1 - Farbe schwacher bullischer Kerzen;
- ColorBuy2 - Farbe von bullischen Kerzen mittlerer Stärke;
- ColorBuy3 - Farbe starker bullischer Kerzen;
- ColorBuy4 - die Farbe der stärksten bullischen Kerzen;
- ColorSell1 - Farbe schwacher bärischer Kerzen;
- ColorSell2 - Farbe von bärischen Kerzen mittlerer Stärke;
- ColorSell3 - Farbe starker bärischer Kerzen;
- ColorSell4 - die Farbe der stärksten bärischen Kerzen;
- CandlesWidth - die Farbe der Kerzen;
- PatternNameDistance - Der Abstand zwischen der Kerze und dem Namen, um die Namen der Muster im Diagramm anzuzeigen.


Der Benutzer hat keinen Kommentar hinterlassen