• Übersicht
  • Bewertungen (10)
  • Diskussion (7)
  • Neue Funktionen

BACD Cloud

5

Oder B ermaui A verage C onvergence D ivergence Cloud , ein Oszillator, der die Trendrichtung anzeigt und seine Stärke in Prozent misst. Die Berechnung der BACD Cloud sieht wie folgt aus:

1- Berechnen Sie zwei exponentiell gleitende Durchschnitte. Einer von ihnen ist schneller als der andere. Ich werde die erste (schnell) und die zweite (langsam) anrufen

2- Finden Sie das Zentrum zwischen ihnen, wobei: Center MA = (Fast + Slow) / 2

3- Berechnen Sie die BACD-Linie wie folgt: BACD = 100 * (Fast / Center MA)

4- Berechnen Sie die BACD-Signallinie, die ein exponentieller gleitender Durchschnitt des BACD ist. Die Formel lautet wie folgt: BACD-Signal = EMA (BACD)

5- Blenden Sie die BACD-Signallinie aus dem Diagramm aus.

6- Berechnen Sie die BACD-Histogrammlinie, die der Unterschied zwischen der BACD-Linie und ihrer Signallinie ist. (Hinweis: Das BACD-Histogramm wird auf dem Diagramm als Linie gezeichnet, nicht als Histogramm.)

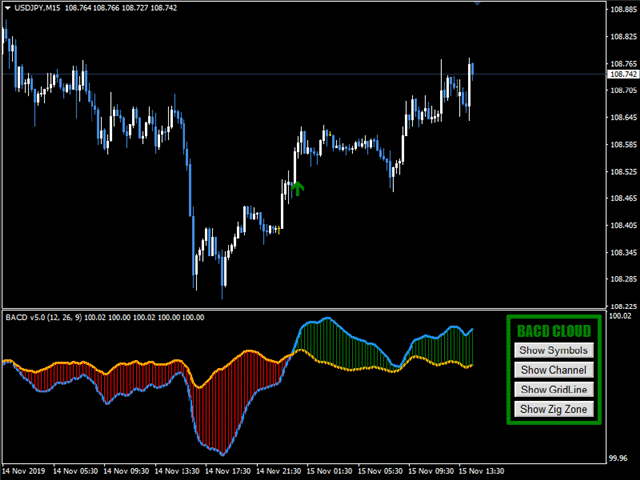
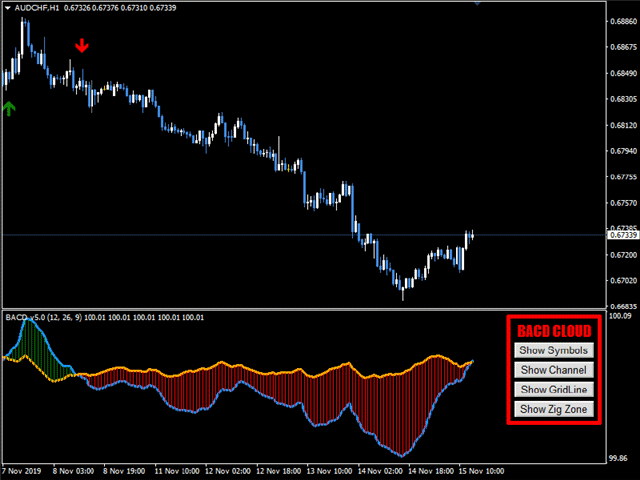
7- Wenn (BACD-Linie > BACD-Histogrammlinie) dann zeichnen Sie eine grüne Wolke, um den Trend darzustellen.

8- Wenn (BACD-Linie < BACD-Histogrammlinie) dann zeichnen Sie eine rote Wolke, um den Trend darzustellen.

Wichtige Links:


Wie verwendet man den Indikator?

  1. Kaufen und verkaufen Sie je nach Indikatorpfeilen.
  2. Die Divergenz zwischen BACD Clouds und Preiskerzen deutet auf eine nahezu Umkehr des aktuellen Trends hin.
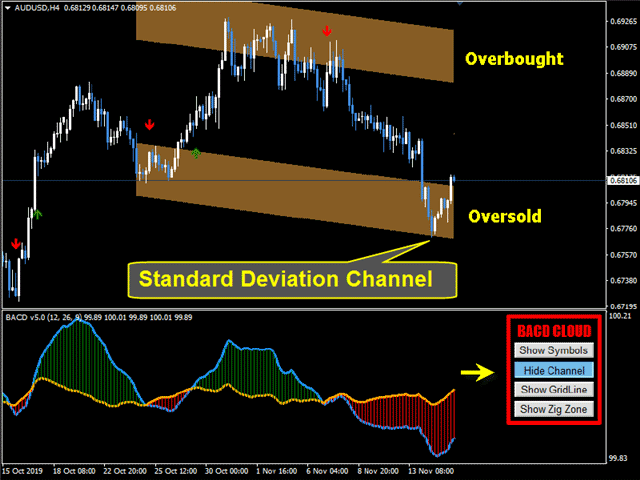
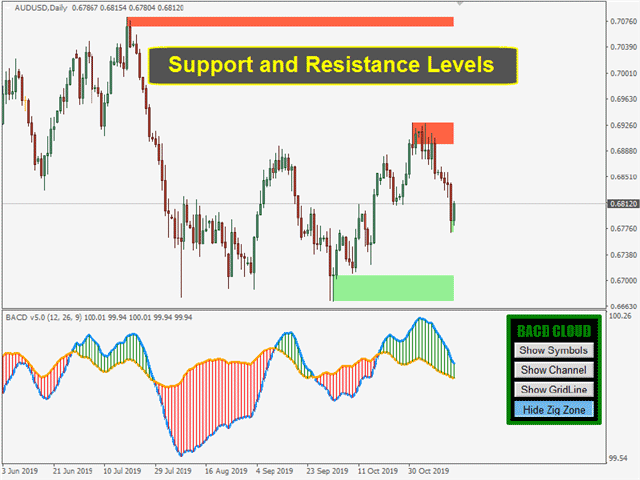
  3. Verwenden Sie Kanäle, gerundete Zahlenraster und Zig-Levels, um Ihren Take-Profit und Stop-Loss zu bestimmen.

BACD Cloud-Funktionen.

  • BACD Cloud zeichnet seine Ergebnisse nicht neu und berechnet sie auch nicht neu.
  • Gut gestaltete Parameter, die dem Benutzer helfen, leicht zwischen ihnen zu navigieren.
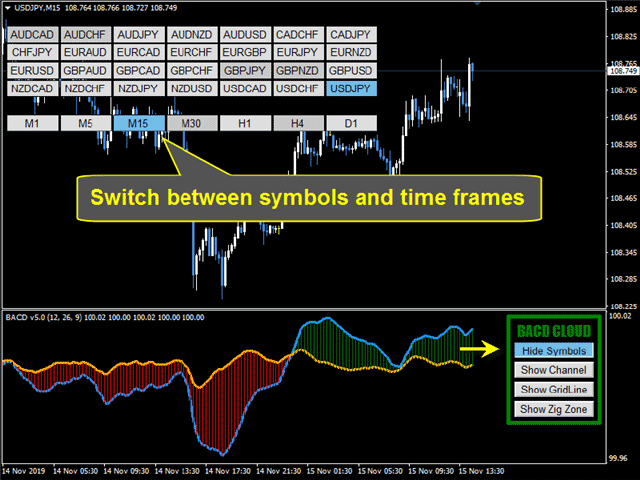
  • Sie können ganz einfach zwischen FX-Paaren wechseln, indem Sie die Symboltaste drücken.
  • Sie können einen Standardabweichungskanal einfach hinzufügen, indem Sie die Kanaltaste drücken.
  • Sie können ein Raster aus verschiedenen Stufen von runden Zahlen hinzufügen.
  • Sie können Unterstützungs- und Widerstandsstufen (Zig Zone Levels) hinzufügen.
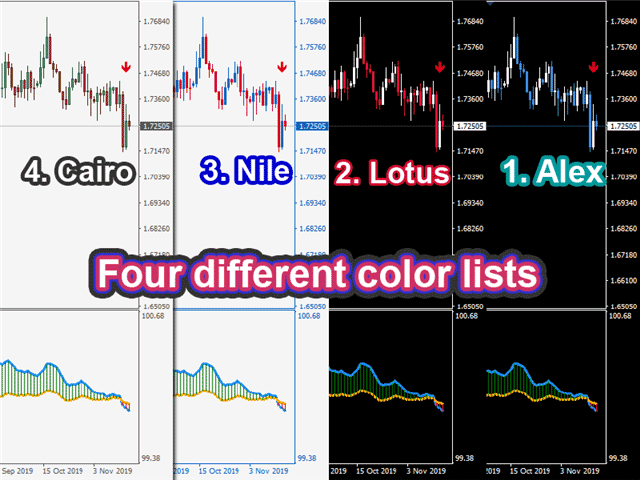
  • Sie können zwischen vier verschiedenen Farblisten wählen.
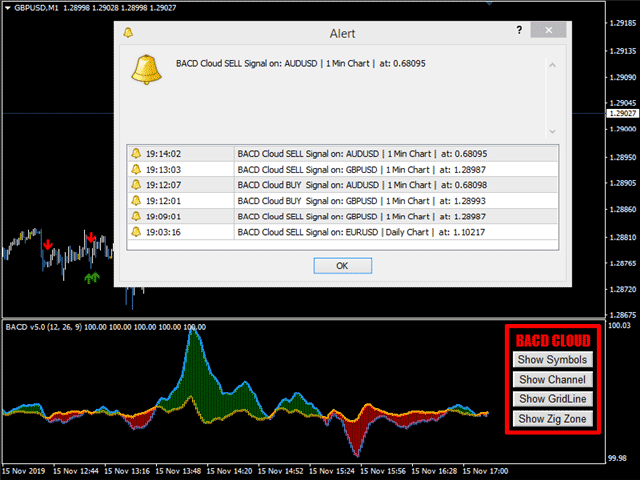
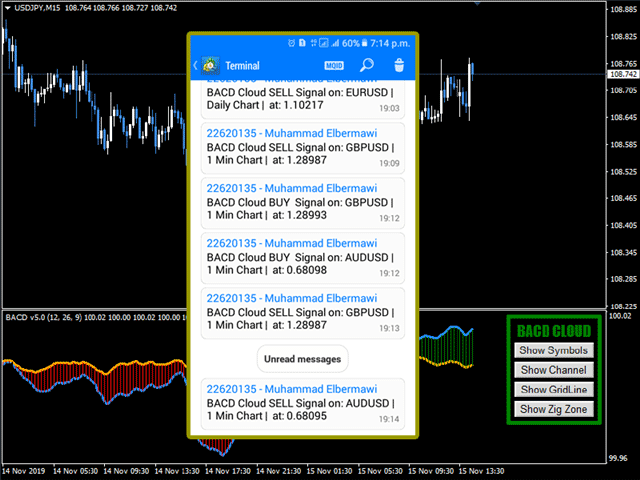
  • Ton, mobile Benachrichtigung und E-Mail-Benachrichtigungen je nach Wahl des Benutzers.
  • Der BACD Cloud-Code wurde überarbeitet, um sicherzustellen, dass er nicht den PC-Speicher des Benutzers verbraucht.

BACD-Cloud-Parameter

1) ANZEIGEPARAMETER
  • Schnelle MA-Periode.Standard ist 12
  • Langsame MA-Periode.Standard ist 26
  • Signalleitungsperiode.Standard ist 9
2) PFEILE & WARNUNGEN
  • Pfeile und Linienanzeigen: Standardmäßig werden nur Pfeile angezeigt
  • Pfeile Größe.Standard ist eins
  • Warnung bei neuem Pfeil:Standard ist wahr
  • E-Mail bei neuem Pfeil senden:Standard ist falsch
  • Mobile Benachrichtigung bei neuem Pfeil senden:Standard ist falsch
3) EINSTELLUNGEN FÜR DIENSTPROGRAMME
  • Quelle vonSymbolen: Holen Sie sich Symbole aus der benutzerdefinierten Symbollisteoder aus der Marktüberwachung.
  • Liste der Symbole (getrennt durch ";"):Wenn Sie Symbole aus einer benutzerdefinierten Liste auswählen, trennen Sie die Symbole durch ";".
  • Schaltfläche Schriftgröße.Standard ist 10.
  • Diagramm im Vordergrund.Zeigen Sie Chartkerzen über allen Indikatorobjekten an. Der Standardwert ist falsch.
  • Kanallänge [> 1].Anzahl der Kerzen, die bei der Kanalberechnung verwendet werden. Standard ist 100.
  • Bedienfeld erscheint [Umschalt + Buchstabe].Buchstaben zum Drücken der Plus-Umschalttaste, damit das Bedienfeld angezeigt wird. Standard ist "A"
  • Bedienfeld verschwindet [Umschalt + Buchstabe].Buchstaben zum Drücken plus Umschalttaste, um das Bedienfeld auszublenden. Standard ist "D"
  • Chart Colors List:Der Benutzer kann zwischen vier verschiedenen Farblisten für sein Chart wählen oder er kann wählen (Nichts tun), wenn er seine eigene Liste verwenden möchte.


Wenn Sie Fragen haben, kontaktieren Sie mich bitte über eine private Nachricht oder schreiben Sie diese in den Kommentarbereich.
Muhammad Al Bermaui, CMT


Bewertungen 10
Paulina Andrea Madariaga Figueroa
4147
 

Very good indicator, I have spent money in another indicators and with Bermaui tools I have everything.

Deepan Kalaiselvan
231
Deepan Kalaiselvan 2021.04.13 04:35 
 

Nice trend indicator

Kahraman Senol
1701
Kahraman Senol 2021.03.02 14:17 
 

Special Thanks to Muhammad Elbermawi, i bought BACD Cloud, Bermaui Bands, Bermaui Deviation Percent and True direction oscillator. I am using them on my real trading account with MA50 and ichimoku indicators. Successful trade rate is over %70. This is enough for me. i decided to write a EA which uses all 6 indicators.I confirm the entry point buy or sell with all 6 indicators at the same time. It is five star product at the price.

https://www.mql5.com/en/signals/1195681

Empfohlene Produkte
Mit diesem Handelstool können Sie 15 Märkte gleichzeitig scannen. Einführung eines neuen Handelsindikators 2024: ️ Dashboard Multi-Währung Multi-Time-Frame Stochastic. Es gibt mindestens zwei Gründe, warum ich dieses Handelstool entwickelt habe: Erstens ist es mir langweilig, nur einen Markt zu beobachten. Zweitens möchte ich den Einstieg in einen anderen Markt nicht verpassen. Deshalb möchte ich gleichzeitig auch andere Marktbedingungen kennen. Aus diesem Grund benötige ich einen
PX Trend
Vitalii Zakharuk
PX Trend is a technical indicator that mathematically transforms the price of a currency pair in the form of signaling arrows on the chart, it is used to predict the direction of the market movement. This tool is basic for the interpretation of the parameters of the graphs in technical analysis. PX Trend refers to an arrow indicator Forex - a tool that gives unambiguous signals to buy or sell currencies using arrows. An arrow directed upwards recommends buying, downward - selling. The indicat
Implement
Vitalii Zakharuk
5 (1)
Implement analyzes market dynamics for pivot points. If you want to learn how to spot the correct reversals for consistently likely profitable trading, buy this indicator. Shows favorable moments of entering the market in stripes. Ready-made trading system. The principle of operation of the indicator is to automatically determine the current state of the market when placed on a chart, analyze historical data based on historical data and display instructions for further actions on the trader's
Trend Suffer
Philip Effiong Philip
Alerts you on new trends, with ENTRY and EXIT points. INSTRUCTIONS  Select asset of choice, activate the indicator on the chart and just follow the signals from the arrows. ITS FREE, GIVE ME A GOOD RATING! Platform : Metatrader4 Asset : All Currencies, Gold, BTCUSD, NASDAQ PS : F or newbie and pro traders. Used by more 3,000 traders around the world. Send  a mail for further help and information...........
Dynamic SR Trend Channel Dynamic SR Trend Channel is a simple indicator for trend detection as well as resistance/support levels on the current timeframe. It shows you areas where to expect possible change in trend direction and trend continuation. It works with any trading system (both price action and other trading system that use indicators) and is also very good for renko charting system as well. In an uptrend, the red line (main line) serves as the support and the blue line serves as the
FBO Impact  is a professional yet simple to use trend following system. It detects the prevailing trend and gives entry points after pullbacks to significant price levels. To determine the trend it uses a unique filtering algorithm. Suitable for defining entry points for scalping as well as for intra-day trading. Features Works with the prevailing market trend. Suitable for all currency pairs. Ideal for all time frames but higher time frames are recommended. Does not redraw/repaint the arrows on
Trend MagicX
Hafis Mohamed Yacine
A trending market is one in which price is generally moving in one direction. ... When trading a trend-based strategy, traders usually pick the major currencies as well as any other currency utilizing the dollar because these pairs tend to trend and be more liquid than other pairs.  Best Trend Indicator That Tells You the Direction of the Trend   Trend MagicX_v1.1 displays the trend direction, duration, intensity and the resulting trend rating for all time frames in real time. You'll see at
This is a simple PriceTMA bands, non repaint! it can be used for a trend following system or sometimes reversals. as a main signal or a filter for others strategies, it depends on the trader main strategy. calculations for this indicator are a combined Algorithm between moving averages "MA" and average true range"ATR". good luck with your trading! i hope it is helpful Cheers
Valentines
Victor Golovkov
Valentines trend is an easy-to-use indicator that hides a powerful calculation math-system "under the hood". Attach the indicator to the chart and set the parameters. Period - period for tracking changes in quotes Amount of Bars - number of last bars to track You do not need to select any numerical parameters. The indicator will do everything for you automatically . Each signal is generated on the current bar, and in order not to miss it, use the built-in alerts and notifications system . The in
RoyalPrince Fibo
Richard Louis Pastor
4.88 (16)
Royal Prince Fibonacci , has the most advance Trend detection algorithm built into its Alert system combined with the RoyalPrince Non-repaint Arrows with it's own alert system you will never miss the opportunity of the trade.  2nd picture is how to use Guide on how i use it to Scalp or take long trades. works on all Charts and all Timeframe on mt4. ︎Best Timeframe M15 for scalping  H1 for Day Trading Options: • Fibonacci days High and Lows  • Fibonacci Targets • Fibonacci Alert System • Tren
Die Zeigeleuchte "Cool volumes" basiert auf den Teakvolumina des Mt4. Der Indikator selbst verfolgt in einem bestimmten Zeitraum (Auswahl eines Zeitrahmens) die Anzahl der zu kaufenden oder zu verkaufenden Volumina. Und wenn es einen abnormalen Überschuss an Verkäufern oder Käufern gibt, gibt es ein Signal für den Verkauf oder Kauf aus. Im unteren Fenster werden farbige Histogramme gezeichnet, wobei die Farbe Grün die gegenwärtige Vorherrschaft der Käufer anzeigt, was eine potenzielle sofor
Global Trend
Vitalii Zakharuk
Global Trend Indicator, shows the signals for entry. Displays both entry points and the trend itself. Shows statistically calculated moments for entering the market with arrows. When using the indicator, the risk factor can be optimally distributed. Settings: Uses all one parameter for settings. Choosing a parameter, it is necessary to visually resemble it so that the appropriate graph has a projection of extremes. Parameters: Length - the number of bars for calculating the indicator.
移動平均線クロス、ボリンジャーと移動平均線のクロス、移動平均線の角度でサイン表示 MT5インジケータ こちらに サイト とがあります。 このインジケータは3つのパターンでサインを表示(切り替え可能)します。 ①   移動平均線のクロス ②   ボリンジャーバンドと短期移動平均線とのクロス ③   ボリンジャーバンドと短期移動平均線とのクロスと、中期移動平均線と長期移動平均線の角度 移動平均線のクロス 指定した短期移動平均線と長期移動平均線のゴールデンクロスでは買いサイン、デットクロスでは売りサインを表示します。 ディフォルトでは短期は5,長期は20となっています。 もちろん変更可能になります。 移動平均線の種類をEMA(指数平滑移動平均線)やSMMA(平滑化移動平均)などに変更可能で適する価格も変更可能になります。 ボリンジャーバンドと短期移動平均線のクロス ボリンジャーバンド(以降BB)と短期移動平均線のクロスでサインを表示します。 ディフォルトではBB+1σと5MAのゴールデンクロスで買いサイン、BB-1σと5MAのデットクロスで売りサインでサインを表示します。 BBの期間や
Note : The slow loading of the indicator issue has been addressed . This new version loads fast and does not slow the platform. Version 1.3 : We have updated the indicator to include an historical bar scanning option . So instead of scanning all bars in the history (which can make the indicator slow sometimes ) , you can select the maximum number of bars it can scan which can increase the performance and make the indicator faster. This indicator scans the 1-3 Trendline pattern . The indic
Arrow indicator, to determine adjustments and local trends The arrow appears on the current bar and after closing the bar will not disappear. Allows you to enter the transaction at the very beginning of the movement Thanks to the flexible settings you can use on any currency pairs, metals and cryptocurrency Can be used when working with binary options Distinctive features Does not redraw. Additional parameters for fine tuning. Works on all timeframes and symbols. Suitable for trading c
Market Profile
Artem Titarenko
5 (1)
The "Market Profile" indicator displays the profiles and volumes of periods – weekly, daily, session (8-hour), 4-hour, hour, summary. The VAH/VAL price area is automatically highlighted by a dotted line for each profile (except for the summary). The indicator includes chroma Delta, which colors the profile areas. The areas of prevailing Buys is colored in green, that of Sells - in red. The intensity histogram features blue/red respectively. In the filter mode, the indicator displays the volume a
ROC acceleration-deceleration is the manual system for medium-term scalping. Indicator based on custom ROC system which defines bullish/bearish market and especially  acceleration-deceleration of tendention in the market's main direction. Buy arrow is plotted during bearish market when current trend decelerates and sell  arrow is plotted during bullish market when current trend decelerates. Main Indicator's Features Signals are not repaint,non-late or disappear(exept cases when system recalculat
SFO Trend Racer
Tevin Marshall
5 (1)
SFO Trend Racer system is a trend indicator created by the CEO and Founder of " Simple Forex Options ", Tevin Marshall . It serves 6 different functions all in one. It shows the trader the entry signals as well as exit signals, whether it is a take profit or a stop loss. It also uses trend filters and signal confirmations so that the trader is able to make the most logically fit decision. Trend Racer uses various filters and specific settings from a plethora of indicators. The beauty in this ind
Dictator
Vitalii Zakharuk
The Dictator indicator is based on the process of detecting the rate of change in price growth and allows you to find points of entry and exit from the market. a fundamental technical indicator that allows you to assess the current market situation in order to enter the market of the selected currency pair in a trend and with minimal risk. It was created on the basis of the original indicators of the search for extremes, the indicator is well suited for detecting a reversal or a large sharp jer
Indicador Taurus All4
Fabio Oliveira Magalhaes
Taurus All4 Taurus All4 is a high-performance indicator, it will tell you the strength of the trend, and you will be able to observe the strength of the candle. Our indicator has more than 4 trend confirmations. It is very simple and easy to use. Confirmation Modes Candle Trend Confirmations: When the candle switches to light green the trend is high. When the candle switches to light red the trend is reverting down. When the candle changes to dark red the trend is low. Trendline Trend Conf
Based on the Dow Theory, the system automatically draws a turning point, which is the starting point for buying or selling. It also automatically tells you whether the market is in a buying or selling condition and recognizes the environment. It is also a good tool to prevent false trades and to make profitable trades. We are live-streaming the actual operation of the system. Please check for yourself if it is usable. Please check it out for yourself. https://www.youtube.com/@ganesha_forex
Diamonds Min5   - DM5-   DM5   is an indicator that suggests entering levels (sell or buy) ,it always follow the trends using parabolic sar ,  working on is so easy, you need just to attach it to the chart and all the magic will show , this indicator does not repeat itself or redraw signals . After months of testing, it provides a very good result     it works on all pairs with no excaption 
The Sensitive Oscillator indicator is designed to find trends. It recognizes trends with its own algorithm and changes color. Finds trends relative to the degree of sensitivity. You can use it in all time periods. You can use this indicator alone or in conjunction with other indicators suitable for your other strategies. Transaction strategies You can do breakout strategies with this indicator. Each time you change colors, you can enter the process. You can use it in the long run by putting st
Delta AG
Yurij Kozhevnikov
The difference between the arithmetic and geometric means at the specified range. Since the greater is the difference between the values, the greater the resulting figure is, actually the indicator shows volatility fluctuations. The arithmetic mean of a certain number of values ​​is the sum of the values ​​divided by their number. The geometric mean is the root of the power of the number of values ​​extracted from the product of these values. If all values ​​are equal, the arithmetic mean and th
TH3ENG CURRENCY STRENGTH SCANNER The best currency strength reader based on more than 4 excellent modes, based on Price action and Volume with various algorithms. This indicator reads all pairs data to measure and find the best results of all currencies and arrange it in a separated dashboard panel. You can find the strongest currency and the weakest currency, then trade on them pair. NOT COPLICATED NOT REPAINTING NOT LAGING Input Parameters === SYSTEM SETTING  === Calc. Mode ==> Calculatio
FREE
SuperEntryx
Abdulkarim Karazon
Super Entry ist ein All-in-One-Indikator vom Typ Pfeil, der Long- und Short-Signale sowie TP- und SL-Levels liefert, die auf dem ATR-Wert basieren und geändert und optimiert werden können. Dieser Indikator bietet ein Backtesting-Panel, das die Gewinnrate und andere Statistiken anzeigt Geben Sie eine klare Vorstellung davon, wie viel Genauigkeit zu erwarten ist. Dieser Indikator wird nicht neu oder rücklackiert und das Signal kommt ohne Verzögerung bei offenem Balken. Parameter: Einstellun
A top-quality from the famous XSuper Trend indicator. It is completely loyal to the original algorithm, and implements many useful features Which includes Trend Indicators as Filters like MACD,CCI and Alligator. The Chefs Super Trend Plus Indicator is a great way to identify the current market trend. The indicator shows a clear distinction between uptrends and downtrends. The indicators has optional filters for sound signal. Suitable for the following trending pairs: EUR/USD, GBP/USD, USD/JPY,
Alpha Trend Spotter (ATS) Volume Break Out This is an indicator that combines Volume breakout/breakdown and Moving Average Breakout/breakdown. It is able to predict further price changes. It is not repainted, not recalculated. All lines are shown at the open of a new candlestick, never winking or vanishing in the current candle. These lines are appeared at the beginning of the current candle. Suitable for M5 to D1 Timeframe. How to Use: If Green line appears, that shows the "oversold" area, so t
This indicator shows data from 9 currency pairs by your choice for all 9 Time Frames. If a digital value of the RSI is less or equal to DnLevel = 30 (or whatever number you decided to put) then a Green square will appear. This is potentially an oversold condition and maybe a good time to go Long. If a digital value of the RSI is greater or equal to UpLevel = 70 (or whatever number you decided to put) then a Red square will appear. This is potentially an overbought condition and maybe a good time
Käufer dieses Produkts erwarben auch
Gann Made Easy
Oleg Rodin
4.85 (82)
Gann Made Easy ist ein professionelles und einfach zu bedienendes Forex-Handelssystem, das auf den besten Handelsprinzipien unter Verwendung der Theorie von Mr. basiert. W.D. Gann. Der Indikator liefert genaue KAUF- und VERKAUFSsignale, einschließlich Stop-Loss- und Take-Profit-Levels. Mit PUSH-Benachrichtigungen können Sie auch unterwegs handeln. Bitte kontaktieren Sie mich nach dem Kauf! Ich werde meine Handelstipps und tolle Bonusindikatoren kostenlos mit Ihnen teilen! Wahrscheinlich haben Si
TPSpro RFI Levels
Roman Podpora
4.82 (22)
ANWEISUNGEN    Russland -    ENG    Die Empfehlung basiert auf dem Indikator -   TPSpro   TREND PRO -   Version MT5 Die wichtigsten Elemente in der Branche sind entweder in Zonen oder in der Fabrik enthalten, oder sie führen zu einer Lösung bei einem Kauf oder dem Verkauf eines anderen Instruments. Wenn viele Menschen ihre Rechte nicht auf dem Händlerkonto verschlüsseln, werden die Folgen nicht schnell genug sein. Ich habe es damit abgeschlossen, dass ich diese Folgen nun noch interpretieren un
Gold Stuff
Vasiliy Strukov
4.89 (239)
Gold Stuff-Ein Trendindikator, der speziell für Gold entwickelt wurde, kann auch auf allen Finanzinstrumenten verwendet werden. Der Indikator wird nicht neu gezeichnet und verzögert sich nicht. Empfohlener Zeitrahmen H1. Nach diesem Indikator geschrieben EA Gold Stuff Berater, können Sie es in meinem Profil finden. WICHTIG! Kontaktieren Sie mich sofort nach dem Kauf, um Anweisungen und Bonus zu erhalten!   Sie können eine kostenlose Kopie unseres Strong Support- und Trendscanner-Indikators
Atomic Analyst
Issam Kassas
5 (2)
Zunächst einmal ist es erwähnenswert, dass dieser Handelsindikator nicht neu malt, nicht neu zeichnet und keine Verzögerung aufweist, was ihn sowohl für manuellen als auch für Roboterhandel ideal macht. Benutzerhandbuch: Einstellungen, Eingaben und Strategie. Der Atom-Analyst ist ein PA-Preisaktionsindikator, der die Stärke und das Momentum des Preises nutzt, um einen besseren Vorteil auf dem Markt zu finden. Ausgestattet mit fortschrittlichen Filtern, die helfen, Rauschen und falsche Signale z
Trend Punch
Mohamed Hassan
4.95 (19)
This indicator is unstoppable when combined with our other indicator called  Support & Resistance . After purchase, send us a message and you will get it   for  FREE as a BONUS! Introducing Trend Punch , the revolutionary forex trend indicator that will transform the way you trade! Trend Punch is uniquely designed to provide precise buy and sell arrows during strong market trends, making your trading decisions clearer and more confident. Whether you're trading major currency pairs or exotic sym
TPSproTREND PrO
Roman Podpora
4.79 (19)
TPSpro TREND PRO   ist ein Trendindikator, der den Markt automatisch analysiert und Informationen über den Trend und jede seiner Änderungen liefert sowie Signale für den Einstieg in Geschäfte ohne Neuzeichnung gibt! Der Indikator verwendet jede Kerze und analysiert sie separat. bezieht sich auf verschiedene Impulse – Aufwärts- oder Abwärtsimpuls. Exakte Einstiegspunkte in Transaktionen für Währungen, Krypto, Metalle, Aktien, Indizes! Version MT5                   VOLLSTÄNDIGE BESCHREIBUNG DES
MetaBands M4
Vahidreza Heidar Gholami
5 (2)
MetaBands verwendet leistungsstarke und einzigartige Algorithmen, um Kanäle zu zeichnen und Trends zu erkennen, sodass es Tradern potenzielle Punkte für den Einstieg und Ausstieg aus Trades bieten kann. Es ist ein Kanalindikator sowie ein leistungsstarker Trendindikator. Es umfasst verschiedene Arten von Kanälen, die einfach durch Verwendung der Eingabeparameter zusammengeführt werden können. MetaBands verwendet alle Arten von Warnmeldungen, um Benutzer über Marktereignisse zu informieren. Funkt
- Real price is 80$ - 40% Discount ( It is 49$ now ) Contact me for instruction, add group and any questions! Related Product:  Bitcoin Expert Introduction The breakout and retest strategy is traded support and resistance levels. it involves price breaking through a previous level.  The break and retest strategy is designed to help traders do two main things, the first is to avoid false breakouts. Many false breakouts start with a candlestick that breaks out of a level but ends with an immediat
FX Volume
Daniel Stein
4.58 (33)
Erhalten Sie Ihr tägliches Marktupdate mit Details und Screenshots über unser Morning Briefing hier auf mql5 und auf Telegram ! FX Volume ist der ERSTE und EINZIGE Volumenindikator, der einen ECHTEN Einblick in die Marktstimmung aus Sicht eines Brokers bietet. Es bietet fantastische Einblicke in die Positionierung von institutionellen Marktteilnehmern, wie z.B. Brokern, auf dem Forex-Markt, viel schneller als COT-Berichte. Diese Informationen direkt auf Ihrem Chart zu sehen, ist der wahre Game
Scalper Inside PRO
Alexey Minkov
4.73 (56)
An exclusive indicator that utilizes an innovative algorithm to swiftly and accurately determine the market trend. The indicator automatically calculates opening, closing, and profit levels, providing detailed trading statistics. With these features, you can choose the most appropriate trading instrument for the current market conditions. Additionally, you can easily integrate your own arrow indicators into Scalper Inside Pro to quickly evaluate their statistics and profitability. Scalper Inside
Trend Screener
STE S.S.COMPANY
4.8 (87)
Trendindikator, bahnbrechende, einzigartige Lösung für Trendhandel und -filterung mit allen wichtigen Trendfunktionen in einem Tool! Es handelt sich um einen 100 % nicht neu zu malenden Multi-Timeframe- und Multi-Währungs-Indikator, der für alle Symbole/Instrumente verwendet werden kann: Forex, Rohstoffe, Kryptowährungen, Indizes und Aktien. ZEITLICH BEGRENZTES ANGEBOT: Der Support- und Resistance-Screener-Indikator ist für nur 50 $ und lebenslang verfügbar. (Ursprünglicher Preis 250 $) (Angebot
Enigmera
Ivan Stefanov
5 (3)
ENIGMERA: Der Kern des Marktes https://www.enigmera.com Einführung Dieser Indikator und dieses Handelssystem sind ein bemerkenswerter Ansatz für die Finanzmärkte. ENIGMERA nutzt die fraktalen Zyklen zur genauen Berechnung von Unterstützungs- und Widerstandsniveaus. Er zeigt die echte Akkumulationsphase an und gibt Richtung und Ziele vor.  Ein System, das funktioniert, egal ob wir uns in einem Trend oder in einer Korrektur befinden.  Wie funktioniert es? ENIGMERA besteht aus drei Linien: der
FX Power MT4 NG
Daniel Stein
5 (12)
Erhalten Sie Ihr tägliches Marktupdate mit Details und Screenshots über unser Morning Briefing hier auf mql5 und auf Telegram ! FX Power MT4 NG ist die nächste Generation unseres langjährig sehr beliebten Währungsstärkemessers FX Power. Und was bietet dieser Stärkezähler der nächsten Generation? Alles, was Sie am ursprünglichen FX Power geliebt haben PLUS GOLD/XAU-Stärkeanalyse Noch präzisere Berechnungsergebnisse Individuell konfigurierbare Analysezeiträume Anpassbares Berechnungslimit für noc
Dynamic Forex28 Navigator – Das Forex-Handelstool der nächsten Generation AKTUELL 49 % RABATT. Dynamic Forex28 Navigator ist die Weiterentwicklung unserer seit langem beliebten Indikatoren und vereint die Leistung von drei in einem: Advanced Currency Strength28 Indicator (695 Bewertungen) + Advanced Currency IMPULSE mit ALERT (520 Bewertungen) + CS28 Combo Signals (Bonus) Details zum Indikator https://www.mql5.com/en/blogs/post/758844 Was bietet der Strength Indicator der nächsten Generation?
Derzeit 20% Rabatt! Die beste Lösung für jeden Neueinsteiger oder Expert Händler! Dieses Dashboard arbeitet mit 28 Währungspaaren. Es basiert auf 2 unserer Hauptindikatoren (Advanced Currency Strength 28 und Advanced Currency Impulse). Es bietet einen hervorragenden Überblick über den gesamten Forex-Markt. Es zeigt die Werte der Advanced Currency Strength, die Veränderungsrate der Währungen und die Signale für 28 Devisenpaare in allen (9) Zeitrahmen. Stellen Sie sich vor, wie sich Ihr Hande
Bomb Bank Signal
Igor Pereira Calil
5 (1)
Bombenbanksignal: Ihr Vertrauensindikator in MetaTrader 4 Bomb Bank Signal ist ein leistungsstarker Indikator für MetaTrader 4, der entwickelt wurde, um die relevantesten Trends auf dem Finanzmarkt zu identifizieren. Wenn Sie nach einem Tool suchen, das Bewegungen genau vorhersieht, ist die Bomb Bank der Verbündete, den Sie brauchen. So funktioniert es: Dieser Indikator kombiniert drei unterschiedliche Methoden – Volumenanalyse, Kerzenschließungen und symmetrischer Trend –, um Kauf- und V
Trend Cutter
Oleg Rodin
5 (2)
Trend Cutter ist ein Trendindikator, der für jeden Zeitrahmen verwendet werden kann, einschließlich der niedrigeren Zeitrahmen wie M1 und M5. Der Indikator ist ideal für Händler, die den Intraday-Handel bevorzugen, und wird auch für diejenigen hilfreich sein, die den langfristigen Handel bevorzugen. Sie können diesen Indikator als Basis für Ihr Handelssystem oder als eigenständige Handelslösung verwenden. Der Indikator bietet alle Arten von Warnungen, einschließlich PUSH-Benachrichtigungen. Der
Der Chart Patterns All-in-One Indikator hilft Tradern, verschiedene Chartmuster, die häufig in der technischen Analyse verwendet werden, zu visualisieren. Dieser Indikator unterstützt die Identifizierung möglicher Marktbewegungen, garantiert jedoch keine Rentabilität. Es wird empfohlen, den Indikator vor dem Kauf im Demomodus zu testen. Aktuelles Angebot : 50 % Rabatt auf den "Chart Patterns All in One" Indikator. Enthaltene Muster : Muster 1-2-3 : Erkennt Marktumkehrungen mithilfe von drei Schl
Currency Strength Wizard ist ein sehr leistungsstarker Indikator, der Ihnen eine Komplettlösung für erfolgreichen Handel bietet. Der Indikator berechnet die Stärke dieses oder jenes Forex-Paares anhand der Daten aller Währungen in mehreren Zeitrahmen. Diese Daten werden in Form von benutzerfreundlichen Währungsindizes und Währungsstärkelinien dargestellt, anhand derer Sie die Stärke dieser oder jener Währung erkennen können. Sie müssen lediglich den Indikator an das Diagramm anhängen, mit dem Si
TakePropips Donchian Trend Pro
Eric John Pajarillaga Aldana
4.44 (16)
TakePropips Donchian Trend Pro   (MT4) ist ein leistungsstarkes und effektives Tool, das mithilfe des Donchian-Kanals automatisch die Richtung des Trends erkennt und Ihnen Handelssignale für den Ein- und Ausstieg liefert! Dieser Multifunktionsindikator umfasst einen Trendscanner, Handelssignale, ein statistisches Panel, einen Screener, Handelssitzungen und ein Dashboard für den Verlauf von Warnungen. Es wurde entwickelt, um Ihnen Handelssignale zu liefern und Ihnen Stunden beim Analysieren der C
Stratos Pali Indicator   is a revolutionary tool designed to enhance your trading strategy by accurately identifying market trends. This sophisticated indicator uses a unique algorithm to generate a complete histogram, which records when the trend is Long or Short. When a trend reversal occurs, an arrow appears, indicating the new direction of the trend. Important Information Revealed Leave a review and contact me via mql5 message to receive My Top 5 set files for Stratos Pali at no cost! D
Supply and Demand Dashboard PRO
Bernhard Schweigert
4.8 (20)
Derzeit 20% reduziert! Dieses Dashboard ist eine sehr leistungsfähige Software, die mit mehreren Symbolen und bis zu 9 Zeitrahmen arbeitet. Es basiert auf unserem Hauptindikator (Beste Bewertungen: Advanced Supply Demand ).   Das Dashboard gibt einen guten Überblick. Es zeigt: Gefilterte Angebots- und Nachfragewerte einschließlich der Zonenstärkebewertung, Pips-Abstände zu/und innerhalb von Zonen, Es hebt verschachtelte Zonen hervor, Es gibt 4 Arten von Alarmen für die gewählten Symbole in
Werden Sie Breaker Trader und profitieren Sie von Änderungen der Marktstruktur, wenn sich der Preis umkehrt. Der Order Block Breaker Indikator zeigt an, wann sich eine Trend- oder Preisbewegung der Erschöpfung nähert und bereit ist, sich umzukehren. Es weist Sie auf Änderungen in der Marktstruktur hin, die normalerweise auftreten, wenn eine Umkehrung oder ein größerer Rückzug bevorsteht. Der Indikator verwendet eine proprietäre Berechnung, die Ausbrüche und Preisdynamik identifiziert. Jedes
DERZEIT 26% RABATT Die beste Lösung für jeden Newbie oder Expert Trader! Dieser Indikator ist ein einzigartiges, qualitativ hochwertiges und erschwingliches Trading-Tool, da wir eine Reihe von proprietären Funktionen und eine neue Formel integriert haben. Mit nur EINEM Chart können Sie die Währungsstärke für 28 Forex-Paare ablesen! Stellen Sie sich vor, wie sich Ihr Handel verbessern wird, weil Sie in der Lage sind, den genauen Auslösungspunkt eines neuen Trends oder einer Scalping-Gelegenh
Zunächst einmal ist es wichtig zu betonen, dass dieses Handelstool ein Nicht-Repaint-, Nicht-Redraw- und Nicht-Verzögerungsindikator ist, was es ideal für professionelles Trading macht. Online-Kurs, Benutzerhandbuch und Demo. Der Smart Price Action Concepts Indikator ist ein sehr leistungsstarkes Werkzeug sowohl für neue als auch erfahrene Händler. Er vereint mehr als 20 nützliche Indikatoren in einem und kombiniert fortgeschrittene Handelsideen wie die Analyse des Inner Circle Traders und Stra
IX Power MT4
Daniel Stein
5 (5)
IX Power bringt die unschlagbare Präzision von FX Power endlich auch zu Nicht-Forex-Symbolen. Es bestimmt präzise die Intensität von kurz-, mittel- und langfristigen Trends in Ihren Lieblingsindizes, Aktien, Rohstoffen, ETFs und sogar Kryptowährungen. Sie können alles analysieren, was Ihr Terminal zu bieten hat. Probieren Sie es aus und erleben Sie, wie sich Ihr Timing beim Handel deutlich verbessert . IX Power Hauptmerkmale 100% präzise, nicht nachpinselnde Berechnungsergebnisse - für
DERZEIT 31% RABATT! Die beste Lösung für jeden Newbie oder Expert Trader! Dieser Indikator ist ein einzigartiges, qualitativ hochwertiges und erschwingliches Handelsinstrument, da wir eine Reihe von proprietären Funktionen und eine geheime Formel eingebaut haben. Mit nur EINEM Chart liefert er Alerts für alle 28 Währungspaare. Stellen Sie sich vor, wie sich Ihr Handel verbessern wird, weil Sie in der Lage sind, den genauen Auslösepunkt eines neuen Trends oder einer Scalping-Gelegenheit zu e
Dieses Dashboard ist ein Warntool zur Verwendung mit dem Indikator für die Umkehrung der Marktstruktur. Sein Hauptzweck besteht darin, Sie auf Umkehrmöglichkeiten in bestimmten Zeitrahmen und auch auf die erneuten Tests der Warnungen (Bestätigung) aufmerksam zu machen, wie es der Indikator tut. Das Dashboard ist so konzipiert, dass es auf einem eigenen Chart sitzt und im Hintergrund arbeitet, um Ihnen Benachrichtigungen zu Ihren ausgewählten Paaren und Zeitrahmen zu senden. Es wurde entwickelt,
PZ Day Trading
PZ TRADING SLU
3.67 (3)
Dieser Indikator erkennt Preisumkehrungen im Zick-Zack, wobei nur Preisaktionsanalysen und ein Donchian-Kanal verwendet werden. Es wurde speziell für den kurzfristigen Handel entwickelt, ohne dass ein Nachlackieren oder ein Backpainting erforderlich ist. Es ist ein fantastisches Werkzeug für clevere Trader, die darauf abzielen, das Timing ihrer Operationen zu verbessern. [ Installationsanleitung | Update-Anleitung | Fehlerbehebung | FAQ | Alle Produkte ] Erstaunlich einfach zu handeln Es bi
M1 Arrow
Oleg Rodin
4.73 (15)
Eine Intraday-Strategie, die auf zwei Grundprinzipien des Marktes basiert. Der Algorithmus basiert auf der Analyse von Volumina und Preiswellen mit zusätzlichen Filtern. Der intelligente Algorithmus des Indikators gibt nur dann ein Signal, wenn sich zwei Marktfaktoren zu einem vereinen. Der Indikator berechnet Wellen eines bestimmten Bereichs auf dem M1-Diagramm unter Verwendung der Daten des höheren Zeitrahmens. Und um die Welle zu bestätigen, verwendet der Indikator eine Volumenanalyse. Dieser
Weitere Produkte dieses Autors
True Direction Oscillator
Muhammad Elbermawi
4.86 (362)
Oder (TDO), ein Index, der die Preisänderungsrate nach dem Prinzip des „ Pure Momentum “ misst. Wenn ein Wertpapierkurs von 10 auf 15 steigt, beträgt die Preisänderungsrate 150%, aber wenn er von 15 auf 10 zurückgeht, beträgt die Preisänderungsrate nur 33,3%. Aus diesem Grund liefern Indikatoren der technischen Analyse wie "Price Rate of Change" (ROC) oder "Momentum" höhere Werte für aufsteigende Kursbewegungen als solche für absteigende. TDO behebt dieses Problem, um Händlern zu helfen, das Mo
Bermaui Manual EA
Muhammad Elbermawi
5 (9)
Dies ist ein halbautomatischer Fachberater, der das Netzsystem handelt. Die Idee ist, nach und nach verschiedene Positionen im Markt einzunehmen und dann den Break-Even-Level für sie zu berechnen. Wenn die Kurse diesen Break-Even um eine vorbestimmte Distanz überschreiten, werden alle geöffneten Orders geschlossen. Wichtige Informationen Hier ist die Bedienungsanleitung:   https://www.mql5.com/de/blogs/post/730567 Sie können diesen EA mit jedem meiner anderen Produkte hier ausprobieren: http
Bermaui Deviation Percent
Muhammad Elbermawi
4.94 (109)
Oder (BD%), ein Volatilitätsindex, der die Volatilität in Prozent statt in Punkten misst. Die Idee von BD% besteht darin, einen Index in Abhängigkeit von der Classic Standard Deviation (CSD) zu erstellen, die sich zwischen 0 und 100 Prozent bewegt. Sie können BD% verwenden, um die Volatilität für dasselbe Wertpapier in verschiedenen Zeiträumen oder Zeitrahmen zu vergleichen. Darüber hinaus können Sie BD% verwenden, um die Volatilität zwischen verschiedenen Wertpapieren in verschiedenen Märkte
MASR Bands
Muhammad Elbermawi
5 (5)
Oder M Oving A verage S upport R eständigkeit Bands. Der MASR-Bänder-Indikator ist ein gleitender Durchschnitt, der von zwei Bändern umgeben ist, die als Unterstützungs- und Widerstandsniveaus zusammenarbeiten. Statistisch enthalten MASR-Bänder in 93% der Fälle Preiskerzen. So wird es in Schritten berechnet: 1. Der erste Schritt besteht darin, das höchste Hoch (HHV) und das niedrigste Tief (LLV) für einen Zeitraum von X zu berechnen. 2. Der zweite Schritt besteht darin, HHV durch LLV zu
Or DBD%. The indicator consists of colored tape that shows trading signals depending on two Bermaui Deviation Oscillator (BD%) and two moving averages. Bermaui Deviation Percent is a volatility index that measures volatility in percent rather than points. The idea of BD% is to make an index depending on Classic Standard Deviation (CSD) that moves between 0 and 100 percent. Important Information DBD% expert advisor example:  https://www.mql5.com/en/blogs/post/731145 If you want to know mor
Bermaui Bands
Muhammad Elbermawi
4.97 (67)
Bermaui Bands (BB) ist ein technisches Analysetool, das dabei hilft, zwischen Bereichs- und Trendkursbewegungen zu filtern. Die Idee hinter diesem Indikator lässt sich in den nächsten Schritten erklären: Berechnen Sie die Standardabweichung als Oszillator, der sich zwischen 0 und 100 bewegt. Ich nenne sie Bermaui-Abweichung in Prozent (BD %). Wenn "BD %" nahe Null ist, ist die Volatilität am höchsten. Außerdem ist die Volatilität sehr gering, wenn "BD %" nahe 100 liegt. Hohe Volatilität bedeutet
Bermaui Pin Bars
Muhammad Elbermawi
5 (13)
Bermaui Pin Bars Oder (BPB) ist ein Indikator, der das Preisaktionsmuster von Pin Bars auf dem Chart findet. Pin Bars ist eine Abkürzung für "Pinocchio Bars", eine klassische Balkenmuster-Alternative zu japanischen Kerzenhaltern mit hohen oberen oder unteren Schatten und sehr kleinen Körpern wie Hammer, Inverted-Hammer, Hanging Man, Shooting Star, Dragon Fly Doji oder Grave Stone Doji . Bermaui Pin Bars Indikator findet dieses Muster abhängig von einer Formel, die in den nächsten Schritten er
Bermaui RSI Candles
Muhammad Elbermawi
5 (4)
Die Idee dieses Indikators besteht darin, den RSI in Form von Kerzen zu zeichnen, die mit Preischarts verglichen werden können, um Kauf- und Verkaufssignale zu generieren. Der Indikator ist nicht meine Erfindung. Ich habe es vor einigen Jahren im Internet gegründet. Ich habe den Code aktualisiert, Warnfunktionen hinzugefügt und die Bermaui Utilities-Toolgruppe hinzugefügt. Der Indikator berechnet den RSI aller Kurse, die zum Zeichnen von Kerzen verwendet werden (RSI des Eröffnungs-, Hoch-, Tie
Bermaui Channel
Muhammad Elbermawi
5 (19)
This is a price channel that shows five important price levels on the chart. Those levels are: 1. The Highest High (HH) of the previous x bars. 2. The Highest Low (HL) of the previous x bars. 3. The Center Line. 4. The Lowest High (LH) of the previous x bars. 5. The Lowest Low (LL) of the previous x bars. How does Bermaui Channels Captures Overbought  area Think of the distance between HH and HL levels as an overbought area. When the price candles or bars crosses the HL to the upside this
Moving Average Cloud
Muhammad Elbermawi
4.92 (13)
Oder "MAC". Dies ist ein Indikator, der Ihnen helfen soll, den Trend zu erfassen und zu handeln. Die Idee hinter diesem Indikator lässt sich in den nächsten Schritten erklären: Zeichnen Sie eine sich schnell bewegende durchschnittliche Hüllkurve. Zeichnen Sie eine sich langsam bewegende durchschnittliche Hüllkurve. Das MAC Upper Band ist der höchste Wert zwischen den Höhen beider Hüllkurven. Das MAC Lower Band ist der niedrigste Wert zwischen den Tiefstwerten beider Hüllkurven. Die MAC Histog
Classic Keltner Channel
Muhammad Elbermawi
4.87 (30)
Oder CKC. Dieser Indikator funktioniert in Abhängigkeit von der klassischen Zehn-Tage-Regel des gleitenden Durchschnitts, die von Chester W. Keltner (1909–1998) beschrieben wurde. Alle Parameter sind standardmäßig auf die klassische Version des Keltner-Systems eingestellt, während der Benutzer sie nach Belieben ändern kann. Wichtige Informationen CKC-Handbuch lesen: https://www.mql5.com/en/blogs/post/736577 CKC Expert Advisor Beispiel: https://www.mql5.com/en/blogs/post/734150 Über die Keltn
Horus EA
Muhammad Elbermawi
3 (2)
Horus EA für MT4 Vor Tausenden von Jahren erfanden die alten Ägypter ein Zählsystem, mit dem sie ihr Land vermessen und ihre Waren gewogen haben. Dieses System wurde als „ Auge des Horus “ bezeichnet. Das Auge des Horus wurde mit dem Mythos des Gottes Osiris in Verbindung gebracht und wurde zu einem der heiligen Symbole der Pharaonen. Ich habe die mathematischen Gleichungen im Auge des Horus mit der Fibonacci-Folge verwendet, um ein Geldverwaltungssystem mit negativer Progression zu bauen, da
Auswahl:
Paulina Andrea Madariaga Figueroa
4147
 

Very good indicator, I have spent money in another indicators and with Bermaui tools I have everything.

Deepan Kalaiselvan
231
Deepan Kalaiselvan 2021.04.13 04:35 
 

Nice trend indicator

Kahraman Senol
1701
Kahraman Senol 2021.03.02 14:17 
 

Special Thanks to Muhammad Elbermawi, i bought BACD Cloud, Bermaui Bands, Bermaui Deviation Percent and True direction oscillator. I am using them on my real trading account with MA50 and ichimoku indicators. Successful trade rate is over %70. This is enough for me. i decided to write a EA which uses all 6 indicators.I confirm the entry point buy or sell with all 6 indicators at the same time. It is five star product at the price.

https://www.mql5.com/en/signals/1195681

Tim Rijnbeek
1354
Tim Rijnbeek 2020.07.25 20:08 
 

Der Benutzer hat keinen Kommentar hinterlassen

Ferrari888
598
Ferrari888 2020.07.12 21:07 
 

Хороший индикатор .Мухаммед очень любезен подробно все объяснит и всегда отвечает на вопросы. Честный и порядочный человек.Спасибо Мухаммед.

[Gelöscht] 2020.06.04 01:23 
 

Der Benutzer hat keinen Kommentar hinterlassen

Makarios  Yacoubian
2911
Makarios Yacoubian 2020.04.17 01:25 
 

its my Second Indicators From Mr.Muhammad , again thanks for your excellent service, professional job . update 09.06.2020 , so far i am using this indicator in daily basis . good

Frank Paetsch
7086
Frank Paetsch 2020.03.16 01:03 
 

verry good. thank you

Nieco Pama
248
Nieco Pama 2020.01.20 14:17 
 

Der Benutzer hat keinen Kommentar hinterlassen

IK°L
814
IK°L 2019.12.31 18:13 
 

Der Benutzer hat keinen Kommentar hinterlassen

Antwort auf eine Rezension
Version 2.1 2020.03.30
1. Fixed a small bug in the de-initialization function, that used to cause the "Symbols Switch" tool not to work properly.
2. Organized the indicator parameters in a better style.
.
Note:
I didn't make any changes on TDO basic formula. It is still the same.
I didn't make serious changes in indicator parameters or buffers.
Version 2.0 2020.02.24
Fixed small bugs in the alert messages.
Fixed a small bug in the de-initialization function, that used to cause the symbols switch tool not to work properly.
.
Note:
I didn't make any changes on TDO basic formula. It is still the same.
I didn't make any changes in indicator parameters or buffers.