• Panoramica
  • Recensioni (10)
  • Commenti (7)
  • Novità

BACD Cloud

4.57

Oppure B ermaui A verage C onvergence D ivergence Cloud , che è un oscillatore che mostra la direzione del trend e ne misura la forza in percentuale. Il calcolo del BACD Cloud è il seguente:

1- Calcola due medie mobili esponenziali. Uno di loro è più veloce dell'altro. Chiamerò il primo (Veloce) e il secondo (Lento)

2- Trova il centro tra di loro, dove: Center MA = (Fast + Slow) / 2

3- Calcola la linea BACD come segue: BACD = 100 * (Fast / Center MA)

4- Calcola la linea del segnale BACD, che è una media mobile esponenziale del BACD. La formula è così: Segnale BACD = EMA (BACD)

5- Nascondi la linea del segnale BACD dal grafico.

6- Calcola la linea dell'istogramma BACD, che è la differenza tra la linea BACD e la sua linea di segnale. (Nota: l'istogramma BACD è disegnato sul grafico come una linea, non un istogramma.)

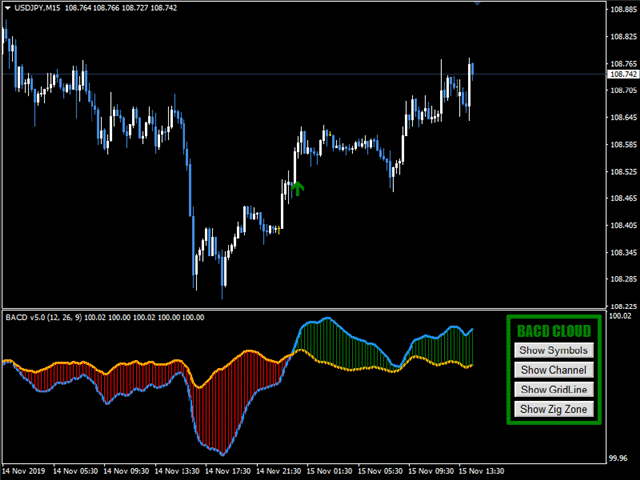
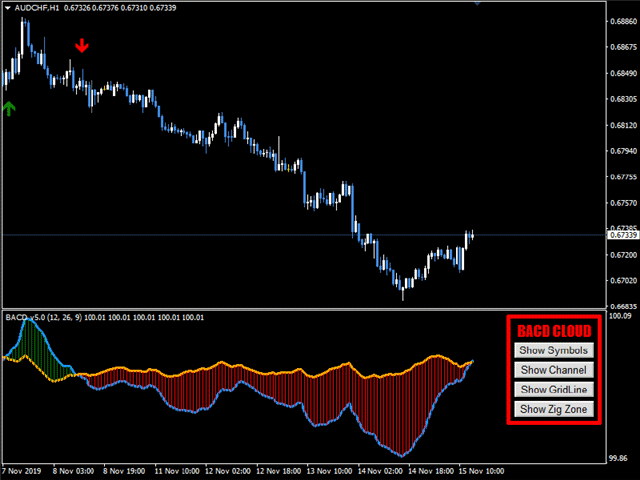
7- If (Linea BACD > Linea dell'istogramma BACD) quindi disegnare una nuvola verde, per rappresentare la tendenza.

8- Se (Linea BACD < Linea dell'istogramma BACD) allora disegna una nuvola rossa, per rappresentare la tendenza.

Link importanti:


Come usare l'indicatore?

  1. Compra e vendi in base alle frecce indicatrici.
  2. La divergenza tra le nuvole BACD e le candele di prezzo suggerisce un'inversione quasi del tutto rispetto al trend attuale.
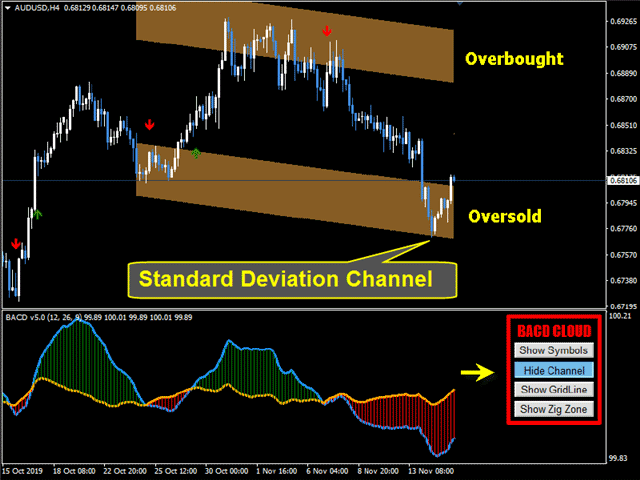
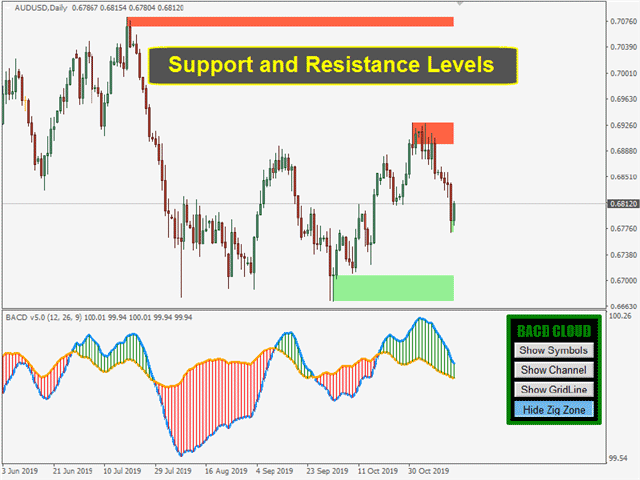
  3. Usa i canali, la griglia dei numeri arrotondati e i livelli a zig per determinare il tuo take profit e stop loss.

Caratteristiche del cloud BACD.

  • BACD Cloud non ridisegna o ricalcola i suoi risultati.
  • Parametri ben progettati per aiutare l'utente a navigare facilmente tra di loro.
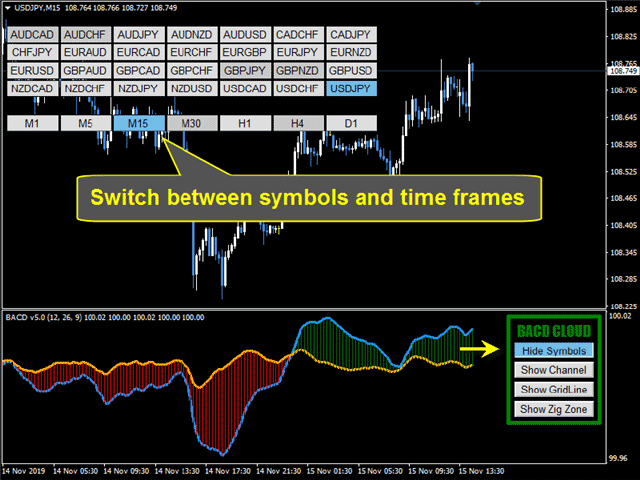
  • Puoi facilmente passare da una coppia di FX all'altra premendo il pulsante dei simboli.
  • È possibile aggiungere facilmente un canale di deviazione standard premendo il pulsante del canale.
  • Puoi aggiungere una griglia da diversi livelli di numeri tondi.
  • È possibile aggiungere livelli di supporto e resistenza (livelli di zona Zig).
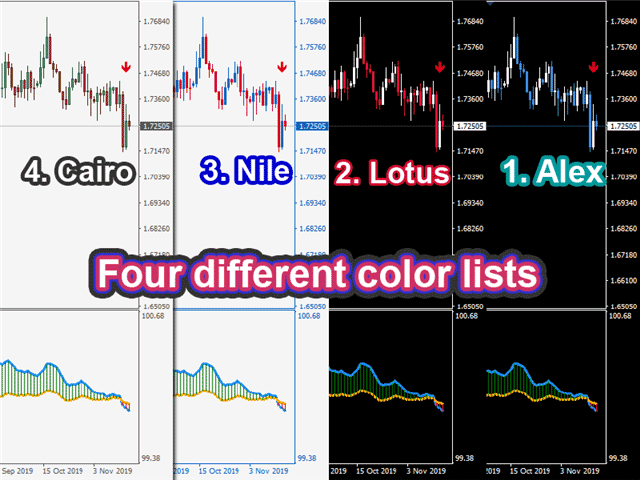
  • Puoi scegliere tra quattro diverse liste di colori.
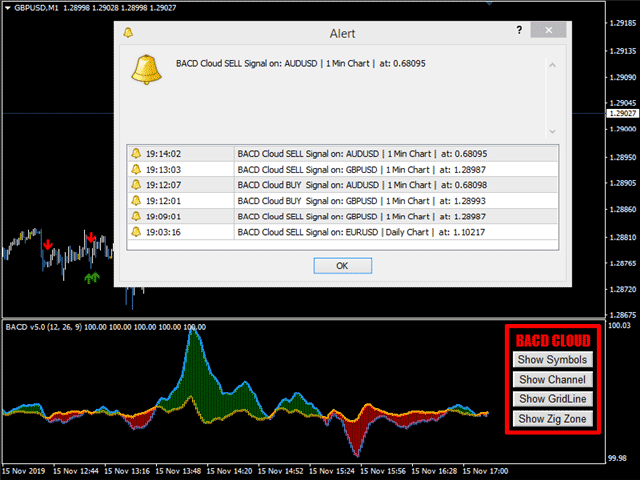
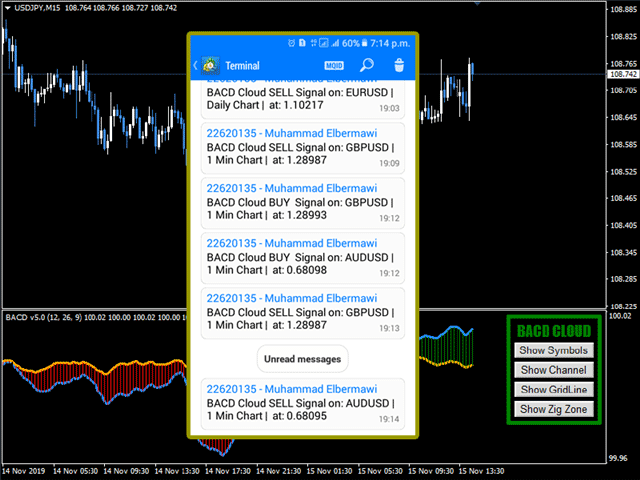
  • Suono, notifica mobile e avvisi e-mail a seconda della scelta dell'utente.
  • Il codice BACD Cloud è stato rivisto per assicurarsi che non consumi la memoria del PC dell'utente.

Parametri del cloud BACD

1) PARAMETRI INDICATORI
  • Periodo MA veloce.Il valore predefinito è 12
  • Periodo MA lento.Il valore predefinito è 26
  • Periodo della linea di segnale.Il valore predefinito è 9
2) FRECCE E AVVISI
  • Mostra frecce e linee: l'impostazione predefinita è Mostra solo frecce
  • Dimensione delle frecce.Il valore predefinito è uno
  • Avviso su nuova freccia: il valorepredefinito è vero
  • Invia e-mail sulla nuova freccia: l'impostazione predefinita è false
  • Invia notifica mobile sulla nuova freccia: l'impostazione predefinita è false
3) IMPOSTAZIONI UTILITÀ
  • Simboli Fonte da:Ottieni simboli dall'elenco dei simboli personalizzatio da Market Watch.
  • Elenco di simboli (separato da ";"):se scegli i simboli da un elenco personalizzato, separa i simboli da ";".
  • Dimensione carattere pulsante.Il valore predefinito è 10.
  • Grafico in primo piano.Mostra le candele del grafico sopra tutti gli oggetti indicatori. Il valore predefinito è falso.
  • Lunghezza canale [> 1].Numero di candele utilizzate nel calcolo del canale. Il valore predefinito è 100.
  • Appare il pannello [Maiusc + Lettera].Lettera da premere più shift per far apparire il pannello. Il valore predefinito è "A"
  • Il pannello scompare [Maiusc + Lettera].Lettera da premere più shift per far scomparire il pannello. Il valore predefinito è "D"
  • Elenco Colori Grafico:l'utente può scegliere tra quattro diversi elenchi di colori per il suo grafico oppure può scegliere (Non fare nulla) se desidera utilizzare un proprio elenco.


Se hai domande, contattami tramite un messaggio privato o scrivile nella sezione commenti.
Muhammad Al Bermaui, CMT


Recensioni 10
Paulina Andrea Madariaga Figueroa
4112
 

Very good indicator, I have spent money in another indicators and with Bermaui tools I have everything.

Deepan Kalaiselvan
231
Deepan Kalaiselvan 2021.04.13 04:35 
 

Nice trend indicator

Kahraman Senol
1603
Kahraman Senol 2021.03.02 14:17 
 

Special Thanks to Muhammad Elbermawi, i bought BACD Cloud, Bermaui Bands, Bermaui Deviation Percent and True direction oscillator. I am using them on my real trading account with MA50 and ichimoku indicators. Successful trade rate is over %70. This is enough for me. i decided to write a EA which uses all 6 indicators.I confirm the entry point buy or sell with all 6 indicators at the same time. It is five star product at the price.

https://www.mql5.com/en/signals/1195681

Prodotti consigliati
PX Trend
Vitalii Zakharuk
PX Trend is a technical indicator that mathematically transforms the price of a currency pair in the form of signaling arrows on the chart, it is used to predict the direction of the market movement. This tool is basic for the interpretation of the parameters of the graphs in technical analysis. PX Trend refers to an arrow indicator Forex - a tool that gives unambiguous signals to buy or sell currencies using arrows. An arrow directed upwards recommends buying, downward - selling. The indicat
Implement
Vitalii Zakharuk
5 (1)
Implement analyzes market dynamics for pivot points. If you want to learn how to spot the correct reversals for consistently likely profitable trading, buy this indicator. Shows favorable moments of entering the market in stripes. Ready-made trading system. The principle of operation of the indicator is to automatically determine the current state of the market when placed on a chart, analyze historical data based on historical data and display instructions for further actions on the trader's
Trend Suffer
Philip Effiong Philip
Alerts you on new trends, with ENTRY and EXIT points. INSTRUCTIONS  Select asset of choice, activate the indicator on the chart and just follow the signals from the arrows. ITS FREE, GIVE ME A GOOD RATING! Platform : Metatrader4 Asset : All Currencies, Gold, BTCUSD, NASDAQ PS : F or newbie and pro traders. Used by more 3,000 traders around the world. Send  a mail for further help and information...........
Dynamic SR Trend Channel Dynamic SR Trend Channel is a simple indicator for trend detection as well as resistance/support levels on the current timeframe. It shows you areas where to expect possible change in trend direction and trend continuation. It works with any trading system (both price action and other trading system that use indicators) and is also very good for renko charting system as well. In an uptrend, the red line (main line) serves as the support and the blue line serves as the
Arrow indicator, to determine adjustments and local trends The arrow appears on the current bar and after closing the bar will not disappear. Allows you to enter the transaction at the very beginning of the movement Thanks to the flexible settings you can use on any currency pairs, metals and cryptocurrency Can be used when working with binary options Distinctive features Does not redraw. Additional parameters for fine tuning. Works on all timeframes and symbols. Suitable for trading c
FBO Impact
Abayomi Bello
FBO Impact  is a professional yet simple to use trend following system. It detects the prevailing trend and gives entry points after pullbacks to significant price levels. To determine the trend it uses a unique filtering algorithm. Suitable for defining entry points for scalping as well as for intra-day trading. Features Works with the prevailing market trend. Suitable for all currency pairs. Ideal for all time frames but higher time frames are recommended. Does not redraw/repaint the arrows on
Trend MagicX
Hafis Mohamed Yacine
A trending market is one in which price is generally moving in one direction. ... When trading a trend-based strategy, traders usually pick the major currencies as well as any other currency utilizing the dollar because these pairs tend to trend and be more liquid than other pairs.  Best Trend Indicator That Tells You the Direction of the Trend   Trend MagicX_v1.1 displays the trend direction, duration, intensity and the resulting trend rating for all time frames in real time. You'll see at
This is a simple PriceTMA bands, non repaint! it can be used for a trend following system or sometimes reversals. as a main signal or a filter for others strategies, it depends on the trader main strategy. calculations for this indicator are a combined Algorithm between moving averages "MA" and average true range"ATR". good luck with your trading! i hope it is helpful Cheers
RoyalPrince Fibo
Richard Louis Pastor
4.93 (29)
Royal Prince Fibonacci , has the most advance Trend detection algorithm built into its Alert system combined with the RoyalPrince Non-repaint Arrows with it's own alert system you will never miss the opportunity of the trade.  works on all Charts and all Timeframe on mt4. ︎Best Timeframe M15 for scalping  H1 for Day Trading Options: • Fibonacci days High and Lows  • Fibonacci Targets • Fibonacci Alert System • Trend Percentage updated consistently • Trend Long Entry & Exit Alerts • Trend Shor
Global Trend
Vitalii Zakharuk
Global Trend Indicator, shows the signals for entry. Displays both entry points and the trend itself. Shows statistically calculated moments for entering the market with arrows. When using the indicator, the risk factor can be optimally distributed. Settings: Uses all one parameter for settings. Choosing a parameter, it is necessary to visually resemble it so that the appropriate graph has a projection of extremes. Parameters: Length - the number of bars for calculating the indicator.
RSI Divergence Scanner
Reza Aghajanpour
4.5 (14)
** All Symbols x All Timeframes scan just by pressing scanner button ** ***Contact me after purchase to send you instructions and add you in "RSI scanner group" for sharing or seeing experiences with other users. Introduction RSI divergence is a main technique used to determine trend reversing when it’s time to sell or buy because prices are likely to drop or pick in the charts. The RSI Divergence indicator can help you locate the top and bottom of the market. This indicator finds Regular div
移動平均線クロス、ボリンジャーと移動平均線のクロス、移動平均線の角度でサイン表示 MT5インジケータ こちらに サイト とがあります。 このインジケータは3つのパターンでサインを表示(切り替え可能)します。 ①   移動平均線のクロス ②   ボリンジャーバンドと短期移動平均線とのクロス ③   ボリンジャーバンドと短期移動平均線とのクロスと、中期移動平均線と長期移動平均線の角度 移動平均線のクロス 指定した短期移動平均線と長期移動平均線のゴールデンクロスでは買いサイン、デットクロスでは売りサインを表示します。 ディフォルトでは短期は5,長期は20となっています。 もちろん変更可能になります。 移動平均線の種類をEMA(指数平滑移動平均線)やSMMA(平滑化移動平均)などに変更可能で適する価格も変更可能になります。 ボリンジャーバンドと短期移動平均線のクロス ボリンジャーバンド(以降BB)と短期移動平均線のクロスでサインを表示します。 ディフォルトではBB+1σと5MAのゴールデンクロスで買いサイン、BB-1σと5MAのデットクロスで売りサインでサインを表示します。 BBの期間や
Note : The slow loading of the indicator issue has been addressed . This new version loads fast and does not slow the platform. Version 1.3 : We have updated the indicator to include an historical bar scanning option . So instead of scanning all bars in the history (which can make the indicator slow sometimes ) , you can select the maximum number of bars it can scan which can increase the performance and make the indicator faster. This indicator scans the 1-3 Trendline pattern . The indic
Market Profile
Artem Titarenko
5 (1)
The "Market Profile" indicator displays the profiles and volumes of periods – weekly, daily, session (8-hour), 4-hour, hour, summary. The VAH/VAL price area is automatically highlighted by a dotted line for each profile (except for the summary). The indicator includes chroma Delta, which colors the profile areas. The areas of prevailing Buys is colored in green, that of Sells - in red. The intensity histogram features blue/red respectively. In the filter mode, the indicator displays the volume a
ROC acceleration-deceleration is the manual system for medium-term scalping. Indicator based on custom ROC system which defines bullish/bearish market and especially  acceleration-deceleration of tendention in the market's main direction. Buy arrow is plotted during bearish market when current trend decelerates and sell  arrow is plotted during bullish market when current trend decelerates. Main Indicator's Features Signals are not repaint,non-late or disappear(exept cases when system recalculat
SFO Trend Racer
Tevin Marshall
5 (1)
SFO Trend Racer system is a trend indicator created by the CEO and Founder of " Simple Forex Options ", Tevin Marshall . It serves 6 different functions all in one. It shows the trader the entry signals as well as exit signals, whether it is a take profit or a stop loss. It also uses trend filters and signal confirmations so that the trader is able to make the most logically fit decision. Trend Racer uses various filters and specific settings from a plethora of indicators. The beauty in this ind
L'indicatore a quadrante "cool volumes" è stato creato sulla base dei volumi in teak su MT4. L'indicatore stesso tiene traccia in un determinato periodo di tempo (selezione del periodo di tempo) del numero di volumi per l'acquisto o la vendita. E quando c'è un eccesso anomalo dei volumi di venditori o acquirenti, emette un segnale per vendere o acquistare. Nella finestra in basso vengono disegnati grafici a barre colorati, in cui il colore verde mostra la predominanza degli acquirenti al mo
Dictator
Vitalii Zakharuk
The Dictator indicator is based on the process of detecting the rate of change in price growth and allows you to find points of entry and exit from the market. a fundamental technical indicator that allows you to assess the current market situation in order to enter the market of the selected currency pair in a trend and with minimal risk. It was created on the basis of the original indicators of the search for extremes, the indicator is well suited for detecting a reversal or a large sharp jer
Indicador Taurus All4
Fabio Oliveira Magalhaes
Taurus All4 Taurus All4 is a high-performance indicator, it will tell you the strength of the trend, and you will be able to observe the strength of the candle. Our indicator has more than 4 trend confirmations. It is very simple and easy to use. Confirmation Modes Candle Trend Confirmations: When the candle switches to light green the trend is high. When the candle switches to light red the trend is reverting down. When the candle changes to dark red the trend is low. Trendline Trend Conf
Based on the Dow Theory, the system automatically draws a turning point, which is the starting point for buying or selling. It also automatically tells you whether the market is in a buying or selling condition and recognizes the environment. It is also a good tool to prevent false trades and to make profitable trades. We are live-streaming the actual operation of the system. Please check for yourself if it is usable. Please check it out for yourself. https://www.youtube.com/@ganesha_forex
Diamonds Min5   - DM5-   DM5    is an indicator that suggests entering levels (sell or buy) ,it always follow the trends using parabolic sar ,  working on is so easy, you need just to attach it to the chart and all the magic will show , this indicator does n ot repeat itself or redraw signals . After months of testing, it provides a very good result       it works on all pairs with no excaption 
The Sensitive Oscillator indicator is designed to find trends. It recognizes trends with its own algorithm and changes color. Finds trends relative to the degree of sensitivity. You can use it in all time periods. You can use this indicator alone or in conjunction with other indicators suitable for your other strategies. Transaction strategies You can do breakout strategies with this indicator. Each time you change colors, you can enter the process. You can use it in the long run by putting st
Delta AG
Yurij Kozhevnikov
The difference between the arithmetic and geometric means at the specified range. Since the greater is the difference between the values, the greater the resulting figure is, actually the indicator shows volatility fluctuations. The arithmetic mean of a certain number of values ​​is the sum of the values ​​divided by their number. The geometric mean is the root of the power of the number of values ​​extracted from the product of these values. If all values ​​are equal, the arithmetic mean and th
TH3ENG CURRENCY STRENGTH SCANNER The best currency strength reader based on more than 4 excellent modes, based on Price action and Volume with various algorithms. This indicator reads all pairs data to measure and find the best results of all currencies and arrange it in a separated dashboard panel. You can find the strongest currency and the weakest currency, then trade on them pair. NOT COPLICATED NOT REPAINTING NOT LAGING Input Parameters === SYSTEM SETTING  === Calc. Mode ==> Calculatio
FREE
SuperEntryx
Abdulkarim Karazon
Super Entry è un indicatore di tipo freccia tutto in uno in cui fornisce segnali lunghi e brevi solo sui livelli tp e sl che si basano sul valore ATR e possono essere modificati e ottimizzati, questo indicatore fornisce un pannello di backtest che mostra il tasso di vincita e altre statistiche per dare una visione chiara di quanta precisione aspettarsi. questo indicatore non si ridipinge o si retrovernicia e il segnale arriva a barra aperta senza ritardo. Parametri: impostazioni: valori d
A top-quality from the famous XSuper Trend indicator. It is completely loyal to the original algorithm, and implements many useful features Which includes Trend Indicators as Filters like MACD,CCI and Alligator. The Chefs Super Trend Plus Indicator is a great way to identify the current market trend. The indicator shows a clear distinction between uptrends and downtrends. The indicators has optional filters for sound signal. Suitable for the following trending pairs: EUR/USD, GBP/USD, USD/JPY,
Alpha Trend Spotter (ATS) Volume Break Out This is an indicator that combines Volume breakout/breakdown and Moving Average Breakout/breakdown. It is able to predict further price changes. It is not repainted, not recalculated. All lines are shown at the open of a new candlestick, never winking or vanishing in the current candle. These lines are appeared at the beginning of the current candle. Suitable for M5 to D1 Timeframe. How to Use: If Green line appears, that shows the "oversold" area, so t
This indicator shows data from 9 currency pairs by your choice for all 9 Time Frames. If a digital value of the RSI is less or equal to DnLevel = 30 (or whatever number you decided to put) then a Green square will appear. This is potentially an oversold condition and maybe a good time to go Long. If a digital value of the RSI is greater or equal to UpLevel = 70 (or whatever number you decided to put) then a Red square will appear. This is potentially an overbought condition and maybe a good time
AMS Scalper
Aleksandr Makarov
AMS Scalper An excellent indicator for the entry point into the market; we use indicator signals only according to the trend. Settings: Range - 50 (range size for signal search.) Maximum candles Back - 3 (after how many candles to set a signal) P.S. For the signal to appear on the zero candle, set 0. We recommend a trend indicator -  Trend Arrow Super Still have questions? do you need help?, I'm always happy to help, write to me in private messages or In telegram
Support And Resistance Screener is in one level indicator for MetaTrader that provide multiple tools inside one indicator. The available tools are :  1. Market Structure Screener. 2. Bullish Pullback Zone. 3. Bearish Pullback Zone. 4. Daily Pivots Points 5. weekly Pivots Points 6. monthly Pivots Points 7. Strong Support and Resistance based on Harmonic Pattern and volume. 8. Bank Level Zones. Key Features All in one level indicator. All types of alerts ( Pop-up alert, puss notification aler
Gli utenti di questo prodotto hanno anche acquistato
Gann Made Easy
Oleg Rodin
4.96 (46)
Gann Made Easy è un sistema di trading Forex professionale e facile da usare che si basa sui migliori principi del trading utilizzando la teoria di mr. WD Gann. L'indicatore fornisce segnali ACQUISTA e VENDI accurati, inclusi i livelli di Stop Loss e Take Profit. Puoi fare trading anche in movimento utilizzando le notifiche PUSH. Vi prego di contattarmi dopo l'acquisto! Condividerò i miei consigli di trading con te e fantastici indicatori bonus gratuitamente! Probabilmente hai già sentito parlar
Atomic Analyst
Issam Kassas
5 (1)
Innanzitutto, vale la pena sottolineare che questo indicatore di trading non è repaint, non è ridisegno e non presenta ritardi, il che lo rende ideale sia per il trading manuale che per quello automatico. L'Analista Atomico è un indicatore di azione del prezzo PA che utilizza la forza e il momentum del prezzo per trovare un miglior vantaggio sul mercato. Dotato di filtri avanzati che aiutano a rimuovere rumori e segnali falsi, e aumentare il potenziale di trading. Utilizzando più strati di in
Gold Stuff
Vasiliy Strukov
4.89 (250)
Gold Stuff è un indicatore di tendenza progettato specificamente per l'oro e può essere utilizzato anche su qualsiasi strumento finanziario. L'indicatore non ridisegna e non è in ritardo. Periodo consigliato H1. Su di esso l'indicatore funziona in modo completamente automatico Expert Advisor EA Gold Stuff. Lo trovi nel mio profilo. Contattami subito dopo l'acquisto per avere le impostazioni e un bonus personale!   IMPOSTAZIONI Disegna freccia - acceso spento. disegnando frecce sul grafi
Scalper Vault
Oleg Rodin
5 (27)
Scalper Vault è un sistema di scalping professionale che ti fornisce tutto il necessario per scalping di successo. Questo indicatore è un sistema di trading completo che può essere utilizzato dai trader di forex e opzioni binarie. L'intervallo di tempo consigliato è M5. Il sistema fornisce segnali di freccia accurati nella direzione della tendenza. Ti fornisce anche i segnali più alti e più bassi e i livelli di mercato di Gann. Gli indicatori forniscono tutti i tipi di avvisi, comprese le notifi
ATTUALMENTE SCONTATO DEL 26% La soluzione migliore per ogni principiante o trader esperto! Questo indicatore è uno strumento di trading unico, di alta qualità e conveniente perché abbiamo incorporato una serie di caratteristiche proprietarie e una nuova formula. Con un solo grafico è possibile leggere la forza delle valute per 28 coppie Forex! Immaginate come migliorerà il vostro trading perché sarete in grado di individuare l'esatto punto di innesco di una nuova tendenza o di un'opportunit
Trend Screener
STE S.S.COMPANY
4.83 (86)
Indicatore di tendenza, soluzione unica rivoluzionaria per il trading di tendenze e il filtraggio con tutte le importanti funzionalità di tendenza integrate in un unico strumento! È un indicatore multi-timeframe e multi-valuta al 100% non ridipingibile che può essere utilizzato su tutti i simboli/strumenti: forex, materie prime, criptovalute, indici e azioni. Trend Screener è un indicatore di tendenza che segue un indicatore efficiente che fornisce segnali di tendenza a freccia con punti nel gra
Attualmente 20% di sconto! La soluzione migliore per ogni principiante o trader esperto! Questo software per cruscotti funziona su 28 coppie di valute. Si basa su 2 dei nostri indicatori principali (Advanced Currency Strength 28 e Advanced Currency Impulse). Offre un'ottima panoramica dell'intero mercato Forex. Mostra i valori di forza delle valute avanzate, la velocità di movimento delle valute e i segnali per 28 coppie Forex in tutti i (9) timeframe. Immaginate come migliorerà il vostro t
Innanzitutto, vale la pena sottolineare che questo Strumento di Trading è un Indicatore Non-Ridipingente, Non-Ridisegnante e Non-Laggante, il che lo rende ideale per il trading professionale. L'Indicatore Smart Price Action Concepts è uno strumento molto potente sia per i nuovi che per i trader esperti. Racchiude più di 20 utili indicatori in uno solo, combinando idee di trading avanzate come l'Analisi del Trader del Circolo Interno e le Strategie di Trading dei Concetti del Denaro Intelligen
TPSproTREND PrO
Roman Podpora
5 (15)
TPSpro TRENDPRO  - is a trend indicator that automatically analyzes the market and provides information about the trend and each of its changes, as well as giving signals for entering trades without redrawing! The indicator uses each candle, analyzing them separately. referring to different impulses - up or down impulse. Exact entry points into transactions for currencies, crypto, metals, stocks, indices!  -  Version MT5               DETAILED DESCRIPTION        /       TRADING SETUPS           
Scalper Inside PRO
Alexey Minkov
4.75 (55)
SALE NOW! Limited Time Offer! An exclusive indicator that utilizes an innovative algorithm to swiftly and accurately determine the market trend. The indicator automatically calculates opening, closing, and profit levels, providing detailed trading statistics. With these features, you can choose the most appropriate trading instrument for the current market conditions. Additionally, you can easily integrate your own arrow indicators into Scalper Inside Pro to quickly evaluate their statistics and
Presentazione       Quantum Trend Sniper Indicator   , l'innovativo indicatore MQL5 che sta trasformando il modo in cui identifichi e scambi le inversioni di tendenza! Sviluppato da un team di trader esperti con un'esperienza di trading di oltre 13 anni,       Indicatore Quantum Trend Sniper       è progettato per spingere il tuo viaggio di trading verso nuove vette con il suo modo innovativo di identificare le inversioni di tendenza con una precisione estremamente elevata. *** Acquista Quant
Market Reversal Alerts
LEE SAMSON
4.21 (121)
Il profitto dalla struttura del mercato cambia quando il prezzo si inverte e si ritira. L'indicatore di avviso di inversione della struttura del mercato identifica quando una tendenza o un movimento di prezzo si sta avvicinando all'esaurimento e pronto a invertire. Ti avvisa dei cambiamenti nella struttura del mercato che in genere si verificano quando stanno per verificarsi un'inversione o un forte pullback. L'indicatore identifica inizialmente i breakout e lo slancio del prezzo, ogni volta
Scopri il segreto per il trading Forex di successo con il nostro indicatore MT4 personalizzato! Ti sei mai chiesto come raggiungere il successo nel mercato Forex, guadagnando costantemente profitti minimizzando il rischio? Ecco la risposta che hai cercato! Permettici di presentare il nostro indicatore MT4 proprietario che rivoluzionerà il tuo approccio al trading. Versatilità unica Il nostro indicatore è appositamente progettato per gli utenti che preferiscono le formazioni di candele Ren
Quantum Breakout Indicator PRO
Bogdan Ion Puscasu
4.96 (26)
Presentazione       Quantum Breakout PRO   , l'innovativo indicatore MQL5 che sta trasformando il modo in cui scambi le zone di breakout! Sviluppato da un team di trader esperti con un'esperienza di trading di oltre 13 anni,   Quantum Breakout PRO   è progettato per spingere il tuo viaggio di trading a nuovi livelli con la sua strategia innovativa e dinamica della zona di breakout. Quantum Breakout Indicator ti fornirà frecce di segnalazione sulle zone di breakout con 5 zone target di prof
Advanced Supply Demand
Bernhard Schweigert
4.92 (310)
CURRENTLY 26% OFF !! Best Solution for any Newbie or Expert Trader! This indicator is a unique, high quality and affordable trading tool because we have incorporated a number of proprietary features and a new formula. With this update, you will be able to show double timeframe zones. You will not only be able to show a higher TF but to show both, the chart TF, PLUS the higher TF: SHOWING NESTED ZONES. All Supply Demand traders will love it. :) Important Information Revealed Maximize the potenti
AVVISO DI ACQUISTO E VENDITA MULTIVALUTA e MULTITIMEFRAME. AUTO TAILING STOP E RISCHIO PREMIO TAKEPROFIT! L'INDICATORE SCANSIONA E ANALIZZA IL MERCATO COSÌ NON HAI NULLA DA FARE! SCAMBIA TUTTE LE TUE VALUTE SU 1 TABELLA!   Dopo l'acquisto lascia un commento contattami e ti invierò l'assistente commerciale EA. L'indicatore utilizza diversi oscillatori e filtri allegati per trovare i migliori punti di ingresso CONFERMATI, quindi non devi preoccuparti di questo! Ti avviserà e disegnerà un pu
TPSpro RFI Levels
Roman Podpora
5 (13)
A key element in trading is zones or levels from which decisions to buy or sell a trading instrument are made. Despite attempts by major players to conceal their presence in the market, they inevitably leave traces. Our task was to learn how to identify these traces and interpret them correctly. Reversal First Impulse levels (RFI)   -  Version MT5                INSTRUCTIONS                 RUS                 ENG                                       R ecommended to use with an indicator   -  
Presentazione dell'indicatore Miraculous Forex: Libera il potere del trading preciso Sei stanco di cercare il miglior indicatore Forex che fornisca risultati eccezionali su tutti i timeframe? Non cercare oltre! L'indicatore Miraculous Forex è qui per rivoluzionare la tua esperienza di trading e portare i tuoi profitti a nuove vette. Basato su tecnologia all'avanguardia e anni di sviluppo accurato, l'indicatore Miraculous Forex si distingue come l'apice di potenza e precisione nel mercato delle v
Entry Points Pro
Yury Orlov
4.7 (225)
Indicatore top per MT5 che fornisce segnali accurati per entrare in un trade senza riverniciare! Può essere applicato a qualsiasi attività finanziaria: forex, criptovalute, metalli, azioni, indici.  La versione MT5 è qui Fornirà segnali di trading piuttosto precisi e ti dirà quando è meglio aprire un trade e chiuderlo. Guarda il video (6:22) con un esempio di elaborazione di un solo segnale che ha ripagato l'indicatore! La maggior parte dei trader migliora i propri risultati di trading
Break and Retest
Mohamed Hassan
5 (2)
Break & Retest is unstoppable when combined with our other divergence indicator. After purchase, send us a message and you could get this  2nd indicator  for  FREE  as a  BONUS! ‍You can visually backtest Break & Retest to see how it behaved in the past!    Manual guide:   Click here $59  for the first 25 copies ( 4  left)! Next price is $120 .  After many months of hard work and dedication, we are extremely proud to present you our  Break and Retest price action indicator crea
TrendMaestro
Stefano Frisetti
5 (2)
nota: questo indicatore e' per METATRADER4, se vuoi la versione per  METATRADER5 questo e' il link:  https://www.mql5.com/it/market/product/108123 TRENDMAESTRO riconosce un nuovo TREND sul nascere, non sbaglia mai. La sicurezza di identificare un nuovo TREND non ha prezzo. DESCRIZIONE TRENDMAESTRO identifica un nuovo TREND sul nascere, questo indicatore prende in esame la volatilita' i volumi ed il momentum per identificare il momento in cui c'e' un'esplosione di uno  opiu' di questi dati
FX Power MT4 NG
Daniel Stein
5 (8)
Ricevi il tuo aggiornamento quotidiano sul mercato con dettagli e schermate tramite il nostro Morning Briefing qui su mql5 e su Telegram ! FX Power MT4 NG è la nuova generazione del nostro popolare misuratore di forza delle valute, FX Power. Cosa offre questo misuratore di forza di nuova generazione? Tutto ciò che avete amato dell'FX Power originale IN PIÙ Analisi della forza di ORO/XAU Risultati di calcolo ancora più precisi Periodi di analisi configurabili individualmente Limite di calcolo pe
Trend Forecasting
Mohamed Hassan
5 (15)
This indicator is unstoppable when combined with our other indicator called Katana. After purchase, send us a message and you could get Katana for FREE as a BONUS After purchase, send us a private message for your instructions.  MT5 version: click here 3 copies left available at $45. Next price is $99. Don't miss this great deal!  The Trend Forecasting indicator is a very unique & easy tool that is able to make prediction about future price movement based on the signals generated
Price Action Entry Alerts
Stephen Sanjeeve Sahayam
5 (3)
Questo indicatore controlla ogni barra per la pressione di acquisto o vendita e identifica 4 tipi di modelli di candele con il volume più alto. Queste candele vengono quindi filtrate utilizzando diversi filtri lineari per mostrare segnali di acquisto o vendita. I segnali funzionano meglio, in combinazione con una direzione temporale più elevata e quando scambiati durante le ore ad alto volume. Tutti i filtri sono personalizzabili e funzionano in modo indipendente. Può visualizzare i segnali di
Advanced Currency IMPULSE with ALERT
Bernhard Schweigert
4.91 (494)
ATTUALMENTE SCONTATO DEL 31%! La soluzione migliore per ogni principiante o trader esperto! Questo indicatore è uno strumento di trading unico, di alta qualità e conveniente perché abbiamo incorporato una serie di caratteristiche proprietarie e una formula segreta. Con un solo grafico fornisce avvisi per tutte le 28 coppie di valute. Immaginate come migliorerà il vostro trading perché sarete in grado di individuare l'esatto punto di innesco di una nuova tendenza o opportunità di scalping!
TrendDecoder Premium
Christophe, Pa Trouillas
5 (3)
Identificare i range e le prossime mosse probabili   |  Ottenere i primi segnali e la forza delle tendenze   |  Ottenere uscite chiare prima dell'inversione   |  Individuare i livelli di Fibo che il prezzo testerà Indicatore non tracciante e non ritardato - ideale per il trading manuale e automatizzato - adatto a tutti gli asset e a tutte le unità temporali Offerta limitata nel tempo >>   50% OFF Dopo l'acquisto, contattatemi su questo canale  per le impostazioni personalizzate. Versione   MT5 :
Currency Strength Wizard è un indicatore molto potente che ti fornisce una soluzione all-in-one per un trading di successo. L'indicatore calcola la potenza di questa o quella coppia forex utilizzando i dati di tutte le valute su più intervalli di tempo. Questi dati sono rappresentati in una forma di indice di valuta facile da usare e linee elettriche di valuta che puoi utilizzare per vedere il potere di questa o quella valuta. Tutto ciò di cui hai bisogno è collegare l'indicatore al grafico che
L'indicatore di inversione ADR ti mostra a colpo d'occhio dove il prezzo è attualmente scambiato in relazione al suo normale intervallo medio giornaliero. Riceverai avvisi istantanei tramite pop-up, e-mail o push quando il prezzo supera la sua gamma media e livelli superiori a tua scelta in modo da poter saltare rapidamente a pullback e inversioni. L'indicatore disegna linee orizzontali sul grafico agli estremi dell'intervallo medio giornaliero e anche estensioni al di sopra di quei livelli a c
FX Volume
Daniel Stein
4.6 (35)
Ricevi il tuo aggiornamento quotidiano sul mercato con dettagli e schermate tramite il nostro Morning Briefing qui su mql5 e su Telegram ! FX Volume è il PRIMO e UNICO indicatore di volume che fornisce una visione REALE del sentiment del mercato dal punto di vista del broker. Fornisce informazioni straordinarie su come gli operatori di mercato istituzionali, come i broker, sono posizionati sul mercato Forex, molto più velocemente dei rapporti COT. Vedere queste informazioni direttamente sul vo
Innanzitutto, è importante sottolineare che questo sistema di trading è un indicatore non repainting, non redrawing e non lagging, il che lo rende ideale per il trading professionale. Il "Sistema di Trading di Supporto e Resistenza Intelligente" è un indicatore avanzato progettato per trader nuovi ed esperti. Permette ai trader di ottenere precisione e fiducia sul mercato forex. Questo sistema completo combina più di 7 strategie, 10 indicatori e varie approcci di trading, tra cui strategie di
Altri dall’autore
True Direction Oscillator
Muhammad Elbermawi
4.89 (493)
Oppure (TDO) che è un indice che misura il tasso di variazione del prezzo utilizzando il principio del " Pure Momentum ". Quando il prezzo di un titolo avanza da 10 a 15, il tasso di variazione del prezzo è del 150%, ma quando scende da 15 a 10, il tasso di variazione del prezzo è solo del 33,3%. Ecco perché gli indicatori di analisi tecnica come "Price Rate of Change" (ROC) o "Momentum" forniscono letture più elevate per i movimenti di prezzo ascendente rispetto a quelli dati a quelli discende
Moving Average Cloud
Muhammad Elbermawi
4.93 (14)
O "MAC". Questo è un indicatore progettato per aiutarti a catturare e scambiare la tendenza. L'idea alla base di questo indicatore può essere spiegata nei passaggi successivi: Disegna una busta media in rapido movimento. Disegna una busta media lenta. Il MAC Upper Band è il valore più alto tra il massimo di entrambi gli inviluppi. La banda inferiore del MAC è il valore più basso tra i minimi di entrambi gli inviluppi. MAC Histogram Cloud riempie la distanza tra due bande per mostrare il cambi
Bermaui Bands
Muhammad Elbermawi
4.94 (89)
Bermaui Bands (BB) è uno strumento di analisi tecnica che aiuta a filtrare tra i movimenti di prezzo di range e trend. L'idea alla base di questo indicatore può essere spiegata nei passaggi successivi: Calcola la deviazione standard come un oscillatore che si muove tra 0 e 100. Lo chiamerò Bermaui Deviation percent (BD %). Se "BD%" è vicino allo zero, la volatilità è al suo estremo. Inoltre, se "BD%" è vicino a 100, la volatilità è molto bassa. Alta volatilità significa una grande probabilità pe
MASR Bands
Muhammad Elbermawi
5 (10)
O bande M Oving A verage S upport R esistance. L'indicatore MASR Bands è una media mobile circondata da due bande che lavorano insieme come livelli di supporto e resistenza. Statisticamente, le bande MASR contengono candele di prezzo il 93% delle volte. Ecco come viene calcolato in passaggi: 1. Il primo passaggio consiste nel calcolare il massimo massimo (HHV) e il minimo minimo (LLV) per un periodo di tempo X. 2. Il secondo passaggio consiste nel dividere HHV per LLV per ottenere quanto
Bermaui Manual EA
Muhammad Elbermawi
5 (10)
Questo è un consulente esperto semiautomatico che scambia il sistema di rete. L'idea è quella di prendere gradualmente posizioni diverse nel mercato, quindi calcolare il livello di pareggio per loro. Quando i prezzi superano questo punto di pareggio di una distanza predeterminata, tutti gli ordini aperti vengono chiusi. Informazioni importanti Ecco la guida per l'utente:   https://www.mql5.com/en/blogs/post/730567 Puoi provare questo EA con uno qualsiasi dei miei altri prodotti, qui: https:/
Bermaui Deviation Percent
Muhammad Elbermawi
4.94 (129)
Oppure ( BD% ) che è un indice di volatilità che misura la volatilità in percentuale anziché in punti. L'idea di BD% è quella di creare un indice in base alla Classic Standard Deviation (CSD) che si sposta tra 0 e 100 percento. È possibile utilizzare BD% per confrontare la volatilità per lo stesso titolo in diversi periodi di tempo o periodi di tempo diversi. Inoltre, puoi utilizzare BD% per confrontare la volatilità tra diversi titoli in diversi mercati in termini di percentuale anziché di p
Classic Keltner Channel
Muhammad Elbermawi
4.9 (40)
o CKC. Questo indicatore funziona in base alla classica regola della media mobile a dieci giorni descritta da Chester W. Keltner (1909–1998). Tutti i parametri sono impostati di default sulla versione classica del sistema Keltner, mentre l'utente può modificarli se lo desidera. Informazioni importanti Leggi il manuale CKC: https://www.mql5.com/en/blogs/post/736577 Esempio di consulente esperto CKC: https://www.mql5.com/en/blogs/post/734150 Informazioni sulla formula del canale Keltner 1. C
Bermaui Pin Bars
Muhammad Elbermawi
5 (22)
Bermaui Pin Bars Oppure (BPB) è un indicatore che trova il modello di azione dei prezzi delle barre dei pin sul grafico. Pin Bars è una scorciatoia per "Pinocchio Bars" che è un classico modello a barre alternativo ai candelabri giapponesi con alte ombre superiori o inferiori e corpi molto piccoli come Hammer, Inverted-Hammer, Hanging Man, Shooting Star, Dragon Fly Doji o Grave Stone Doji . L'indicatore Bermaui Pin Bars trova questo modello in base a una formula che può essere spiegata nei pa
Or DBD%. The indicator consists of colored tape that shows trading signals depending on two Bermaui Deviation Oscillator (BD%) and two moving averages. Bermaui Deviation Percent is a volatility index that measures volatility in percent rather than points. The idea of BD% is to make an index depending on Classic Standard Deviation (CSD) that moves between 0 and 100 percent. Important Information DBD% expert advisor example:  https://www.mql5.com/en/blogs/post/731145 If you want to know mor
Bermaui Channel
Muhammad Elbermawi
5 (27)
This is a price channel that shows five important price levels on the chart. Those levels are: 1. The Highest High (HH) of the previous x bars. 2. The Highest Low (HL) of the previous x bars. 3. The Center Line. 4. The Lowest High (LH) of the previous x bars. 5. The Lowest Low (LL) of the previous x bars. How does Bermaui Channels Captures Overbought  area Think of the distance between HH and HL levels as an overbought area. When the price candles or bars crosses the HL to the upside this
Bermaui RSI Candles
Muhammad Elbermawi
5 (7)
L'idea di questo indicatore è disegnare l'RSI sotto forma di candele che possono essere confrontate con i grafici dei prezzi per generare segnali di acquisto e vendita. L'indicatore non è una mia invenzione. L'ho fondato su internet diversi anni fa. Ho aggiornato il codice, aggiunto funzioni di avviso, aggiunto il gruppo di strumenti Bermaui Utilities. L'indicatore calcola l'RSI di tutti i prezzi utilizzati per disegnare le candele (RSI di apertura, massimo, minimo e chiusura). Usa il più alto
Horus EA
Muhammad Elbermawi
3.67 (3)
Horus EA per MT4 Migliaia di anni fa, gli antichi egizi inventarono un sistema di conteggio che usavano per misurare le loro terre e pesare le loro merci. Questo sistema era noto come " Occhio di Horus ". L'occhio di Horus era associato al mito del dio Osiride e divenne uno dei simboli sacri dei faraoni. Ho usato le equazioni matematiche nell'Occhio di Horus con la sequenza di Fibonacci per costruire un sistema di gestione del denaro a progressione negativa che è dell'89% più sicuro del famos
Filtro:
Paulina Andrea Madariaga Figueroa
4112
 

Very good indicator, I have spent money in another indicators and with Bermaui tools I have everything.

Deepan Kalaiselvan
231
Deepan Kalaiselvan 2021.04.13 04:35 
 

Nice trend indicator

Kahraman Senol
1603
Kahraman Senol 2021.03.02 14:17 
 

Special Thanks to Muhammad Elbermawi, i bought BACD Cloud, Bermaui Bands, Bermaui Deviation Percent and True direction oscillator. I am using them on my real trading account with MA50 and ichimoku indicators. Successful trade rate is over %70. This is enough for me. i decided to write a EA which uses all 6 indicators.I confirm the entry point buy or sell with all 6 indicators at the same time. It is five star product at the price.

https://www.mql5.com/en/signals/1195681

Tim Rijnbeek
1342
Tim Rijnbeek 2020.07.25 20:08 
 

Useless too many false signals , two stars for the effort

Ferrari888
593
Ferrari888 2020.07.12 21:07 
 

Хороший индикатор .Мухаммед очень любезен подробно все объяснит и всегда отвечает на вопросы. Честный и порядочный человек.Спасибо Мухаммед.

[Eliminato] 2020.06.04 01:23 
 

L'utente non ha lasciato alcun commento sulla valutazione.

MAKARIOS YACOUBIAN
2891
MAKARIOS YACOUBIAN 2020.04.17 01:25 
 

its my Second Indicators From Mr.Muhammad , again thanks for your excellent service, professional job . update 09.06.2020 , so far i am using this indicator in daily basis . good

Frank Paetsch
6907
Frank Paetsch 2020.03.16 01:03 
 

verry good. thank you

Nieco Pama
248
Nieco Pama 2020.01.20 14:17 
 

L'utente non ha lasciato alcun commento sulla valutazione.

IK°L
800
IK°L 2019.12.31 18:13 
 

L'utente non ha lasciato alcun commento sulla valutazione.

Rispondi alla recensione
Versione 2.1 2020.03.30
1. Fixed a small bug in the de-initialization function, that used to cause the "Symbols Switch" tool not to work properly.
2. Organized the indicator parameters in a better style.
.
Note:
I didn't make any changes on TDO basic formula. It is still the same.
I didn't make serious changes in indicator parameters or buffers.
Versione 2.0 2020.02.24
Fixed small bugs in the alert messages.
Fixed a small bug in the de-initialization function, that used to cause the symbols switch tool not to work properly.
.
Note:
I didn't make any changes on TDO basic formula. It is still the same.
I didn't make any changes in indicator parameters or buffers.