• Übersicht
  • Bewertungen
  • Diskussion (3)
  • Neue Funktionen

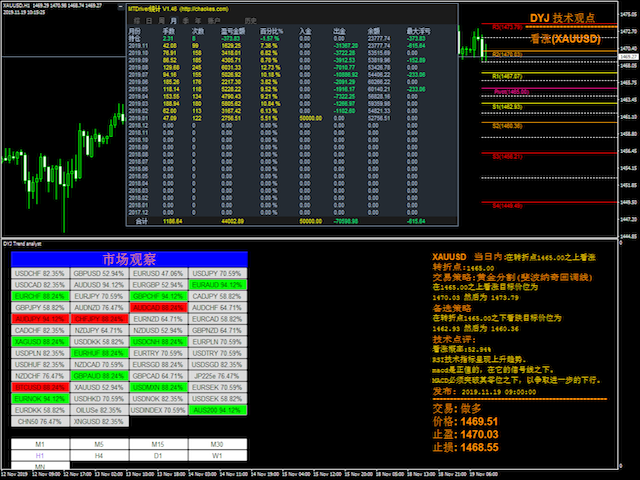
DYJ Trend analyst MT5

Our goal is to provide accessible and quality service, enable market participants, traders and analysts alike, with much-needed tools for informed, timely trading decisions.

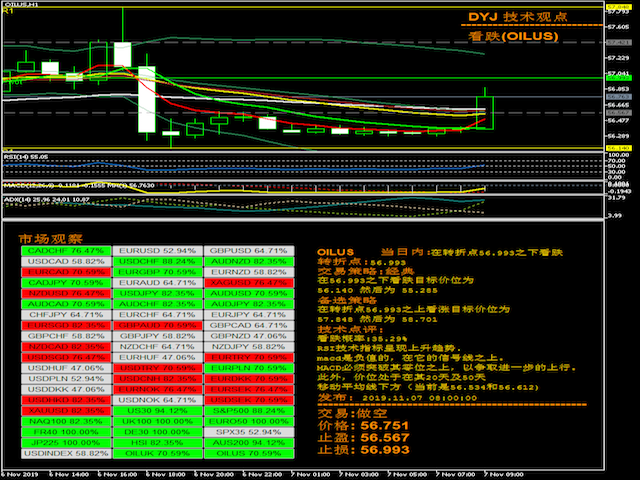
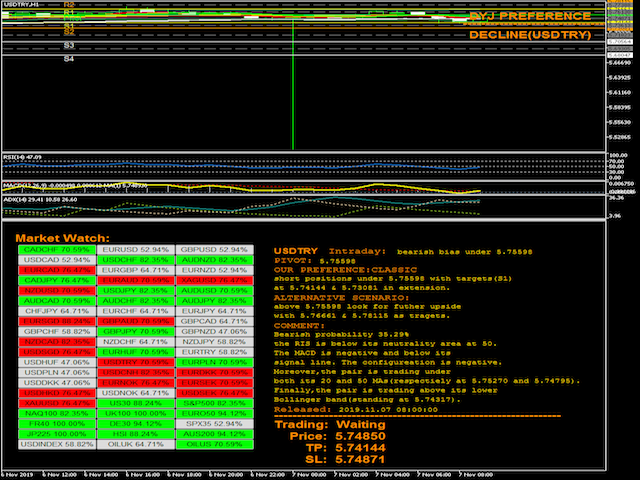
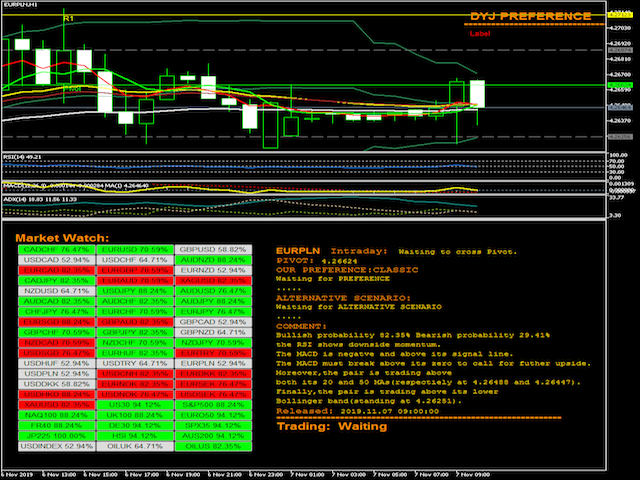
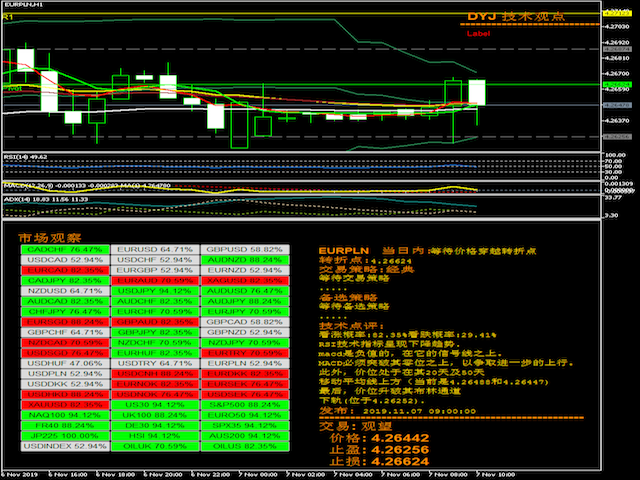
The most optimized, highly robust and easy to use DYJ Trend analyst indicator.

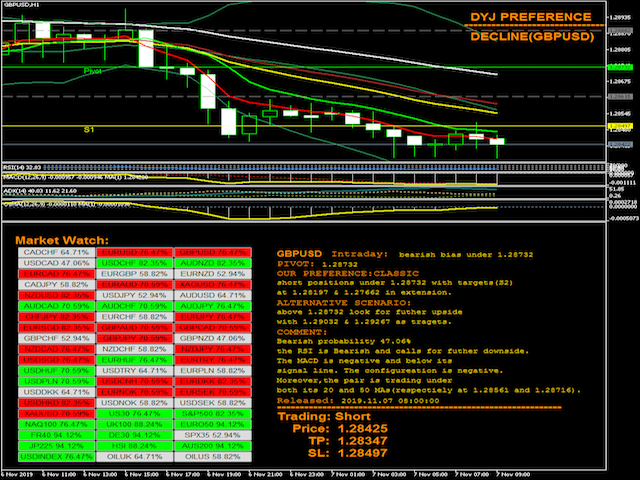
DYJ Trend analyst attempts to gauge bullish and bearish forces in the market by using two separate measures, one for each type of directional pressure.

The  indicator's BearsIndex  attempts to measure the market's appetite for lower prices.

The indicator's BullsIndex attempts to measure the market's appetite for higher prices.

Pivot Point Extra Indicator for DYJ Trend analyst.

Our Pivot Point indicator is based on advanced algorithm of calculating the pivot point and support and resistance levels .

Incredibly accurate prediction of future important price levels and possible market reversals.

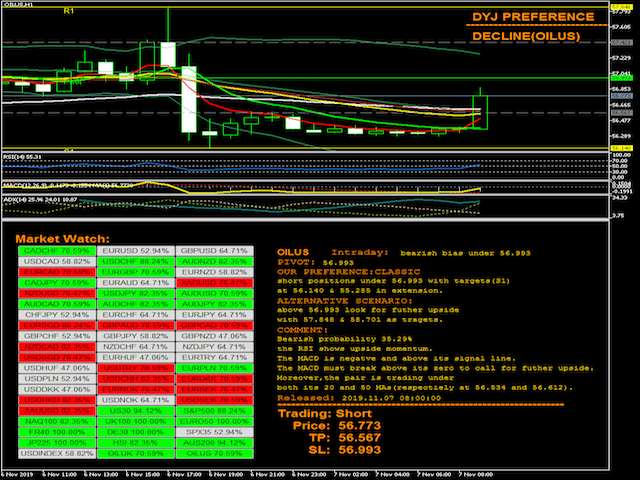
Useful for all markets (forex, commodities, stocks, indices and others) and timeframes .

Features

  • Monitors all pairs at the same time.
  • The indicator monitors the MaekingWatch pairs by default.
  • It runs only from a graph (M1 to MN).

Parameter:

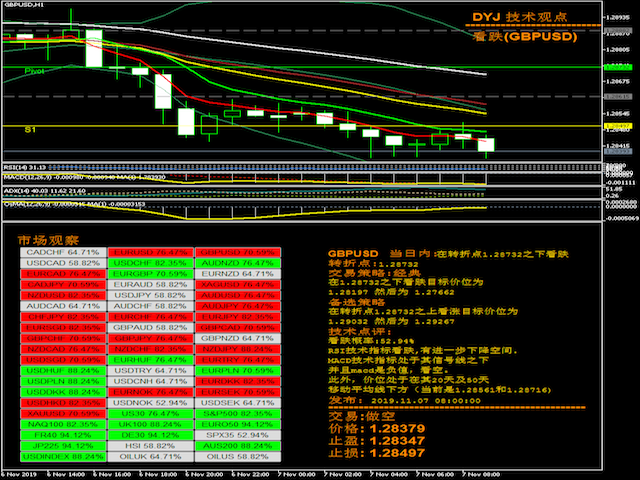
  • InpLanguage = English   --  English or Chinese
  • InpEntryPercent = Min_70  -- Trend percentage requirements 70% or more.
  • Wait_Mins_For_Next_Signal     = 30  -- The next signal occurs 30 minutes later
  • InpMaxCol = 5  --  Buttons in a horizontal column

Notes:

  • Please download the template attachment(DYJ Trend analyst for MT5.tpl) in the comments.


Empfohlene Produkte
Was: $249  Now: $99   Market Profile defines a number of day types that can help the trader to determine market behaviour. A key feature is the Value Area, representing the range of price action where 70% of trading took place. Understanding the Value Area can give traders valuable insight into market direction and establish the higher odds trade. It is an excellent addition to any system you may be using. Inspired by Jim Dalton’s book “Mind Over Markets”, this indicator is designed to suit the
AW Candle Patterns
AW Trading Software Limited
Der AW-Kerzenmuster-Indikator ist eine Kombination aus einem fortschrittlichen Trendindikator und einem leistungsstarken Kerzenmuster-Scanner. Es ist ein nützliches Werkzeug, um die dreißig zuverlässigsten Candlestick-Muster zu erkennen und hervorzuheben. Darüber hinaus ist es ein aktueller Trendanalysator, der auf farbigen Balken mit einem basiert       Plug-in-Multi-Timeframe-Trendpanel, das in der Größe verändert und positioniert werden kann. Eine einzigartige Fähigkeit, die Anzeige von Muste
Pullback Hunter
Anton Polkovnikov
PULLBACK HUNTER What is every trader's cherished dream? To see without delay the places where the reversal will happen. This, of course, is from the category of magic, though... nothing is impossible. But for now I've prepared for you an indicator that marks in real time the end of corrections to the current movement or in short - catches pullbacks.What is the main point? Many people practice rebounds when the price moves in the direction of the open position. And they do them on the formation o
Premium-Level ist ein einzigartiger Indikator mit mehr als 80% Genauigkeit der richtigen Vorhersagen! Dieser Indikator wurde von den besten Trading-Spezialisten seit mehr als zwei Monaten getestet! Den Indikator des Autors finden Sie nirgendwo anders! Anhand der Screenshots können Sie sich von der Genauigkeit dieses Tools überzeugen! 1 ist ideal für den Handel mit binären Optionen mit einer Ablaufzeit von 1 Kerze. 2 funktioniert bei allen Währungspaaren, Aktien, Rohstoffen, Kryptowähr
Der Indikator erstellt aktuelle Notierungen, die mit historischen verglichen werden können, und auf dieser Grundlage eine Preisbewegungsprognose erstellen. Der Indikator verfügt über ein Textfeld zur schnellen Navigation zum gewünschten Datum. Optionen: Symbol - Auswahl des Symbols, das der Indikator anzeigen soll; SymbolPeriod - Auswahl des Zeitraums, aus dem der Indikator Daten aufnimmt; IndicatorColor - Indikatorfarbe; HorisontalShift - Verschiebung der vom Indikator gezeichnet
The indicator determines the state of the market: trend or flat. The state of the market is determined by taking into account volatility. The flat (trading corridor)is displayed in yellow. The green color shows the upward trend. The red color shows the downward trend. The height of the label corresponds to the volatility in the market. The indicator does not redraw . Settings History_Size   - the amount of history for calculation. Period_Candles  - the number of candles to calculate the
Elevate Your Trading Experience with Wamek Trend Consult!   Unlock the power of precise market entry with our advanced trading tool designed to identify early and continuation trends. Wamek Trend Consult empowers traders to enter the market at the perfect moment, utilizing potent filters that reduce fake signals, enhancing trade accuracy, and ultimately increasing profitability.   Key Features: 1. Accurate Trend Identification: The Trend Consult indicator employs advanced algorithms and unparall
VPU Levels
Andriy Sydoruk
Looking for reliable levels on a price chart? Already tired of searching for similar indicators? Are the levels NOT working out as they should? Then this is the indicator for you. VPU Levels is a more advanced version of the Volume Prices Universal indicator. In this indicator, in addition to the histogram of horizontal volumes, the indicator itself determines the levels from which the user can work. The PeakLevel and Diffraction fields help to adjust the depth of reaction to the histogram an
BoxChart MT5
Evgeny Shevtsov
5 (7)
The market is unfair if only because 10% of participants manage 90% of funds. An ordinary trader has slim changes to stand against these "vultures". This problem can be solved. You just need to be among these 10%, learn to predict their intentions and move with them. Volume is the only preemptive factor that faultlessly works on any timeframe and symbol. First, the volume appears and is accumulated, and only then the price moves. The price moves from one volume to another. Areas of volume accumu
Reverse Rayer MT5
Oleksandr Novosiadlyi
Description Reverse Rayer  is an indicator that draws rays on inclined trend levels. Recommendations You can use this indicator to determine the trend and, accordingly, to determine the direction of opening a position or closing an opposite position. Parameters ===== _INDICATOR_SETTINGS_ =====  - indicator settings Maximum History Bars  - maximum number of history bars for calculating the indicator. Average True Range Period  - ATR indicator period (used to calculate the difference be
Arrow technical indicator without redrawing Vendetta in the Forex market is able to give tips with the least errors. The indicator does not redraw its signals when the price changes. It combines several filters, displaying market entry arrows on the chart. Every rise and fall is reflected in your emotional state: hope is replaced by fear, and when it passes, hope appears again. The market uses your fear to prevent you from taking advantage of a strong position. At such moments you are most vu
Automated Trendlines MT5
Georgios Kalomoiropoulos
Trendlinien sind das wichtigste Werkzeug der technischen Analyse im Devisenhandel. Leider zeichnen die meisten Händler sie nicht richtig. Der automatische Trendlinien-Indikator ist ein professionelles Tool für ernsthafte Trader, das Ihnen hilft, die Trendbewegung der Märkte zu visualisieren. Es gibt zwei Arten von Trendlinien Bullische Trendlinien und Bärische Trendlinien. Im Aufwärtstrend wird die Forex-Trendlinie durch die niedrigsten Swing-Punkte der Preisbewegung gezogen. Wenn man m
This is the spike indicator , determining the highest high and lowest lows of price in the given period ,  it is also a zigzag indicator , to it may recalculate the values  or repaint if a new higher high or lower low forms in that given period,so beware How ever the indicator can be very powerful when used with other technical indicators for entry confirmation  Be sure to check out some of my other premium products   
How to use Pair Trading Station Pair Trading Station is recommended for H1 time frame and you can use it for any currency pairs. To generate buy and sell signal, follow few steps below to apply Pair Trading Station to your MetaTrader terminal. When you load Pair Trading Station on your chart, Pair Trading station will assess available historical data in your MetaTrader platforms for each currency pair. On your chart, the amount of historical data available will be displayed for each currency pai
Noize Absorption Index - is the manual trading system that measures the difference of pressure between bears forces and bulls forces. Green line - is a noize free index that showing curent situation. Zero value of index shows totally choppy/flat market.Values above zero level shows how powerfull bullish wave is and values below zero measures bearish forces.Up arrow appears on bearish market when it's ready to reverse, dn arrow appears on weak bullish market, as a result of reverse expectation.
Gann 9 plus
Yin Zhong Peng
Gann 9+ Indicator Introduction The "Gann Matrix Chart" is the most simple and clear technical analysis in Gann theory, which is the calculation tool that Gann has always been committed to using. It is the essence of Gann's whole life. The Gann 9+ indicator uses the matrix chart to find the future high or low points of stocks or futures. Indicator Input: The base and step size can be set as 1 by default; When the multiple is -1, the multiple will be automatically obtained, or it can be filled in
The Trend Complete indicator is a signal indicator and has interesting properties. It should be taken into account that this indicator reflects extremes and should be used as an additional one, and another instrument should be used for the entry point. Searches for and displays pivot points on the price chart. Trend indicators are one of the main tools for analyzing trends in the Forex market. The indicator is able to transmit all types of signals to the user: messages, E-mail and Push! The g
Introduction Excessive Momentum Indicator is the momentum indicator to measure the excessive momentum directly from raw price series. Hence, this is an extended price action and pattern trading. Excessive Momentum Indicator was originally developed by Young Ho Seo. This indicator demonstrates the concept of Equilibrium Fractal Wave and Practical Application at the same time. Excessive Momentum detects the market anomaly. Excessive momentum will give us a lot of clue about potential reversal and
"Pattern 123" is an indicator-a trading system built on a popular pattern, pattern 123. This is the moment when we expect a reversal on the older trend and enter the continuation of the small trend, its 3rd impulse. The indicator displays signals and markings on an open chart. You can enable/disable graphical constructions in the settings. The indicator has a built-in notification system   (email, mobile terminal, standard terminal alert). "Pattern 123" has a table that displays signals fr
Trendseite - ein technischer Indikator zur Bestimmung des Trends. Es ist eine Reihe von mehreren vollwertigen Handelsstrategien. Der Indikator verwendet ein fortschrittliches Trendfiltersystem, hat ein statistisches Panel, berechnet Einstiegs- und Ausstiegsniveaus und berechnet das dynamische Trailing-Stop-Niveau. Geeignet für jede Art von Symbolen, zeichnet seine Signale und Ergebnisse niemals neu. Ein umfassendes Tool für den professionellen Trendhandel. Das Set des Trend Side-Indikators um
Price Control
Vitalii Zakharuk
The Price Control indicator determines a short-term and long-term trend. The analysis is based on the selected timeframe. The indicator shows the points of opening deals for sale or purchase, and also indicates the direction of the trend at: Short term Long term The indicator not only signals an immediate purchase or sale. It indicates a short-term and long-term trend. The indicator allows you to examine in more detail the real and historical market trends!
Einzigartiger Indikator, der einen professionellen und quantitativen Ansatz für Mean-Reversion-Trading umsetzt. Es nutzt die Tatsache, dass der Preis auf vorhersehbare und messbare Weise umlenkt und zum Mittelwert zurückkehrt, was klare Ein- und Ausstiegsregeln ermöglicht, die nicht-quantitative Handelsstrategien bei weitem übertreffen. [ Installation Guide | Update Guide | Troubleshooting | FAQ | All Products ] Klare Handelssignale Erstaunlich einfach zu handeln Anpassbare Farben und Größen I
Trading patterns on Forex is considered to be the highest level of trading, since it usually requires years of mastering various patterns (shapes and candle combinations) and the ways they affect the price. Patterns are different combinations of Japanese candles on a chart, shapes of classical technical analysis, as well as any regularities of the market behavior repeating many times under the same conditions. After the patterns appear on a chart, the price starts behaving in a certain way allow
The Market Reversal Catcher indicator looks for market reversal points or major pullback. To do this, it analyzes previous price movements and using a flexible algorithm for estimating the probability of a reversal, also gives recommendations on entry points and sets recommended profit targets for positions opened on a signal. Market Reversal Cather User Guide -   Read Version for MetaTrader 4 - here The indicator is very easy to use and does not require a lot of information to understand how it
Looking for reliable levels on a price chart? Already tired of searching for similar indicators? Are the levels not working out as they should? Then this is the indicator for you. Volume Prices Universal is a reliable indicator of horizontal volumes. What does it show? First of all, the main idea of ​​the indicator is to display at which price mark the price has been for the longest time. Thus, the display of price volumes on the price chart is formed. With the help of which you can very simp
Das 123-Muster ist eines der beliebtesten, leistungsstärksten und flexibelsten Diagrammmuster. Das Muster besteht aus drei Preispunkten: einem Boden, einem Gipfel oder Tal und einem Fibonacci-Retracement zwischen 38,2% und 71,8%. Ein Muster gilt als gültig, wenn der Preis jenseits des letzten Gipfels oder Tals abbricht, in dem der Indikator einen Pfeil zeichnet, einen Alarm auslöst und der Handel platziert werden kann. [ Installationsanleitung | Update-Anleitung | Fehlerbehebung | FAQ | Alle Pr
Gioteen Volatility Index (GVI) - your ultimate solution to overcoming market unpredictability and maximizing trading opportunities. This revolutionary indicator helps you in lowering your losing trades due to choppy market movements. The GVI is designed to measure market volatility, providing you with valuable insights to identify the most favorable trading prospects. Its intuitive interface consists of a dynamic red line representing the volatility index, accompanied by blue line that indicate
Gartley Projections D
Oleksandr Medviediev
3 (2)
Der Indikator identifiziert die harmonischen Muster (XABCD) gemäß den Entwicklungen von H.M. Gartley („Profits in the Stock Market“, 1935г). Der D-Punkt wird als Punkt in der perspektivischen Projektion projiziert (geben Sie in den Einstellungen ProjectionD_Mode = true an). Wird nicht neu gezeichnet. Wenn ein Balken des Arbeitszeitraums schließt und sich der identifizierte Musterpunkt während der Balken von Patterns_Fractal_Bars nicht bewegt hat, erscheint ein Pfeil auf dem Diagramm (in Ric
I would like to present to you really UNIQUE multitimeframe and multicurrency indicator which will be showing  both reaction zones ( Where the price will have an immediate reaction from a certain zone) and also a reversal zones , which could reverse price  for a long time. The main advantage is that ALL THE ZONES ARE SHOWN before the happen and not after like many do ( THis is shown very well in the screenshots) Another reason why it is unique is that you put it on 1 graph , for example EURUS
DYJ TRADINGVIEW ist ein Bewertungssystem mit mehreren Indikatoren, das die Anzahl der Bewertungssignale und Analysetools verwendet, um Einstiegsmöglichkeiten in globale Märkte zu finden DYJ TRADINGVIEW hat 10 eingebaute Indikatoren für die Marktanalyse. Eine indikatorbasierte Analyse wird von vielen Händlern verwendet, um ihnen zu helfen, Entscheidungen darüber zu treffen, welche Trades sie tätigen und wo sie ein- und aussteigen sollen. Wir verwenden mehrere verschiedene Typen, die sich g
Käufer dieses Produkts erwarben auch
Zunächst einmal ist es wichtig zu betonen, dass dieses Handelssystem ein Nicht-Repainting-, Nicht-Redrawing- und Nicht-Verzögerungsindikator ist, was es sowohl für manuelles als auch für automatisches Trading ideal macht. Das "Smart Trend Trading System MT5" ist eine umfassende Handelslösung, die für neue und erfahrene Trader maßgeschneidert ist. Es kombiniert über 10 Premium-Indikatoren und bietet mehr als 7 robuste Handelsstrategien, was es zu einer vielseitigen Wahl für verschiedene Marktbe
Atomic Analyst MT5
Issam Kassas
5 (12)
Zunächst einmal ist es erwähnenswert, dass dieser Handelsindikator nicht neu malt, nicht neu zeichnet und keine Verzögerung aufweist, was ihn sowohl für manuellen als auch für Roboterhandel ideal macht. Der Atom-Analyst ist ein PA-Preisaktionsindikator, der die Stärke und das Momentum des Preises nutzt, um einen besseren Vorteil auf dem Markt zu finden. Ausgestattet mit fortschrittlichen Filtern, die helfen, Rauschen und falsche Signale zu entfernen, und das Handelspotenzial zu erhöhen. Durch
Quantum Trend Sniper
Bogdan Ion Puscasu
5 (37)
Wir stellen vor       Quantum Trend Sniper Indicator   , der bahnbrechende MQL5-Indikator, der die Art und Weise, wie Sie Trendumkehrungen erkennen und handeln, verändert! Entwickelt von einem Team erfahrener Händler mit über 13 Jahren Handelserfahrung,       Quantum Trend Sniper-Indikator       wurde entwickelt, um Ihre Trading-Reise mit seiner innovativen Methode zur Identifizierung von Trendumkehrungen mit extrem hoher Genauigkeit auf ein neues Niveau zu heben. ***Kaufe Quantum Trend Snipe
Trend Screener Pro MT5
STE S.S.COMPANY
4.87 (62)
Nutzen Sie die Macht des Trendhandels mit Trend Screener Indicator: Ihrer ultimativen Trendhandelslösung, die auf Fuzzy-Logik und einem System mit mehreren Währungen basiert! Steigern Sie Ihren Trendhandel mit Trend Screener, dem revolutionären Trendindikator mit Fuzzy-Logik. Es handelt sich um einen leistungsstarken Trendfolgeindikator, der über 13 Premium-Tools und -Funktionen sowie 3 Handelsstrategien kombiniert und ihn zu einer vielseitigen Wahl macht, um Ihren Metatrader in einen Trendanaly
FX Volume MT5
Daniel Stein
4.94 (17)
Erhalten Sie Ihr tägliches Marktupdate mit Details und Screenshots über unser Morning Briefing hier auf mql5 und auf Telegram ! FX Volume ist der ERSTE und EINZIGE Volumenindikator, der einen ECHTEN Einblick in die Marktstimmung aus Sicht eines Brokers bietet. Es bietet fantastische Einblicke in die Positionierung von institutionellen Marktteilnehmern, wie z.B. Brokern, auf dem Forex-Markt, viel schneller als COT-Berichte. Diese Informationen direkt auf Ihrem Chart zu sehen, ist der wahre Game
Zunächst einmal ist es wichtig zu betonen, dass dieses Handelstool ein Nicht-Repaint-, Nicht-Redraw- und Nicht-Verzögerungsindikator ist, was es ideal für professionelles Trading macht. Der Smart Price Action Concepts Indikator ist ein sehr leistungsstarkes Werkzeug sowohl für neue als auch erfahrene Händler. Er vereint mehr als 20 nützliche Indikatoren in einem und kombiniert fortgeschrittene Handelsideen wie die Analyse des Inner Circle Traders und Strategien des Smart Money Concepts. Diese
Advanced Supply Demand MT5
Bernhard Schweigert
4.53 (15)
Derzeit 33% Rabatt! Die beste Lösung für jeden Anfänger oder erfahrenen Händler! Dieser Indikator ist ein einzigartiges, qualitativ hochwertiges und erschwingliches Trading-Tool, da wir eine Reihe von proprietären Funktionen und eine neue Formel integriert haben. Mit diesem Update werden Sie in der Lage sein, doppelte Zeitrahmenzonen anzuzeigen. Sie können nicht nur einen höheren TF (Zeitrahmen) anzeigen, sondern sowohl den Chart-TF als auch den höheren TF: SHOWING NESTED ZONES. Alle Supply Dema
A key element in trading is zones or levels from which decisions to buy or sell a trading instrument are made. Despite attempts by major players to conceal their presence in the market, they inevitably leave traces. Our task was to learn how to identify these traces and interpret them correctly. Reversal First Impulse levels (RFI)   -  Version MT4                  INSTRUCTIONS                 RUS                 ENG                         R ecommended to use with an indicator   -  TREND PRO  
AW Trend Predictor MT5
AW Trading Software Limited
4.76 (55)
Die Kombination von Trend- und Aufschlüsselungsebenen in einem System. Ein fortschrittlicher Indikatoralgorithmus filtert Marktrauschen, bestimmt den Trend, Einstiegspunkte sowie mögliche Ausstiegsniveaus. Indikatorsignale werden in einem Statistikmodul aufgezeichnet, das es Ihnen ermöglicht, die am besten geeigneten Tools auszuwählen, die die Wirksamkeit der Signalhistorie zeigen. Der Indikator berechnet Take-Profit- und Stop-Loss-Marken. Handbuch und Anleitung ->   HIER   / MT4-Version ->   H
TPSpro TRENDPRO  - is a trend indicator that automatically analyzes the market and provides information about the trend and each of its changes, as well as giving signals for entering trades without redrawing! The indicator uses each candle, analyzing them separately. referring to different impulses - up or down impulse. Exact entry points into transactions for currencies, crypto, metals, stocks, indices!  -  Version MT4                  DETAILED DESCRIPTION        /       TRADING SETUPS       
FX Power MT5 NG
Daniel Stein
5 (4)
Erhalten Sie Ihr tägliches Marktupdate mit Details und Screenshots über unser Morning Briefing hier auf mql5 und auf Telegram ! FX Power MT5 NG ist die nächste Generation unseres langjährig sehr beliebten Währungsstärkemessers FX Power. Und was bietet dieser Stärkezähler der nächsten Generation? Alles, was Sie am ursprünglichen FX Power geliebt haben PLUS GOLD/XAU-Stärkeanalyse Noch präzisere Berechnungsergebnisse Individuell konfigurierbare Analysezeiträume Anpassbares Berechnungslimit für noc
Dies ist ein Indikator für MT5, der genaue Signale für den Einstieg in einen Handel ohne Repainting (Neuzeichnen) liefert. Er kann auf alle Finanzwerte angewendet werden: Forex, Kryptowährungen, Metalle, Aktien, Indizes. Er liefert ziemlich genaue Schätzungen und sagt Ihnen, wann es am besten ist, eine Position zu eröffnen und zu schließen. Sehen Sie sich das Video (6:22) mit einem Beispiel für die Verarbeitung nur eines Signals an, das sich für den Indikator gelohnt hat! Die meisten Händler ver
RelicusRoad Pro MT5
Relicus LLC
4.82 (22)
Jetzt 147 US -Dollar (nach ein paar Aktualisierungen auf 499 US -Dollar) - Unbegrenzte Konten (PCs oder MACs) RelicusRoad Benutzerhandbuch + Schulungsvideos + Zugang zur privaten Discord-Gruppe + VIP-Status EINE NEUE ART, DEN MARKT ZU BETRACHTEN RelicusRoad ist der weltweit leistungsstärkste Handelsindikator für Forex, Futures, Kryptowährungen, Aktien und Indizes und gibt Händlern alle Informationen und Tools, die sie benötigen, um profitabel zu bleiben. Wir bieten technische Analysen un
Gartley Hunter Multi
Siarhei Vashchylka
5 (5)
Gartley Hunter Multi - An indicator for searching for harmonic patterns simultaneously on dozens of trading instruments and on all classic timeframes: (m1, m5, m15, m30, H1, H4, D1, Wk, Mn). Manual (Be sure to read before purchasing) | Version for MT4 Advantages 1. Patterns: Gartley, Butterfly, Shark, Crab. Bat, Alternate Bat, Deep Crab, Cypher 2. Simultaneous search for patterns on dozens of trading instruments and on all classic timeframes 3. Search for patterns of all possible sizes. Fr
ICT, SMC, SMART MONEY CONCEPTS, SMART MONEY, Smart Money Concept, Support and Resistance, Trend Analysis, Price Action, Market Structure, Order Blocks, BOS/CHoCH,   Breaker Blocks ,  Momentum Shift,   Supply&Demand Zone/Order Blocks , Strong Imbalance,   HH/LL/HL/LH,    Fair Value Gap, FVG,  Premium  &   Discount   Zones, Fibonacci Retracement, OTE, Buy Side Liquidity, Sell Side Liquidity, BSL/SSL Taken, Equal Highs & Lows, MTF Dashboard, Multiple Time Frame, BigBar, HTF OB, HTF Market Structure
Professional Scalping Tool on Deriv Attention! The indicator will be sold in limited quantities!!! The previous 5 copies were sold for $250 The next 5 copies will be sold for $350 The next price is $500 Description: This trading indicator is designed for professional traders focused on scalping. Designed with the market in mind, it provides highly accurate spike trading signals. It works on the M1 timeframe and supports the following symbols: Boom 300 Index, Boom 500 Index, Boom 1000 Index,
The Volume by Price Indicator for MetaTrader 5 features Volume Profile and Market Profile TPO (Time Price Opportunity). Get valuable insights out of currencies, equities and commodities data. Gain an edge trading financial markets. Volume and TPO histogram bar and line charts. Volume Footprint charts. TPO letter and block marker charts including split structures. Versatile segmentation and compositing methods. Static, dynamic and flexible ranges with relative and/or absolute visualizations. Lay
MetaForecast M5
Vahidreza Heidar Gholami
5 (2)
MetaForecast prognostiziert und visualisiert die Zukunft eines beliebigen Marktes basierend auf den Harmonien in den Preisdaten. Obwohl der Markt nicht immer vorhersehbar ist, kann MetaForecast, wenn es ein Muster im Preis gibt, die Zukunft so genau wie möglich voraussagen. Im Vergleich zu ähnlichen Produkten kann MetaForecast durch die Analyse von Markttrends genauere Ergebnisse erzeugen. Eingabeparameter Past size (Vergangene Größe) Gibt an, wie viele Balken MetaForecast verwendet, um ein Mo
Auto Order Block with break of structure based on ICT and Smart Money Concepts Futures Break of Structure ( BoS )             Order block ( OB )            Higher time frame Order block / Point of Interest ( POI )    shown on current chart           Fair value Gap ( FVG ) / Imbalance   ,  MTF      ( Multi Time Frame )    Volume Imbalance     ,  MTF          vIMB Gap’s Equal High / Low’s     ,  MTF             EQH / EQL Liquidity               Current Day High / Low           HOD /
Quantum Heiken Ashi PRO MT5
Bogdan Ion Puscasu
4.5 (8)
Wir stellen den   Quantum Heiken Ashi PRO   vor Die Heiken-Ashi-Kerzen wurden entwickelt, um klare Einblicke in Markttrends zu geben und sind bekannt für ihre Fähigkeit, Rauschen herauszufiltern und falsche Signale zu eliminieren. Verabschieden Sie sich von verwirrenden Preisschwankungen und begrüßen Sie eine glattere, zuverlässigere Diagrammdarstellung. Was den Quantum Heiken Ashi PRO wirklich einzigartig macht, ist seine innovative Formel, die traditionelle Candlestick-Daten in leicht lesbare
Werden Sie Breaker Trader und profitieren Sie von Änderungen der Marktstruktur, wenn sich der Preis umkehrt. Der Order Block Breaker Indikator zeigt an, wann sich eine Trend- oder Preisbewegung der Erschöpfung nähert und bereit ist, sich umzukehren. Es weist Sie auf Änderungen in der Marktstruktur hin, die normalerweise auftreten, wenn eine Umkehrung oder ein größerer Rückzug bevorsteht. Der Indikator verwendet eine proprietäre Berechnung, die Ausbrüche und Preisdynamik identifiziert. Jedes
Blahtech Supply Demand MT5
Blahtech Limited
4.57 (14)
Was: $299  Now: $99   Supply Demand uses previous price action to identify potential imbalances between buyers and sellers. The key is to identify the better odds zones, not just the untouched ones. Blahtech Supply Demand indicator delivers functionality previously unavailable on any trading platform. This 4-in-1 indicator not only highlights the higher probability zones using a multi-criteria strength engine, but also combines it with multi-timeframe trend analysis, previously confirmed swings
Wir stellen vor       Quantum Breakout PRO   , der bahnbrechende MQL5-Indikator, der die Art und Weise, wie Sie mit Breakout-Zonen handeln, verändert! Entwickelt von einem Team erfahrener Händler mit über 13 Jahren Handelserfahrung,       Quantum Breakout PRO       ist darauf ausgelegt, Ihre Handelsreise mit seiner innovativen und dynamischen Breakout-Zone-Strategie auf ein neues Niveau zu heben. Der Quantum Breakout Indicator zeigt Ihnen Signalpfeile auf Breakout-Zonen mit 5 Gewinnzielzone
XQ Indicator MetaTrader 5
Marzena Maria Szmit
5 (1)
Step into the realm of Forex trading with confidence and precision using XQ, a cutting-edge Forex indicator designed to elevate your trading game to unprecedented heights. Whether you're a seasoned trader or just stepping into the world of currency exchange, XQ Forex Indicator empowers you with the insights and signals needed to make informed trading decisions. The signal conditions are a combination of three indicators, and XQ Forex Indicator only display  medium and long-term trends . The ind
Owl Smart Levels MT5
Sergey Ermolov
4.49 (37)
MT4-Version  |  FAQ Der Owl Smart Levels Indikator ist ein komplettes Handelssystem innerhalb eines Indikators, der so beliebte Marktanalysetools wie die fortschrittlichen Fraktale von Bill Williams , Valable ZigZag, das die richtige Wellenstruktur des Marktes aufbaut, und Fibonacci-Levels , die die genauen Einstiegslevels markieren, enthält in den Markt und Orte, um Gewinne mitzunehmen. Detaillierte Strategiebeschreibung Anleitung zur Verwendung des Indikators Berater-Assistent im Handel Owl H
Eng Gold
Ely Alkrar Xshkaky
ENG-GOLD Scalper It is an auxiliary indicator that identifies potential targets and determines the place of entry with a stop loss that works on Heiken Ashi candles  The green lines are usually the targets, the red lines are the stop loss, and the yellow lines are the entry location.  This file is recognized on small and medium frames, usually less than the watch frame I highly recommend using XAUUSD US100 US30 USOIL 
Zunächst einmal ist es wichtig zu betonen, dass dieses Handelssystem ein Nicht-Repainting-, Nicht-Redrawing- und Nicht-Verzögerungsindikator ist, was es ideal für den professionellen Handel macht. Das "Smart Support and Resistance Trading System" ist ein fortschrittlicher Indikator, der für neue und erfahrene Trader entwickelt wurde. Es ermöglicht Tradern Präzision und Vertrauen auf dem Devisenmarkt. Dieses umfassende System kombiniert mehr als 7 Strategien, 10 Indikatoren und verschiedene Ha
Malaysian SNR Levels
Matthias Horst Pieroth
This indicator can be used to display Support and Resistance levels according to  the  Malaysian SNR concept , in which Support and Resistance are exact levels of a line chart. Malaysian SNR There are 3 different horizontal levels in Malaysian SNR: A-Level : This level is located at the peak of this line chart. (shape looks like the letter A) V-Level : Level at the valley of a line chart, (shape looks like the letter V) Gap-Leve l: This level is located at the Close/Open gap between two cand
Gartley Hunter MT5
Siarhei Vashchylka
5 (13)
Gartley Hunter - An indicator for searching for harmonic patterns (Gartley patterns) and their projections. The indicator is equipped with a system of alerts and push notifications. Manual (Be sure to read before purchasing) | Version for MT4 Advantages 1. 12 harmonic patterns: 7 classical and 5 exotic. New patterns will be added as the indicator develops. 2. Constant automatic search for harmonic patterns. The indicator is capable of finding from the smallest to the largest patterns. 3. Autom
Die beste Lösung für jeden Newbie oder Expert Trader! Dieser Indikator ist ein einzigartiges, qualitativ hochwertiges und erschwingliches Handelsinstrument, da wir eine Reihe von proprietären Funktionen und eine geheime Formel eingebaut haben. Mit nur EINEM Chart liefert er Alerts für alle 28 Währungspaare. Stellen Sie sich vor, wie sich Ihr Handel verbessern wird, weil Sie in der Lage sind, den genauen Auslösepunkt eines neuen Trends oder einer Scalping-Gelegenheit zu erkennen! Auf der Gru
Weitere Produkte dieses Autors
DYJ Follow Me   is an EA that follows the virtual transaction record of any dyj indicator to actually open and close positions. It can display the name and status of the indicator of the single signal source; At present, it is only the   DYJ SignalSourceOfWPR MT5   indicator, and more indicators will be expanded in the future. It can receive real-time trend direction of indicator. It can receive the latest admission time of the indicator. It can receive the latest admission price of
DYJ CashRegistrEA arbeitet an DYJ technischen Indikatoren. Wenn der Markt stark ist, Diese EA finden die Chance und Handel in sicheren Markt. Konsistentes Verdienen mit sicherer Zeit des Handels. EA verwendet einen Auftragsmodus, um das Transaktionsvolumen zu minimieren und die Strategie des Profitschließungsalgorithmus zu maximieren. Kein Netzhandel. Keine Arbitrage. Keine Hedge. Kein Martingale. Please download the setting file and the PDF file of the back test report in the product c
Die Planung von DYJ-Transfers ist ein Trends-System für Transaktionen, das eine Lagerhalle am Wendepunkt des Trends eröffnet. Ein beliebiges Symbol für einen beliebigen Broker: Devisenkurse oder eine andere Art (Der Volatility Index eines Brokers ) Es zeigt die zugrunde liegenden Garantien für TP, SL, Rasterabstand und TPSL-Gewinnspanne sowie Mindesttransaktionsbetrag. Nach dem Öffnen des Lagers wird die Gewinnspanne für jede Kategorie angezeigt. Jede Kategorie verfügt über eine automatische
This QuickClose help you to close all orders having profit immediately with only ONE CLICK, its work is very fast. You can choose which symbol you want or close all symbols so it will helpful for you in your trading to manage trading faster. This EA can quick close all Buy and Sell Orders by a selected symbol or total. This SymbolButton is designed for closing orders. There is available Manual and Automatic closing functions. Automatic closing function will close the orders according the paramet
Professional traders know that a reversal in market price is the best entry points to trade. The trend changes K line state changes the most obvious. The SoarSignal is good to identify these changes, because we have incorporated the KDJ indicators. It is the closest to the K line state of the indicators. The two lines of KDJ Winner move within a range of 0 and 100. Values above 80 are considered to be in overbought territory and indicate that a reversal in price is possible. Values below 20 are
StrongCurrency
Daying Cao
5 (1)
This StrongCurrency is a complete trading system based on a variety of technical indicators, moving averages and pivots. Each of those elements can be assessed in defined rules and coefficients (depending on the indicator) providing limitless optimization scenarios for the StrongCurrency. In order to work the StrongCurrency creates a trend strength and entry point signal list display by evaluating these data, that takes data from all symbols. It extrapolates all the information in order to get t
PowerSignal
Daying Cao
5 (1)
Dieses PowerSignal ist ein komplettes Handelssystem, das auf ATR von technischen Indikatoren basiert. Diese Indikatoren zeichnen den aktuellen Status jedes POWERTRENDs in jedem analysierten Zeitrahmen und Währungspaar auf. Das PowerSignal erstellt durch Auswertung dieser Daten eine Trendstärken- und Einstiegspunkt-Signallistenanzeige. Wenn es bei einem Paar eine vollständige Übereinstimmung gibt, wird eine Warnung angezeigt, die auf einen solchen Fall hinweist. Listendaten umfassen Symbol, M5-M
This indicator shows the crossing between two moving averages, a slower and faster moving average. Signal show alert pop-up, when MA1 crosses above the MA2. Signal show alert pop-up, when MA1 crosses below the MA2. Inputs Value Fast MA Setup Period = 5 - period of Faster Moving Average (value 5). Mode = SMA - type of Moving Average (SMA, EMA, SMMA, LWMA). Price = Close - type of price (Close, Open, Low, High, Median, Typical, Weighted). Slow MA Setup Period = 10 - period of Slower MA (value 10
This EA is based on the classical trend-following system of opening the positions. The EA is based on DYJ TwoMACrossAlarm and ATR and CCI indicator. It uses two moving averages. The EA uses dynamic allocation MA period. The MA1 and MA2 period is the Fibonacci sequence, such as 5.8 or 13.21 or 21.34 or...; EA Entry Rules: Go long when fast MA1 crosses above the slow MA2 and CCI crosses above the zero line; Go short when fast MA1 crosses below the slow MA2 and CCI crosses below the zero line; the
DYJ News Developers sind die grundlegenden Marktanalyseindikatoren für Kalendertransaktions-Tools und makroökonomische Ereignisse. Hier finden Sie die Finanznachrichten und-indikatoren der größten Volkswirtschaft der Welt – von den USA und der Europäischen Union bis zu Australien und Japan – in neun Wirtschaftsnationen mit mehr als 60 Währungspaaren. Erfassung von über 800 makroökonomischen Indikatoren und Ereignissen aus öffentlichen Quellen in Echtzeit. Jeder Indikator weist historische, ak
This indicator shows the crossing between three moving averages (slower, middle and faster ones). When fast MA crosses up middle MA and middle MA crosses up slow MA, the bullish alert is issued. When fast MA crosses down middle MA and middle MA crosses down slow MA, the bearish alert is issued. Signals to close buy positions are generated if fast MA crosses middle MA downwards, signals to close sell positions are generated if fast MA crosses middle MA upwards. Inputs Fast MA Setup MAPeriod1 =
The Expert Advisor is based on three Moving Average indicators. ThreeMACross is based on the following idea: crossing of three Moving Average lines (Fast, Middle and slow ones) is used as a signal for opening and closing a position together. Go Long when Fast MA (MA1) crosses above Middle MA (MA2), and Middle MA (MA2) crosses above Slow MA (MA3). Go Short when Fast MA (MA1) crosses below Middle MA (MA2), and Middle MA (MA2) crosses below Slow MA (MA3). Signals to close buy positions are generate
The RiseTrading is a unique High quality and easy to use and affordable trading tool because we have incorporated a number of proprietary features and PowerSignal and MACD and Stochastic indicators. The main advantages of the trend trading strategy used by the Expert Advisor are opening positions only in the direction of a trend, ability for the long-term retention of profitable positions allowing users to achieve good combinations of profit/loss distributions. That can work on a real account at
DYJ-Aktien-Controller ist ein monetäres Transaktionssystem Es kann für jedes Währungspaar von M1 bis MN einen zufälligen Wert anzeigen. Wenn der Wert für Stoch in einem Zeitraum den Supermarkt und den Supermarkt erreicht, werden farbige Hinweise angezeigt. Sie können den richtigen Deal anhand dieser Informationen machen. Erstellen Sie eine Vorlage für den Bestandsindikator DYJ Inventory Controller, und speichern Sie diese. Wenn Sie mit der Maus auf einen Supermarkt oder einen Supermarkt klick
The DYJ SoarTrading is based on SoarSignal indicator. It can be used for any currency pair and timeframe. Signals to buy are generated when SoarSignal has crossed oversold downwards, reached oversold and then crossed back up through oversold. Signals to sell are generated when SoarSignal has crossed overbought upwards, reached overbought, and then crossed back down through overbought. Close a trade when SoarSignal reaches the opposite side ( overbought for long order, oversold for short order).
The  DYJ WPR - SignalSource is based on  WPR  indicator. It can be used for any currency pair and timeframe. The  WPR  recommends  Indicator values ranging between 80 and 100% indicate that the market is oversold. Indicator values ranging between 0 and 20% indicate that the market is overbought. The entry signal of this indicator is a turning point in the trend. The indicator uses analog trading technology, Provide you with indicators to evaluate the overall profit of the opening signal and c
DYJ Sharp advanced algorithm that detects new trends and current trend continuations for use as an entry and exit strategy. The strategy display the SHARP trend demarcation area. This SHARP area has high HighLine and low LowLine. Falling of high below HighLine of SHARP and then falling of close below LowLine of SHARP can be interpreted as a signal to sell. Rising of close above HighLine of SHARP and then rising of low above LowLine of SHARP can be interpreted as a signal to buy. The signal for e
DYJ TRENDWAVE features an advanced algorithm that detects new trends and current trend continuations for use as an entry strategy. DYJ TRENDWAVE's volatility is based on the power of buyers and sellers, it grabs total body size of candles and identifies the battle between buyers and sellers as a percentage of the total volume, like Sellers: (-)100% and Buyers: (+)100%. This information can be used for any entry and exit strategy. For bullish/Long Pin bar it is below the price line, for bearish/S
DYJTRENDWAVE features an advanced algorithm that detects new trends and current trend continuations for use as an entry strategy. DYJTRENDWAVE's volatility is based on the power of buyers and sellers, it grabs total body size of candles and identifies the battle between buyers and sellers as a percentage of the total volume, like Sellers: (-)100% and Buyers: (+)100%. This information can be used for any entry and exit strategy. For bullish/Long Pin bar it is below the price line, for bearish/Sho
DYJ Scalping ist ein vollautomatischer Expert Advisor. Für Einträge wird der Stochastische Indikatorfilter verwendet. Der Berater benötigt einen Hedging- und ECN-Kontotyp. Der Auftragsverlust wird durch das Spiel gerettet und wird zum Gewinn. Wenn die Bestellrichtung falsch ist. Sie können die Spielstrategie jederzeit deaktivieren. Allgemeine Empfehlungen Empfehlen Sie ECN-Konten, xauusd Spreads zwischen 8 und 11 oder niedriger, EUR/USD Spreads 1 Die Mindesteinzahlung beträgt 200€. Please downl
Der DYJ T3ModeMA basiert auf dem T3-Algorithmus. Der T3-Algorithmus wurde im Artikel „Better Moving Average“ des US-Magazins TASC in der technischen Analyse eingeführt. T3 kann Preisserien glätten und gleichzeitig die Verzögerung des Trendverfolgungssystems reduzieren. Die Spaltengröße des Indikators bestimmt das Eintrittsignal und wenn die Spaltengröße nahe bei 0 liegt, ist dies der Trendwendepunkt. Der Indikator verwendet die Simulation der Handelstechnologie, Bietet Indikatoren, um die G
DYJ Langfristige Strategie EA ist ein langfristiges Handelssystem Wir beginnen mit der Suche nach dem niedrigsten Preis in der Kerze als Long-Trend, und beginnen mit der Suche nach dem höchsten Preis als Short-Trend. Wir werden die Position für die längste Zeit halten und den maximalen Gewinn erzielen. Wenn der Auftrag in die falsche Richtung geht, kann die Strategie Verluste in Gewinne verwandeln. EA wird nur für eine Währung pro Periode im Diagramm ausgeführt. Signal URL INPUT InpMagicNumb
The DYJBands opens and closes positions using Bollinger Bands signals: It performs trades after a price rebound from the borderlines of the indicator. It has the option to close positions by an opposite signal, by take profit and stop loss, move a trade to breakeven upon reaching the central Bollinger band or after a certain price movement. By default, the EA is configured for trading the GBPUSD currency pair on the H1 timeframe. Also, settings for the EURUSD, USDJPY, USDCAD and XAUUSD currency
The DYJ MacdSto is a unique High quality and easy to use and affordable trading tool because we have incorporated a number of proprietary features and MACD and Stochastic and RSI and ADX indicators. The main advantages of the trend trading strategy used by the Expert Advisor are opening positions only in the direction of a trend, ability for the long-term retention of profitable positions allowing users to achieve good combinations of profit/loss distributions. DYJ MacdSto EA uses MACD and Stoch
This StrongCurrency is a complete trading system based on a variety of technical indicators, moving averages and pivots. Each of those elements can be assessed in defined rules and coefficients (depending on the indicator) providing limitless optimization scenarios for the StrongCurrency. In order to work the StrongCurrency creates a trend strength and entry point signal list display by evaluating these data, that takes data from all symbols. It extrapolates all the information in order to get t
The DYJ TrendPending EA tracks the new change of price of the currency pair and opens trades in case of a price low and high from the main movement in the direction of the trend. So EA uses the least risky grid and Add lots. And can attach a positive and reverse pending order. The PositivePending orders can reduce the number of grids and Add lots,  while ReversePending orders reduce the loss of orders . For more convenient search, the working timeframe has been added to inputs (Work timeframe).
This is a multi-currency and multi-strategy EA. This EA is to create one or more polling trading strategies in a transaction. In the polling mode, the strategies filter a trend-free range market environment and trades are placed in the opposite direction at the edges of the range. With an additional main trend filter in the trend-following mode, the DYJ's ArtOfForexWar can also trade pull-backs during trends in the trend of loss. The winning rate is more than 95% within three orders or three cl
DYJ ScalpingBurg EA ist ein vollautomatischer Expert Advisor. Der Burg Algorithmus Filter wird für Einträge verwendet. Der Berater benötigt einen Hedging- und ECN-Kontotyp. Der Auftragsverlust wird durch das Spiel gerettet und wird zum Gewinn. Wenn die Bestellrichtung falsch ist. Sie können die Spielstrategie jederzeit deaktivieren. Allgemeine Empfehlungen Empfehlen Sie ECN-Konten, xauusd Spreads zwischen 8 und 11 oder niedriger, EUR/USD Spreads 1 Die Mindesteinzahlung beträgt 200€. Bitte laden
DYJ ArtOfMakingMoney attempts to gauge bullish and bearish forces in the market by using two separate measures, one for each type of directional pressure. The  EA's BearsIndex  attempts to measure the market's appetite for lower prices The EA's BullsIndex attempts to measure the market's appetite for higher prices Features Monitors all pairs at the same time. The EA monitors the top 35 pairs by default, but you can select less pairs if you wish. It is a multi-currency EA that can be run from a
Unser Ziel ist es, einen zugänglichen und qualitativ hochwertigen Service zu bieten und Marktteilnehmern, Händlern und Analysten gleichermaßen die dringend benötigten Werkzeuge für fundierte, zeitnahe Handelsentscheidungen zu ermöglichen. Der optimierteste, äußerst robuste und benutzerfreundlichste DYJ-Trend-Analyst-Indikator. Der DYJ Trend-Analyst versucht, bullische und bärische Kräfte auf dem Markt zu messen, indem er zwei separate Messgrößen verwendet, eine für jede Art von Richtungsdru
Auswahl:
Keine Bewertungen
Antwort auf eine Rezension
Version 1.52 2019.11.07
--added InpAdxLevel = 30 // Entry trend level
--added ADX = Weak_Trend // Adx trend
Version 1.51 2019.11.07
Version 1.51 - 2019.11.07
--Increase R4 and S4 prices of pivot strategy and their corresponding center prices M6 and M7
--Added display transaction information: direction, price, stop profit and stop loss