• Übersicht
  • Bewertungen
  • Diskussion

ChzhshchMACD

Apropos Zen MACD-Indikator

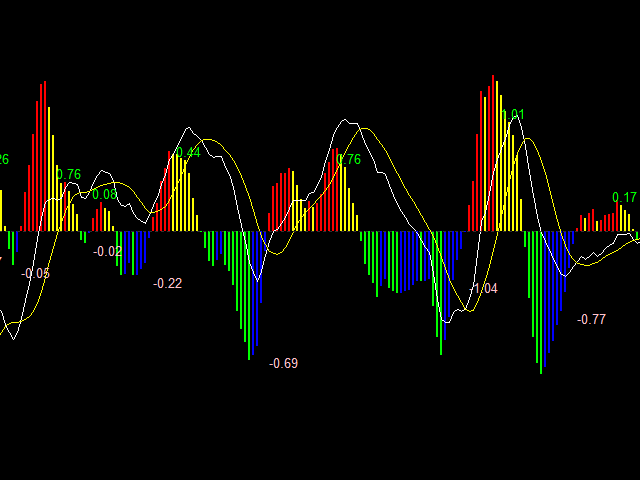
Vierfarbiger Zweidraht-MACD

Zeigen Sie die Summe der Fläche der Spalte an

InpFastMA=12; // Schnelle EMA-Periode

InpSlowMA=26; // Langsame EMA-Periode

InpSignalMA=9; // Signal-SMA-Periode

InpAppliedPrice=PRICE_CLOSE;// Angewandter Preis

InpMaMethod=MODE_EMA; //Ma_Method

input bool ChArea = false; //chzhshch Bereich

Fast-Line-Parameter für die EMA-Periode

Parameter der langsamen EMA-Periode für die langsame Linie

Signal SMA-Periode Signalleitungsparameter

Anwendungspreis optional

Vergleichen Sie die in der Twist-Theorie definierte Trendstärke, vergleichen Sie die beiden Trends und vergleichen Sie die Summe der Säulenfläche

Dieser Indikator berechnet die entsprechende Fläche und erleichtert den Vergleich
Empfohlene Produkte
Introducing the Consecutive Green/Red Candle Alert Indicator for MT5 - Your Trend Spotting Companion! Are you ready to take your trading to the next level? We present the Consecutive Green/Red Candle Alert Indicator, a powerful tool designed to help you spot trends and potential reversals with ease. Whether you're a new trader looking for clarity in the market or an experienced pro seeking additional confirmation, this indicator is your trusted companion. Key Features of the Consecutive Gre
Buy CTS scalping indicator, provide buying and selling signals, automatic channeling and sending signals to mobile phones Using technical analysis and price action methods and modern methods, CTS indicator can draw price channels and recognize price trends with high accuracy and issue entry and exit signals according to them. Traders can easily fluctuate using this indicator in different time frames and in different markets. With the CTS indicator, you can signal in different ways. This indicat
Технический индикатор Universal Oscillator является комбинацией торговых сигналов самых популярных и широко используемых осцилляторов. Индикатор представлен гистограммами, а также линиями fast и slow MA, что позволяет расширить список получаемых торговых рекомендаций и работать как по тренду, так и в боковом движении рынка. Таким образом, гистограммы позволяют определить момент пробоя ценовых значений и движение в новой фазе рынка, а линии указывают на зоны перекупленности и перепроданности.  Ос
Volality Index scalper indicator  Meant for Volality pairs such as Volality 10, 25, 50, 75 and 100 The indicator works on all timeframes from the 1 minute to the monthly timeframe the indicator is non repaint the indicator has 3 entry settings 1 color change on zero cross 2 color change on slope change 3 color change on signal line cross Orange line is your sell signal Blue line is your buy signal.
Pirates MACD
Jefferson Judge Metha
The Pirates MACD is a Momentum Indicator that shows us not just the Classical MACD, it also shows us high priority trades. the user has an option of selecting among several options the best settings that suits their trading style, even if one has no trading style, Pirates always find a way to survive hence the Pirates MACD is equipped with easy to understand tools. that reduce the strain on ones analysis giving them visual advantages over classical MACD techniques.  This product is made as an
Implements a channel based on the moving average indicator with improved functionality. Moving average, moving average (English Moving average, MA) is a general name for a family of functions, the values ​​of which at each point of determining the level of some average value of the original function for the previous period. The channel moves up and down relative to the moving average by a specified number of points. This indicator is suitable for those who are interested in the classic calc
MACDivergence MTF MT5
Pavel Zamoshnikov
4.17 (6)
Advanced ideas of the popular MACD indicator: It detects and displays classic and reverse divergences (two methods of detecting divergences). It uses different color to highlight an uptrend and a downtrend. Two methods of determining a trend: а) MACD crosses the 0 level (classic signal); б) MACD crosses its own average (early signal). This is a multi-timeframe indicator: it can display MACD data from other timeframes. Two methods of drawing: classic histogram and line. It generates sound and vis
The best time to trade Using this Indicator is when the time reach exactly hour,half,45 minutes,15 minutes and sometimes 5 minutes.. This indicators is helpful to those who trade boom and crash indecies.How to read this indicator first you'll see Blue allow and Red allow all these allows used to indicate or to detect the spike which will happen so the allow happens soon before the spike happen.This indicator works properly only in boom and crash trading thing which you have to consider when
KT Renko Patterns MT5
KEENBASE SOFTWARE SOLUTIONS
KT Renko Patterns scans the Renko chart brick by brick to find some famous chart patterns that are frequently used by traders across the various financial markets. Compared to the time-based charts, patterns based trading is easier and more evident on Renko charts due to their uncluttered appearance. KT Renko Patterns features multiple Renko patterns, and many of these patterns are extensively explained in the book titled Profitable Trading with Renko Charts by Prashant Shah. A 100% automate
Noize Absorption Index - is the manual trading system that measures the difference of pressure between bears forces and bulls forces. Green line - is a noize free index that showing curent situation. Zero value of index shows totally choppy/flat market.Values above zero level shows how powerfull bullish wave is and values below zero measures bearish forces.Up arrow appears on bearish market when it's ready to reverse, dn arrow appears on weak bullish market, as a result of reverse expectation.
Tendencia Crash300
Ignacio Agustin Mene Franco
Professional Pack Crash 300 Indicators, On this occasion I present the trend indicator that is for the crash index 300 (Deriv Broker) The indicator consists of a strategy where trends are caught in periods of 15 minutes, very clearly the indicator shows the purchase marking the tip of red until the trend develops, and then mark the green point of purchase, it is very simple to use, It is recommended to use in that temporality since it serves to catch longer trends and increase profit, the indica
Superb Trend
Sukhvinder Singh
Get the best out of your forex trading experience with our Superb Trend   indicator! Our revolutionary technology helps you make smarter and more successful trades, no matter your skill level. With a simple and intuitive interface, you'll be able to analyze trends and make wiser decisions in no time. Stop gambling with your money; start leveraging our Superb Trend Indicator to outperform the market! Trend Signals: Bullish trend will show as Green line. Bearish trend will show as Red line. Su
Cumulative delta indicator As most traders believe, the price moves under the pressure of market buying or selling. When someone redeems an offer standing in the cup, the deal is a "buy". If someone pours into the bid standing in the cup - the deal goes with the direction of "sale". The delta is the difference between purchases and sales. A cumulative delta - the difference between the cumulative sum of purchases and sales for a certain period of time. It allows you to see who is currently contr
Eine erweiterte Version des bekannten Indikators Moving Average Convergence / Divergence (MACD), verteilt in 4 Farben: Wachstum, Fall über und unter 0. 26 Optionen zum Glätten von gleitenden Durchschnitten, 11 Preisarten. Deaktivierte Warnungen bei Farbwechsel mit       wählbarer Alarmmodus: nur beim Überschreiten eines Nullwertes oder bei jedem Farbwechsel (steigender / fallender Wechsel und 0-Durchgang). Glättungsoptionen: Einfach, Exponential, Wilder Exponential, Linear Weighted, Sinus Weight
OPTMIZE EA BEFORE BACKTEST AND USE. United States Stock Market Index US500 trades the 5 minute charts.  The EA uses RSI and Stochastics  for entries and ATR for exits.  The building period was  From 2021-03-19 to 2022-08-18. Continually optimize the EA to find best settings and don't forget to account for spreads and slippage in optimization .  The EA does not use martingale and has a sl and tp on each trade with a fixed lot input.  Try it out in the back test, optimize for settings.  Risk Di
Der Indikator berechnet und zeichnet automatisch Fibonacci-Unterstützungs- und Widerstandsniveaus - eines der effektivsten Werkzeuge für die Marktanalyse. Die Berechnung verwendet die gemittelten Preisdaten für den ausgewählten Zeitraum und Zeitraum. Das Minimum und das Maximum für diesen Zeitraum gelten als Beginn und Ende der Bewegung. Fibonacci-Niveaus ermöglichen es Ihnen, potenzielle Referenzpunkte zu erkennen, um die sich die Preisbewegung verlangsamen oder umkehren kann, dh sie werden ver
This multi time frame and multi symbol indicator for MT5 alerts about Heiken Ashi Smoothed color changes. As a bonus it can also scan for Hull Moving Average color (trend) changes. Combined with your own rules and techniques, this indicator will allow you to create (or enhance) your own powerful system. Features Can monitor all symbols visible in your Market Watch window at the same time. Apply the indicator to just one chart and instantly monitor the entire market. Can monitor every time fram
The Jackson Auto Candlestick Pattern . It a powerful price action tool which auto detect and alert a hided powerful candlestick patterns . It came with few different chart skins. You can use this indicator alone to make profit, but it powerful when you combine it with trendlines, You can download The Jackson Auto Trendlines for free Link : UCRW695l9Wgg2ucnnf5DL5Vw  List of Candlestick Pattern it detect   1. Bullish & Bearish Engulfing's 2. Top and Bottom Tweezer 3. Bullish and Bearish Harams 4.
Introduction The "Two Moving Average Crossover" indicator for MetaTrader 5 (MT5) is a technical analysis tool that displays two moving averages and notifies when the moving averages cross each other. The indicator calculates and plots two moving averages, one of which is faster and the other is slower. When the faster moving average crosses above the slower moving average, it is considered a bullish signal, indicating a potential trend reversal or the start of a new uptrend. Conversely, when th
The Hull  Butterfly  Oscillator (HBO) is an oscillator constructed from the difference between a regular  Hull Moving Average  (  HMA  ) and another with coefficients flipped horizontally . Levels are obtained from cumulative means of the absolute value of the oscillator. These are used to return dots indicating potential reversal points . This indicator draw line in separate window, plus blue dot (for buy signal) when hull oscillator is peak and red when sell signal. It  also includes integrate
PipFinite Trend PRO MT5
Karlo Wilson Vendiola
4.87 (664)
Breakthrough Solution For Trend Trading And Filtering With All Important Features Built Inside One Tool! Trend PRO's smart algorithm detects the trend, filters out market noise and gives entry signals with exit levels. The new features with enhanced rules for statistical calculation improved the overall performance of this indicator. Important Information Revealed Maximize the potential of Trend Pro, please visit www.mql5.com/en/blogs/post/713938 The Powerful Expert Advisor Version Automa
Price Breakout pattern Scanner is the automatic scanner for traders and investors. It can detect following patterns automatically from your chart. Head and Shoulder - Common tradable pattern. Reverse Head and Shoulder - This pattern is the reverse formation of the Head and Shoulder. Double Top - When the price hits resistance level twice and decline toward the support level, the trader can anticipate sudden bearish breakout through the support level. Double Bottom - The double bottom pattern is
Your Trend Friend
Luigi Nunes Labigalini
The trend is your friend! Look at the color of the indicator and trade on that direction. It does not  repaint. After each candle is closed, that's the color of the trend. You can focus on shorter faster trends or major trends, just test what's most suitable for the symbol and timeframe you trade. Simply change the "Length" parameter and the indicator will automatically adapt. You can also change the color, thickness and style of the lines. Download and give it a try! There are big movements
For a trader, trend is our friend. This is a trend indicator for MT5, can be used on any symbol. just load it to the terminal and you will see the current trend. green color means bullish trend and red means bearlish trend. you can also change the color by yourself when the indicator is loaded to the MT5 terminal the symbol and period is get from the terminal automaticly. How to use: I use this trend indicator on 2 terminals with different period  for the same symbol at same time. for example M5
Owl Smart Levels MT5
Sergey Ermolov
4.47 (36)
MT4-Version  |  FAQ Der Owl Smart Levels Indikator ist ein komplettes Handelssystem innerhalb eines Indikators, der so beliebte Marktanalysetools wie die fortschrittlichen Fraktale von Bill Williams , Valable ZigZag, das die richtige Wellenstruktur des Marktes aufbaut, und Fibonacci-Levels , die die genauen Einstiegslevels markieren, enthält in den Markt und Orte, um Gewinne mitzunehmen. Detaillierte Strategiebeschreibung Anleitung zur Verwendung des Indikators Berater-Assistent im Handel Owl H
MACD 2 Lines
Markus Paminger
MACD with fast and slow EMA. Moving average convergence divergence (MACD) is a trend-following momentum indicator that shows the relationship between two moving averages of a security's price . The MACD is calculated by subtracting the fast-period exponential moving average (EMA) from the slow-period EMA. Setup options: Fast EMA period Slow EMA period Signal EMA period Applied price Indicator window height Color MACD Color Signal Color Histogram
Bear Bull
Ignacio Agustin Mene Franco
Bear Bull! It is an indicator that marks with Heikin Ashi candles but modified, the sales and purchases long and short trend! with 2 colors green marks the purchase, purple marks the sale, works for any type of temporality, works for forex markets and synthetic indices! ideal for any pair, it also works for crypto pairs, Good profit! World Investor - World Inversor - 
Renko Gold
Ignacio Agustin Mene Franco
Renko Gold! clearly indicates the floors and ceilings where it goes from 4 lines, the line below that marks the floor in green confirming with the thinnest line clarifies the purchase entry, the same is for sale, the top line marks the ceiling and the thinnest red line marks the sale, This indicator works for all temporalities! For Forex and Synthetic Indices markets! It also works for crypto markets! Good profit! World Investor.
How to use Pair Trading Station Pair Trading Station is recommended for H1 time frame and you can use it for any currency pairs. To generate buy and sell signal, follow few steps below to apply Pair Trading Station to your MetaTrader terminal. When you load Pair Trading Station on your chart, Pair Trading station will assess available historical data in your MetaTrader platforms for each currency pair. On your chart, the amount of historical data available will be displayed for each currency pai
Dies ist ein Trendfolgeindikator basierend auf MACD, der Kaufsignale liefert, wenn über dem 200 MA und Verkaufssignale, wenn darunter. Das Signal wird generiert, wenn der MACD die Nulllinie kreuzt. Der Indikator zeigt auch ein Support- und Resistance-Level an, das als Stop-Loss verwendet werden kann. Einstellbare Parameter umfassen MA-Periode, MACD Fast EMA, Slow EMA und das Support-Resistance-Intervall. Es wird auf den niedrigsten und höchsten Punkten der aktuellen Kerzen dargestellt. Standardm
FREE
Käufer dieses Produkts erwarben auch
Zunächst einmal ist es wichtig zu betonen, dass dieses Handelssystem ein Nicht-Repainting-, Nicht-Redrawing- und Nicht-Verzögerungsindikator ist, was es sowohl für manuelles als auch für automatisches Trading ideal macht. Das "Smart Trend Trading System MT5" ist eine umfassende Handelslösung, die für neue und erfahrene Trader maßgeschneidert ist. Es kombiniert über 10 Premium-Indikatoren und bietet mehr als 7 robuste Handelsstrategien, was es zu einer vielseitigen Wahl für verschiedene Marktbe
Atomic Analyst MT5
Issam Kassas
5 (11)
Zunächst einmal ist es erwähnenswert, dass dieser Handelsindikator nicht neu malt, nicht neu zeichnet und keine Verzögerung aufweist, was ihn sowohl für manuellen als auch für Roboterhandel ideal macht. Der Atom-Analyst ist ein PA-Preisaktionsindikator, der die Stärke und das Momentum des Preises nutzt, um einen besseren Vorteil auf dem Markt zu finden. Ausgestattet mit fortschrittlichen Filtern, die helfen, Rauschen und falsche Signale zu entfernen, und das Handelspotenzial zu erhöhen. Durch
Quantum Trend Sniper
Bogdan Ion Puscasu
5 (37)
Wir stellen vor       Quantum Trend Sniper Indicator   , der bahnbrechende MQL5-Indikator, der die Art und Weise, wie Sie Trendumkehrungen erkennen und handeln, verändert! Entwickelt von einem Team erfahrener Händler mit über 13 Jahren Handelserfahrung,       Quantum Trend Sniper-Indikator       wurde entwickelt, um Ihre Trading-Reise mit seiner innovativen Methode zur Identifizierung von Trendumkehrungen mit extrem hoher Genauigkeit auf ein neues Niveau zu heben. ***Kaufe Quantum Trend Snipe
FX Volume MT5
Daniel Stein
4.94 (17)
Erhalten Sie Ihr tägliches Marktupdate mit Details und Screenshots über unser Morning Briefing hier auf mql5 und auf Telegram ! FX Volume ist der ERSTE und EINZIGE Volumenindikator, der einen ECHTEN Einblick in die Marktstimmung aus Sicht eines Brokers bietet. Es bietet fantastische Einblicke in die Positionierung von institutionellen Marktteilnehmern, wie z.B. Brokern, auf dem Forex-Markt, viel schneller als COT-Berichte. Diese Informationen direkt auf Ihrem Chart zu sehen, ist der wahre Game
Trend Screener Pro MT5
STE S.S.COMPANY
4.89 (61)
Nutzen Sie die Macht des Trendhandels mit Trend Screener Indicator: Ihrer ultimativen Trendhandelslösung, die auf Fuzzy-Logik und einem System mit mehreren Währungen basiert! Steigern Sie Ihren Trendhandel mit Trend Screener, dem revolutionären Trendindikator mit Fuzzy-Logik. Es handelt sich um einen leistungsstarken Trendfolgeindikator, der über 13 Premium-Tools und -Funktionen sowie 3 Handelsstrategien kombiniert und ihn zu einer vielseitigen Wahl macht, um Ihren Metatrader in einen Trendanaly
FX Power MT5 NG
Daniel Stein
5 (4)
Erhalten Sie Ihr tägliches Marktupdate mit Details und Screenshots über unser Morning Briefing hier auf mql5 und auf Telegram ! FX Power MT5 NG ist die nächste Generation unseres langjährig sehr beliebten Währungsstärkemessers FX Power. Und was bietet dieser Stärkezähler der nächsten Generation? Alles, was Sie am ursprünglichen FX Power geliebt haben PLUS GOLD/XAU-Stärkeanalyse Noch präzisere Berechnungsergebnisse Individuell konfigurierbare Analysezeiträume Anpassbares Berechnungslimit für noc
Dies ist ein Indikator für MT5, der genaue Signale für den Einstieg in einen Handel ohne Repainting (Neuzeichnen) liefert. Er kann auf alle Finanzwerte angewendet werden: Forex, Kryptowährungen, Metalle, Aktien, Indizes. Er liefert ziemlich genaue Schätzungen und sagt Ihnen, wann es am besten ist, eine Position zu eröffnen und zu schließen. Sehen Sie sich das Video (6:22) mit einem Beispiel für die Verarbeitung nur eines Signals an, das sich für den Indikator gelohnt hat! Die meisten Händler ver
Zunächst einmal ist es wichtig zu betonen, dass dieses Handelstool ein Nicht-Repaint-, Nicht-Redraw- und Nicht-Verzögerungsindikator ist, was es ideal für professionelles Trading macht. Der Smart Price Action Concepts Indikator ist ein sehr leistungsstarkes Werkzeug sowohl für neue als auch erfahrene Händler. Er vereint mehr als 20 nützliche Indikatoren in einem und kombiniert fortgeschrittene Handelsideen wie die Analyse des Inner Circle Traders und Strategien des Smart Money Concepts. Diese
RelicusRoad Pro MT5
Relicus LLC
4.82 (22)
Jetzt 147 US -Dollar (nach ein paar Aktualisierungen auf 499 US -Dollar) - Unbegrenzte Konten (PCs oder MACs) RelicusRoad Benutzerhandbuch + Schulungsvideos + Zugang zur privaten Discord-Gruppe + VIP-Status EINE NEUE ART, DEN MARKT ZU BETRACHTEN RelicusRoad ist der weltweit leistungsstärkste Handelsindikator für Forex, Futures, Kryptowährungen, Aktien und Indizes und gibt Händlern alle Informationen und Tools, die sie benötigen, um profitabel zu bleiben. Wir bieten technische Analysen un
Auto Order Block with break of structure based on ICT and Smart Money Concepts Futures Break of Structure ( BoS )             Order block ( OB )            Higher time frame Order block / Point of Interest ( POI )    shown on current chart           Fair value Gap ( FVG ) / Imbalance   ,  MTF      ( Multi Time Frame )    Volume Imbalance     ,  MTF          vIMB Gap’s Equal High / Low’s     ,  MTF             EQH / EQL Liquidity               Current Day High / Low           HOD /
AW Trend Predictor MT5
AW Trading Software Limited
4.76 (55)
Die Kombination von Trend- und Aufschlüsselungsebenen in einem System. Ein fortschrittlicher Indikatoralgorithmus filtert Marktrauschen, bestimmt den Trend, Einstiegspunkte sowie mögliche Ausstiegsniveaus. Indikatorsignale werden in einem Statistikmodul aufgezeichnet, das es Ihnen ermöglicht, die am besten geeigneten Tools auszuwählen, die die Wirksamkeit der Signalhistorie zeigen. Der Indikator berechnet Take-Profit- und Stop-Loss-Marken. Handbuch und Anleitung ->   HIER   / MT4-Version ->   H
Blahtech Supply Demand MT5
Blahtech Limited
4.57 (14)
Was: $299  Now: $99   Supply Demand uses previous price action to identify potential imbalances between buyers and sellers. The key is to identify the better odds zones, not just the untouched ones. Blahtech Supply Demand indicator delivers functionality previously unavailable on any trading platform. This 4-in-1 indicator not only highlights the higher probability zones using a multi-criteria strength engine, but also combines it with multi-timeframe trend analysis, previously confirmed swings
ICT, SMC, SMART MONEY CONCEPTS, SMART MONEY, Smart Money Concept, Support and Resistance, Trend Analysis, Price Action, Market Structure, Order Blocks, BOS/CHoCH,   Breaker Blocks ,  Momentum Shift,   Supply&Demand Zone/Order Blocks , Strong Imbalance,   HH/LL/HL/LH,    Fair Value Gap, FVG,  Premium  &   Discount   Zones, Fibonacci Retracement, OTE, Buy Side Liquidity, Sell Side Liquidity, BSL/SSL Taken, Equal Highs & Lows, MTF Dashboard, Multiple Time Frame, BigBar, HTF OB, HTF Market Structure
Der Gann Square Indikator ist ein leistungsstolles Marktanalyse-Tool, das auf dem Artikel "Mathematische Formel für Marktvorhersagen" von W.D. Gann basiert. Dieses Tool verwendet mathematische Konzepte und Gann-Theorien für eine präzise Marktanalyse. Es beinhaltet Quadratwerte von 144, 90, 52 und auch das Quadrat von 9. Darüber hinaus integriert es die Methode von  zur Quadratwurzel von 9 und deren Beziehung zu Kanälen und dem Sternmuster. Benutzerhandbuch und Anwendung: Vor der Verwendung diese
TPSpro TRENDPRO  - is a trend indicator that automatically analyzes the market and provides information about the trend and each of its changes, as well as giving signals for entering trades without redrawing! The indicator uses each candle, analyzing them separately. referring to different impulses - up or down impulse. Exact entry points into transactions for currencies, crypto, metals, stocks, indices!  -  Version MT4                  DETAILED DESCRIPTION        /       TRADING SETUPS       
Advanced Supply Demand MT5
Bernhard Schweigert
4.53 (15)
Derzeit 33% Rabatt! Die beste Lösung für jeden Anfänger oder erfahrenen Händler! Dieser Indikator ist ein einzigartiges, qualitativ hochwertiges und erschwingliches Trading-Tool, da wir eine Reihe von proprietären Funktionen und eine neue Formel integriert haben. Mit diesem Update werden Sie in der Lage sein, doppelte Zeitrahmenzonen anzuzeigen. Sie können nicht nur einen höheren TF (Zeitrahmen) anzeigen, sondern sowohl den Chart-TF als auch den höheren TF: SHOWING NESTED ZONES. Alle Supply Dema
Zeichnen Sie automatisch Unterstützungs- und Widerstandsniveaus PLUS Antriebskerzenlücken auf Ihrem Chart ein, so dass Sie sehen können, wohin sich der Preis wahrscheinlich als Nächstes bewegen und/oder möglicherweise umkehren wird. Dieser Indikator wurde entwickelt, um als Teil der Positionshandelsmethodik verwendet zu werden, die auf meiner Website (The Market Structure Trader) gelehrt wird, und zeigt Schlüsselinformationen für die Zielsetzung und potenzielle Einstiege an. MT4 Version:  htt
A key element in trading is zones or levels from which decisions to buy or sell a trading instrument are made. Despite attempts by major players to conceal their presence in the market, they inevitably leave traces. Our task was to learn how to identify these traces and interpret them correctly. Reversal First Impulse levels (RFI)   -  Version MT4                  INSTRUCTIONS                 RUS                 ENG                         R ecommended to use with an indicator   -  TREND PRO  
Werden Sie Breaker Trader und profitieren Sie von Änderungen der Marktstruktur, wenn sich der Preis umkehrt. Der Order Block Breaker Indikator zeigt an, wann sich eine Trend- oder Preisbewegung der Erschöpfung nähert und bereit ist, sich umzukehren. Es weist Sie auf Änderungen in der Marktstruktur hin, die normalerweise auftreten, wenn eine Umkehrung oder ein größerer Rückzug bevorsteht. Der Indikator verwendet eine proprietäre Berechnung, die Ausbrüche und Preisdynamik identifiziert. Jedes
Wir stellen vor       Quantum Breakout PRO   , der bahnbrechende MQL5-Indikator, der die Art und Weise, wie Sie mit Breakout-Zonen handeln, verändert! Entwickelt von einem Team erfahrener Händler mit über 13 Jahren Handelserfahrung,       Quantum Breakout PRO       ist darauf ausgelegt, Ihre Handelsreise mit seiner innovativen und dynamischen Breakout-Zone-Strategie auf ein neues Niveau zu heben. Der Quantum Breakout Indicator zeigt Ihnen Signalpfeile auf Breakout-Zonen mit 5 Gewinnzielzone
TrendLine PRO MT5
Evgenii Aksenov
4.78 (49)
The Trend Line PRO indicator is an independent trading strategy. It shows the trend change, the entry point to the transaction, as well as automatically calculates three levels of Take Profit and Stop Loss protection Trend Line PRO is perfect for all Meta Trader symbols: currencies, metals, cryptocurrencies, stocks and indices Advantages of Trend Line PRO Never redraws its signals The possibility of using it as an independent strategy It has three automatic levels Take Profit and Stop Loss lev
XQ Indicator MetaTrader 5
Marzena Maria Szmit
5 (1)
Step into the realm of Forex trading with confidence and precision using XQ, a cutting-edge Forex indicator designed to elevate your trading game to unprecedented heights. Whether you're a seasoned trader or just stepping into the world of currency exchange, XQ Forex Indicator empowers you with the insights and signals needed to make informed trading decisions. The signal conditions are a combination of three indicators, and XQ Forex Indicator only display  medium and long-term trends . The ind
Trend Line Map Pro MT5
STE S.S.COMPANY
4.67 (9)
Trend Line Map Indicator ist ein Add-On für Trend Screener Indicator. Es arbeitet als Scanner für alle Signale, die vom Trendscreener (Trendliniensignale) erzeugt werden. Es ist ein Trend Line Scanner basierend auf dem Trend Screener Indicator. Wenn Sie keinen Trend Screener Pro Indicator haben, funktioniert die Trend Line Map Pro nicht. It's a Trend Line Scanner based on Trend Screener Indicator. If you don't have Trend Screener Pro Indicator,     the Trend Line Map Pro will not work .
TrendDecoder Premium MT5
Christophe, Pa Trouillas
5 (1)
Top bewertet auf anderem MarketPlace -  Jetzt verfügbar auf METATRADER Identifizieren Sie Bereiche und die nächsten wahrscheinlichen Bewegungen     |    Erhalten Sie früheste Signale und die Stärke von Trends     |    Klare Ausstiegssignale vor Umkehrung     |    Erkennen Sie die Fibo-Levels, die der Kurs testen wird    |  Indikator, der nicht zurückverfolgt, nicht verzögert - ideal für den manuellen und automatisierten Trading - geeignet für alle Vermögenswerte und Zeiteinheiten - 50% Rabatt  
MetaBands M5
Vahidreza Heidar Gholami
4.67 (3)
MetaBands verwendet leistungsstarke und einzigartige Algorithmen, um Kanäle zu zeichnen und Trends zu erkennen, sodass es Tradern potenzielle Punkte für den Einstieg und Ausstieg aus Trades bieten kann. Es ist ein Kanalindikator sowie ein leistungsstarker Trendindikator. Es umfasst verschiedene Arten von Kanälen, die einfach durch Verwendung der Eingabeparameter zusammengeführt werden können. MetaBands verwendet alle Arten von Warnmeldungen, um Benutzer über Marktereignisse zu informieren. Funkt
Was: $249  Now: $99   Market Profile defines a number of day types that can help the trader to determine market behaviour. A key feature is the Value Area, representing the range of price action where 70% of trading took place. Understanding the Value Area can give traders valuable insight into market direction and establish the higher odds trade. It is an excellent addition to any system you may be using. Inspired by Jim Dalton’s book “Mind Over Markets”, this indicator is designed to suit the
Malaysian SNR Levels
Matthias Horst Pieroth
This indicator can be used to display Support and Resistance levels according to  the  Malaysian SNR concept , in which Support and Resistance are exact levels of a line chart. Malaysian SNR There are 3 different horizontal levels in Malaysian SNR: A-Level : This level is located at the peak of this line chart. (shape looks like the letter A) V-Level : Level at the valley of a line chart, (shape looks like the letter V) Gap-Leve l: This level is located at the Close/Open gap between two cand
The Volume by Price Indicator for MetaTrader 5 features Volume Profile and Market Profile TPO (Time Price Opportunity). Get valuable insights out of currencies, equities and commodities data. Gain an edge trading financial markets. Volume and TPO histogram bar and line charts. Volume Footprint charts. TPO letter and block marker charts including split structures. Versatile segmentation and compositing methods. Static, dynamic and flexible ranges with relative and/or absolute visualizations. Lay
ICT Silver Bullet MT5
Haidar, Lionel Haj Ali
5 (19)
ICT Silver Bullet If you are searching for a reliable indicator to trade the ICT Silver Bullet concept, or ICT concepts, Smart Money Concepts, or SMC, this indicator will respond to your need!  Before version 2.2, this indicator was focused only on ICT Silver Bullet, but moving forward, we will include the different elements for smart money concept trading. This indicator will help you identify the following: FVG - fair value gaps Market structure: BOS and CHOCH. It is based on ZIGZAG as it is
Account Graph MT5
Kyra Nickaline Watson-gordon
5 (1)
An indicator to draw a graph of account current and historical state such as Balance, Equity, Margin, Free Margin, Margin Level, Drawdown, Account Profit, Deposit and Withdrawals. Indicator Inputs : Draw Balance Graph Draw Equity Graph Draw Margin Graph Draw Free Margin Graph Draw Margin Level Graph Draw Drawdown Graph Draw Account Profit Graph Hide Data on Chart and Buffers Connect Gaps by Lines Sign of DDs on Profit Sign of DDs on Loss Tips : The Indicator will draw historical balance gra
Weitere Produkte dieses Autors
Smart Peak Bottom
Xiaoyu Huang
5 (2)
Dies ist ein klarer Indikator für die Beurteilung von Hochs und Tiefs und funktioniert gut für den oszillierenden Markt. Aktionspreis 49 $ → 59 $ Merkmale gut im Einschätzen von Ober- und Unterteilen Kein Neuzeichnen, kein Driften Schnelle Berechnung, keine Verzögerung Reichhaltiger Erinnerungsmodus Mehrere Parameter und Farben können angepasst werden Parameter "======== Haupt ========" HighLowPeriod1 = 9 HighLowPeriod2 = 60 HighLowPeriod3 = 34 HighLowEMAPeriod = 4 MASignalPeriode = 5 "==
PeakBottom EA
Xiaoyu Huang
4.2 (5)
Dies ist ein langfristig stabiler, profitabler Handels-EA mit geringem Risiko. Es verwendet traditionelle technische Indikatoren für adaptive EA. Wir sehen, dass es viele EAs auf dem Markt gibt, die KI zur Überanpassung nutzen. Der Test sieht gut aus, das echte Angebot jedoch nicht. Verlust; Die andere besteht darin, Martin zu verwenden. Die Kapitalkurve ist für einen bestimmten Zeitraum nach oben gerichtet, aber es ist immer unvermeidlich, dem Schicksal der Liquidation zu entgehen. Das ist nic
King of Dragon-Kanal, King of Dragon-Indikator, King of Dragon-System, King of Dragon MT5, King of Dragon-Klassiker-Indikator, King of Dragon-Wischsystem, König der Drachen in einem Das Channel-Handelssystem King of Dragon, ein klassisches Channel-Trading-System, wird von vielen Benutzern dringend nach der MT5-Version verlangt. Dieses Programm wurde in mehreren Versionen auf Leistung optimiert und ist bereits ein relativ reibungsloses System. 49$ → 59$ Roter Bereich, langer Trend, nur lang, n
Einführung Dies ist ein EA für den Nachthandel, der zwischen 21:00 und 22:00 Uhr gehandelt wird Langfristiger Live-Handel ist profitabel Handeln Sie nur eine Order gleichzeitig und verursachen Sie keinen großen Verlust Jede Order wird mit Stop-Loss und Take-Profit festgelegt, es wird kein Grid, Martin oder andere risikoreiche Fondsverwaltung verwendet Mehrere Währungen können gleichzeitig gehandelt werden Zeitzone standardmäßig automatisch einstellen Charakteristisch Handelschart
EEVCC Hedge Aktionspreis: $59 Aktivierung: 10 Einführung Dies ist ein bidirektionaler (gleichzeitiger Kauf und Verkauf) Grid Hedge Trading EA Langfristige Firmenangebote sind profitabel Kann in mehreren Währungen gleichzeitig verwendet werden Sichere Gewinnberechnungsmethode charakteristisch Handelschart: H1 Empfohlene Währung: EURGBP, EURUSD Mindesteinzahlung: 3000 USD, empfohlen 10000 USD, 100 USD für Cent-Konten Empfohlene Broker: RofoForex, Exness und andere Plattformen mit hohem Leverage
Quick View
Xiaoyu Huang
1 Tag Aktionspreis: $49 Aktivierung: 30 10 Tage Aktionspreis: $59 Aktivierung: 20 Einführung Schnellansicht Überprüfen Sie schnell die Rentabilität für einen bestimmten Zeitraum und zeigen Sie die Statistiken an Filtern Sie schnell historische Transaktionen und erstellen Sie Statistiken basierend auf Zeit, magischer Zahl, Währung und Kommentaren Die Statistiken umfassen Nettogewinn, LotTotal, Gewinnfaktor, Short Trades (Gewinn %), Long Trades (Gewinn %), Average Profit Trade usw. Aktu
Einführung Dies ist ein Indikator für die tägliche Rentabilität Charakteristisch Statistiken können auf Währung, magischer Zahl und Notizen basieren Statistiken können auf Zeit basieren Verfügbar für alle Währungen, alle Zeiträume Es gibt weiße und schwarze Themen Sortierung umkehren Die Bildwiederholrate kann angepasst werden Sie können die Aktualisierungszeit auf den neuesten Stand setzen Parameter nD                          = 30;                               // Anzahl der Tage Startzeit 
SemiAuto Martin-System vorstellen Dieses Tool wird für den halbautomatischen Martin-Handel verwendet. Klicken Sie auf das Panel, um eine Order zu platzieren, und der EA verwaltet die Position Bestimme einfach die Richtung der Transaktion und überlasse den Rest dem EA-Management Automatischer Martin, Lager entsprechend dem eingestellten Raster hinzufügen, Sie können diese Funktion auch deaktivieren Liquidation mit einem Klick Ein-Tasten-Sperrfunktion Zeitkontrolle Warntonaufforderung chara
vorstellen Dies ist ein Handelsassistent, Informationstafelindikatoren, aggregierte Währungsstatistiken, Kontostatistiken, Positionsinformationen, Server- und Ortszeit, Währungsstärke, verbleibende K-Linien-Zeit, Unterstützungs- und Widerstandslinien, Serverzeit-Offset, Währungsschwankungen, Kurs und andere Funktionen. Kann für alle Arten von Konten und Währungen verwendet werden. Hervorragende Leistung, sehr wenige Ressourcen Sie können die Position, Farbe und Schriftgröße anpassen Jedes Modul
CZSC Fraktaltyp-Index Merkmale: Durchführung einer gründlichen Aufarbeitung des Inklusionsverhältnisses Es ist bequem, den EA-Aufruf zu verwenden, um zu beurteilen, ob es sich um eine Top-Bottom-Klassifizierung handelt, und den Status in "Teaching You to Stock 93: The Relationship between the Two Tables and the Inside of the Trend Structure 2" Oben-Unten-Klassifizierung mit Pfeilen anzeigen Mögliche Stifte in verschiedenen Farben anzeigen Die Inklusionsbeziehung zweier benachbarter
Diese Bibliothek wird zum Sortieren von Schlüssel- und Wertarrays verwendet, wir müssen oft Werte sortieren. wie in der Python-Sprache sorted(key_value.items(), key = lambda kv:(kv[ 1 ], kv[ 0 ])) Importfunktion Beispiel für Nutzungsszenarien 1. Grid EA Orders werden nach dem Eröffnungspreis sortiert void SortedByOpenPride()   {    long     OrderTicketBuffer[];    double   OpenPriceBuffer[];    for ( int i = PositionsTotal ()- 1 ; i>= 0 ; i--)      {        if (m_position.SelectByIndex(
Gold Digger AI
Xiaoyu Huang
4.8 (5)
Dies ist ein langfristig stabiler und profitabler EA für den Goldhandel, der traditionelle technische Indikatoren verwendet und KI für einen adaptiven EA nutzt. Neuer EA-Aktionspreis: 199 $   →   $ 249 Charakteristisch eine Bestellung nach der anderen fester Stop-Loss adaptiv Nachthandel Schlupf optimieren Nachrichtenfilter Geeignet zum Bestehen von FTMO, DARWINEX Zero Kann mit anderen EAs verwendet werden Objektorientierte Programmierung, das Programm-Framework wurde 5 Jahre lang getestet Sign
Dieser Indikator kombiniert die klassischen MACD- und Zigzag-Indikatoren, um Abweichungen zwischen Preis und Indikatoren zu erkennen. Es nutzt außerdem fortschrittliche Technologie der künstlichen Intelligenz (KI), um die Gültigkeit von Divergenzen zu erkennen. MACD ist als „König der Indikatoren“ bekannt, und Zigzag ist ebenfalls ein sehr nützlicher Indikator. Durch die Kombination dieser beiden Indikatoren nutzt dieser Indikator die Stärken beider. Die Erkennung von Divergenzen ist ein pr
Auswahl:
Keine Bewertungen
Antwort auf eine Rezension