• Übersicht
  • Bewertungen (9)
  • Diskussion (21)
  • Neue Funktionen

VolumeProfile MT5

3.75

Beschreibung:

Das Volumen Profil zeigt detailierte Informationen von historischen trading Aktivitäten in bestimmten Preisbereichen (Markt Profil/Preis Profil). 

Damit finden Sie die Zonen mit den besten Preisen im Markt und erlangen so einen entscheidenen Vorteil gegenüber anderen Marktteilnehmern.


Support:

Der Indikator wird stetig weiterentwickelt und verbessert (siehe "Versionen").

Ich bin sehr dankbar für jeden Bericht von aufgetretenen Fehlern, sodass ich den Indikator verbessern kann.

Bitte gerne auch öffentlich bewerten!


Features:

  • Anpassbares Volume Profil / Markt Profil
  • Zeigt den "fairen" Preisbereich in dem 70% des gesamten Volumens umgesetzt werden
  • Zeigt kritische Zonen mit niedrigem Volumen
  • Zeigt Volume Point of Control (VPOC), Value Area High (VAH) und Value Area Low (VAL) Punkte
  • integriertes Ressourcenmanagement um die Last bei mehreren Charts zu reduzieren
  • Funktioniert auf allen Zeitebenen
  • Automatische Berechnung ihres definierten Zeitraumes für alle Zeitrahmen
  • Drag & Drop Funktion für eine live Berechnung des VolumeProfile
  • Auch für den Metatrader 4 verfügbar
  • Abschnitt-POCs (Anzeige eines Point Of Controls & VAH/VAL Linien für jede Periodentrennung)

Einstellungen:

Bitte die Einstellungen der Englischen Seite entnehmen (Sprache kann in der oberen rechten Ecke geändert werden). 

Bewertungen 9
Douglas De Souza Goncalves
126
Douglas De Souza Goncalves 2023.11.29 22:55 
 

I migrate to another account with the same broker but the indicator doesn't work... do I need to do some activation or something like that for the indicator to work again? thank you very much

Jan Patzig
36
Jan Patzig 2023.08.09 15:42 
 

Supaaaaa...

00023867
114
00023867 2022.02.09 16:20 
 

a very good indicator

Empfohlene Produkte
BoxChart MT5
Evgeny Shevtsov
5 (6)
The market is unfair if only because 10% of participants manage 90% of funds. An ordinary trader has slim changes to stand against these "vultures". This problem can be solved. You just need to be among these 10%, learn to predict their intentions and move with them. Volume is the only preemptive factor that faultlessly works on any timeframe and symbol. First, the volume appears and is accumulated, and only then the price moves. The price moves from one volume to another. Areas of volume accumu
33 USD
This indicator allows you to enjoy the two most popular products for analyzing request volumes and market deals at a favorable price: Actual Depth of Market Chart Actual Tick Footprint Volume Chart This product combines the power of both indicators and is provided as a single file. The functionality of Actual COMBO Depth of Market AND Tick Volume Chart is fully identical to the original indicators. You will enjoy the power of these two products combined into the single super-indicator! Below is
40 USD
Blahtech Supply Demand MT5
Blahtech Limited
4.57 (14)
Was: $299  Now: $99   Supply Demand uses previous price action to identify potential imbalances between buyers and sellers. The key is to identify the better odds zones, not just the untouched ones. Blahtech Supply Demand indicator delivers functionality previously unavailable on any trading platform. This 4-in-1 indicator not only highlights the higher probability zones using a multi-criteria strength engine, but also combines it with multi-timeframe trend analysis, previously confirmed swings
99 USD
Before installing the HeatMap indicator make sure you are using a broker that gives you access to the Depth of market (DOM) !! This indicator creates a heatmap on your chart allowing you to see the buy or sell limit orders easily and in real time. You have the possibility to change the setting and the colors of the HeatMap in order to adapt to all markets and all charts. Here is an example of a setting you can use with the NASDAQ100 on the AMPGlobal broker :  https://www.youtube.com/watch?v=x0
80 USD
The Volume by Price Indicator for MetaTrader 5 features Volume Profile and Market Profile TPO (Time Price Opportunity). Get valuable insights out of currencies, equities and commodities data. Gain an edge trading financial markets. Volume and TPO histogram bar and line charts. Volume Footprint charts. TPO letter and block marker charts including split structures. Positioning and styling options to suit the user's needs and context. Highlight Volume Profile and Market Profile TPO Point of Contro
259 USD
Was: $249  Now: $99   Market Profile defines a number of day types that can help the trader to determine market behaviour. A key feature is the Value Area, representing the range of price action where 70% of trading took place. Understanding the Value Area can give traders valuable insight into market direction and establish the higher odds trade. It is an excellent addition to any system you may be using. Blahtech Limited presents their Market Profile indicator for the MetaTrader community. Ins
99 USD
Der Indikator erstellt aktuelle Notierungen, die mit historischen verglichen werden können, und auf dieser Grundlage eine Preisbewegungsprognose erstellen. Der Indikator verfügt über ein Textfeld zur schnellen Navigation zum gewünschten Datum. Optionen: Symbol - Auswahl des Symbols, das der Indikator anzeigen soll; SymbolPeriod - Auswahl des Zeitraums, aus dem der Indikator Daten aufnimmt; IndicatorColor - Indikatorfarbe; HorisontalShift - Verschiebung der vom Indikator gezeichnet
55 USD
Die Einzigartigkeit dieses Indikators liegt im Volumenabrechnungsalgorithmus: Die Akkumulation erfolgt direkt für den ausgewählten Zeitraum ohne Bezug auf den Tagesbeginn. Die letzten Balken können aus der Berechnung ausgeschlossen werden, dann haben die aktuellen Daten weniger Einfluss auf die vorher gebildeten signifikanten Niveaus (Volumina). Für eine genauere Berechnung werden standardmäßig Daten aus dem M1-Diagramm verwendet. Der Verteilungsschritt der Preismengen ist geregelt. Standardmäßi
35 USD
Der Indikator berechnet und zeichnet automatisch Fibonacci-Unterstützungs- und Widerstandsniveaus - eines der effektivsten Werkzeuge für die Marktanalyse. Die Berechnung verwendet die gemittelten Preisdaten für den ausgewählten Zeitraum und Zeitraum. Das Minimum und das Maximum für diesen Zeitraum gelten als Beginn und Ende der Bewegung. Fibonacci-Niveaus ermöglichen es Ihnen, potenzielle Referenzpunkte zu erkennen, um die sich die Preisbewegung verlangsamen oder umkehren kann, dh sie werden ver
30 USD
Market profile was developed by Peter Steidlmayer in the second half of last century. This is a very effective tool if you understand the nature and usage. It's not like common tools like EMA, RSI, MACD or Bollinger Bands. It operates independently of price, not based on price but its core is volume. The volume is normal, as the instrument is sung everywhere. But the special thing here is that the Market Profile represents the volume at each price level. 1. Price Histogram The Price Histogram
50 USD
Predictor PRO MT5
Evgenii Aksenov
5 (1)
A new generation progressive indicator from INFINITY. Predictor PRO uses its own entry and exit calculation strategy. Indicator without redrawing signals! This is very important for real trading. The indicator can be used for any currency pairs, metals, cryptocurrencies or indices. The best time of the H1 chart. Unlike other indicators, Predictor PRO shows shows the Buy/Sell entry point and the Close exit point. Calculating the profit of all signals in points on the panel helps to choose th
49 USD
Strong Support mt5
Vasiliy Strukov
5 (9)
Unterstützungs- und Widerstandsniveaus sind seit langem ein mächtiges Werkzeug für die Marktanalyse. Der Strong Support Indikator baut Unterstützungsniveaus auf lokalen Preistiefs und Widerstandsniveaus auf lokalen Preishochs auf. Meine anderen Entwicklungen finden Sie hier Es wird empfohlen, in Verbindung mit einem Trendindikator wie Gold Stuff zu verwenden, um den Trend zu handeln und gleichzeitig Konsolidierungs- oder Umkehrzonen zu definieren sowie Stop-Loss und Take-Profit auf Unterstü
50 USD
ClusterSecond
Rafil Nurmukhametov
4.77 (31)
The utility allows you to build different types of graphs: Seconds chart from 1 second to 86400 seconds Tick chart from 1 tick and above The volume chart Delta chart Renko chart Range chart Demo version of the utility https://www.mql5.com/ru/channels/clustersecond Built-in indicators for volumetric analysis: daily market profile and market profile of the selected timeframe, Cluster Search Imbalance VWAP Dynamic POC, VAH, VAL the profile depth of the market vertical volume with various display op
275 USD
Wapv Price and volume
Eduardo Da Costa Custodio Santos
Der WAPV Price and Volume Indicator for MT5 ist Teil des Toolsets (Wyckoff Academy Wave Market) und (Wyckoff Academy Price and Volume). Der WAPV-Preis- und Volumenindikator für MT5 wurde entwickelt, um die Volumenbewegung auf dem Chart auf intuitive Weise einfach zu visualisieren. Damit können Sie die Momente des Spitzenvolumens und Momente beobachten, in denen der Markt kein professionelles Interesse hat Identifizieren Sie Momente, in denen sich der Markt durch Trägheit bewegt und nicht durch d
40 USD
Order Book, known also as Market Book, market depth, Level 2, - is a dynamically updated table with current volumes of orders to buy and to sell specific financial instument at price levels near Bid and Ask. MetaTrader 5 provides the means for receiving market book from your broker, but in real time only, without access to its history. The indicator OrderBook Cumulative Indicator accumulates market book data online and visualizes them on the chart. In addition, the indicator can show the market
49 USD
BoxInside MT5
Evgeny Shevtsov
5 (4)
This indicator calculates the volume profile and places labels that correspond to the VAH, VAL and POC levels, for each candle individually. Indicator operation features The indicator works on the timeframes from M3 to MN, but it uses the history data of smaller periods: M1 - for periods from M3 to H1, M5 - for periods from H2 to H12, M30 - for the D1 period, H4 - for the W1 period, D1 - for the MN period. The color and location of the VAL, VAH and POC labels on the current candle are consider
FREE
VWAP Daily
Anton Polkovnikov
Weighted average price indicator or VWAP. The well-known standard VWAP with the beginning of the day is added with the function of selecting the periodization. It can be calculated both every day and on other periods. Also the indicator allows to exclude the volume from the calculation, which will allow using it on the cryptocurrencies and forex. There is an alert for a VWAP price crossing. There are 1 and 2 standard deviation. Settings: Volume: turning volume on and off in the calculation mecha
50 USD
Dieser indikator zeigt eine kerze kombination basierend auf dodge, dodge und pin bar. Die Logik des Musters besteht darin, nach der Unsicherheit auf der Seite der Macht zu sein. Der Indikator ist universell und nützlich für den Handel mit binären Optionen, Forex, ETF, Kryptowährung, Aktien. Der Indikator unterstützt Zeitrahmen von M5 bis MN einschließlich Nicht-Standard-TF in MT5 vorgestellt.(M5,M6,M10,M12, M15, M20, M30, H1, H2, H3, H4, H6, H8, H12, D1, W1, MN). Realisiert die Möglichkeit, akti
450 USD
Cumulative delta indicator As most traders believe, the price moves under the pressure of market buying or selling. When someone redeems an offer standing in the cup, the deal is a "buy". If someone pours into the bid standing in the cup - the deal goes with the direction of "sale". The delta is the difference between purchases and sales. A cumulative delta - the difference between the cumulative sum of purchases and sales for a certain period of time. It allows you to see who is currently contr
50 USD
The professional tool of stock traders in now available on MetaTrader 5 . The Actual depth of market chart indicator visualizes the depth of market in the form of a histogram displayed on a chart, which refreshes in the real-time mode. Meet new updates according to user requests! Now Actual Depth of Market indicator displays the current ratio of volume of buy and sell requests (B/S ratio). It shows the share of volume of each type of requests in the entire flow of requests as well as the absol
30 USD
Premium-Level ist ein einzigartiger Indikator mit mehr als 80% Genauigkeit der richtigen Vorhersagen! Dieser Indikator wurde von den besten Trading-Spezialisten seit mehr als zwei Monaten getestet! Den Indikator des Autors finden Sie nirgendwo anders! Anhand der Screenshots können Sie sich von der Genauigkeit dieses Tools überzeugen! 1 ist ideal für den Handel mit binären Optionen mit einer Ablaufzeit von 1 Kerze. 2 funktioniert bei allen Währungspaaren, Aktien, Rohstoffen, Kryptowähr
1 100 USD
Simple ATR modern
Pavel Bereznichenko
Indicator  Simple ATR  Modern It is used in technical analysis to measure market volatility and show it as a level that is more understandable to the eye and not as an oscillator. ATR Daily - Blue The possibilities of using the ATR in trade can be found in the internet. It can also be used in conjunction with another author's indicator  Volatility Vision The Average True Range indicator measures market volatility. Volatility can be low while the market is growing (and vice versa). It is
30 USD
Mine Farm
Maryna Kauzova
5 (1)
Mine Farm is one of the most classic and time-tested scalping strategies based on the breakdown of strong price levels. Mine Farm is the author's modification of the system for determining entry and exit points into the market... Mine Farm - is the combination of great potential with reliability and safety. Why Mine Farm?! - each order has a short dynamic Stop Loss - the advisor does not use any risky methods (averaging, martingale, grid, locking, etc.) - the advisor tries to get
99 USD
PZ Trend Trading MT5
PZ TRADING SLU
3.67 (3)
Trend Trading ist ein Indikator, der so weit wie möglich von den Markttrends profitiert, indem er Pullbacks und Breakouts zeitlich festlegt. Sie findet Handelsmöglichkeiten, indem sie analysiert, was der Preis während etablierter Trends tut. [ Installationsanleitung | Update-Anleitung | Fehlerbehebung | FAQ | Alle Produkte ] Handeln Sie mit Zuversicht und Effizienz an den Finanzmärkten Profitieren Sie von etablierten Trends, ohne ins Wanken zu geraten Profitable Pullbacks, Ausbrüche und vor
249 USD
This is a multi-symbol and multi-timeframe table-based indicator designed for a candlestick patterns detection with 46 patterns for META TRADER 5. Each formation has own image for easier recognition. Here you find most popular formations such as "Engulfing", "Hammer", "Three Line Strike", "Piercing" or Doji - like candles. Check my full list of patterns on my screenshots below. Also you can not only switch all bearish or bullish patterns from input, but also select formation for a specified symb
30 USD
Mean Reversion Supply Demand Indicator Mean Reversion Supply Demand is the indicator to detect the important supply demand zone in your chart. The concept of supply demand trading relies on the quantity mismatching between buying and selling volumes in the financial market. Typically, supply demand zone serves to predict the turning point. The wave pattern, for any supply demand zone to work as an successful trade, looks like the price must touch the base zone, move away and then return to zone
80 USD
A "Volume Profile" is an advanced charting indicator that displays total volume traded at every price level over a user specified time period. The main components of the volume profile are POC ( Point Of Control - the price level, at which the maximum number of contracts were executed during a selected period), VAH ( Value Area High - the highest price in the Value Area) and VAL ( Value Area Low - the lowest price in the Value Area). When we settled on the original indicator, we spent a lot o
150 USD
Value Chart Candlesticks
Flavio Javier Jarabeck
4.83 (6)
The idea of a Value Chart indicator was presented in the very good book I read back in 2020 , " Dynamic Trading Indicators: Winning with Value Charts and Price Action Profile ", from the authors Mark Helweg and David Stendahl. The idea is simple and the result is pure genius: Present candlestick Price analysis in a detrended way! HOW TO READ THIS INDICATOR Look for Overbought and Oversold levels. Of course, you will need to test the settings a lot to find the "correct" one for your approach.
FREE
Dieser Indikator zeigt gefilterte Preisinformationen an in Form von drei farbigen Histogrammen und einer gemeinsamen farbigen Linie. Dies ist ein sehr farbenfroher und schöner Indikator. Hervorragend geeignet, um die Stärke und Richtung der Preisbewegung zu bestimmen. Dieser Indikator hat sehr einfache Einstellungen: 1) Auswahl von drei Optionen zur Berechnung des Indikators: - ursprünglich, - Entmarkierer, - Ausgleichsvolumen. 2) Auswahl von fünf verschiedenen Perioden. 3) Auswahl der angezeig
30 USD
Best SAR MT5
Ashkan Hazegh Nikrou
5 (1)
Beschreibung :  Wir freuen uns, Ihnen unseren neuen kostenlosen Indikator vorzustellen, der auf einem der professionellen und beliebten Indikatoren auf dem Devisenmarkt (Parabolic SAR) basiert. Dieser Indikator ist eine neue Modifikation des ursprünglichen Parabolic SAR-Indikators. Diese Überkreuzung ist kein Signal, sondern spricht über das Potenzial für das Ende der Bewegung. Sie können mit dem Kauf bei einem neuen blauen Punkt beginnen und einen Stop-Loss ein Atr vor dem ersten blauen Punk
FREE
Käufer dieses Produkts erwarben auch
Jetzt 147 US -Dollar (nach ein paar Aktualisierungen auf 499 US -Dollar) - Unbegrenzte Konten (PCs oder MACs) RelicusRoad Benutzerhandbuch + Schulungsvideos + Zugang zur privaten Discord-Gruppe + VIP-Status EINE NEUE ART, DEN MARKT ZU BETRACHTEN RelicusRoad ist der weltweit leistungsstärkste Handelsindikator für Forex, Futures, Kryptowährungen, Aktien und Indizes und gibt Händlern alle Informationen und Tools, die sie benötigen, um profitabel zu bleiben. Wir bieten technische Analysen un
147 USD
FX Volume MT5
Daniel Stein
4.93 (14)
Erhalten Sie Ihr tägliches Marktupdate mit Details und Screenshots über unser Morning Briefing hier auf mql5 und auf Telegram ! FX Volume ist der ERSTE und EINZIGE Volumenindikator, der einen ECHTEN Einblick in die Marktstimmung aus Sicht eines Brokers bietet. Es bietet fantastische Einblicke in die Positionierung von institutionellen Marktteilnehmern, wie z.B. Brokern, auf dem Forex-Markt, viel schneller als COT-Berichte. Diese Informationen direkt auf Ihrem Chart zu sehen, ist der wahre Game
249 USD
FX Power MT5 NG
Daniel Stein
5 (2)
Erhalten Sie Ihr tägliches Marktupdate mit Details und Screenshots über unser Morning Briefing hier auf mql5 und auf Telegram ! FX Power MT5 NG ist die nächste Generation unseres langjährig sehr beliebten Währungsstärkemessers FX Power. Und was bietet dieser Stärkezähler der nächsten Generation? Alles, was Sie am ursprünglichen FX Power geliebt haben PLUS GOLD/XAU-Stärkeanalyse Noch präzisere Berechnungsergebnisse Individuell konfigurierbare Analysezeiträume Anpassbares Berechnungslimit für noc
169 USD
ICT, SMC, Smart Money Concept, Support and Resistance, Trend Analysis, Price Action, Market Structure, Order Blocks, Breaker Blocks, Momentum Shift, Strong Imbalance, HH/LL/HL/LH, Fair Value Gap, FVG, Premium & Discount Zones, Fibonacci Retracement, OTE, Buyside Liquidity, Sellside Liquidity, Liquidity Voids, Market Sessions, NDOG, NWOG,Silver Bullet,ict template Auf dem Finanzmarkt ist eine genaue Marktanalyse für Investoren von entscheidender Bedeutung. Um Investoren dabei zu helfen, Marktt
149 USD
Dies ist wahrscheinlich der vollständigste Indikator für die automatische Erkennung der harmonischen Preisbildung, den Sie für die MetaTrader-Plattform finden können. Es erkennt 19 verschiedene Muster, nimmt Fibonacci-Projektionen genauso ernst wie Sie, zeigt die potenzielle Umkehrzone (PRZ) an und findet geeignete Stop-Loss- und Take-Profit-Werte. [ Installationsanleitung | Update-Anleitung | Fehlerbehebung | FAQ | Alle Produkte ] Es erkennt 19 verschiedene harmonische Preisbildungen Dar
299 USD
TrendMaestro5
Stefano Frisetti
note: this indicator is for METATRADER4, if you want the version for METATRADER5 this is the link:  https://www.mql5.com/it/market/product/108106 TRENDMAESTRO recognizes a new TREND in the bud, he never makes mistakes. The certainty of identifying a new TREND is priceless. DESCRIPTION TRENDMAESTRO identifies a new TREND in the bud, this indicator examines the volatility, volumes and momentum to identify the moment in which there is an explosion of one or more of these data and therefore the mome
397 USD
Der Forex TPA Indikator deckt die wahren Aktionen der Marktmacher auf, immer dann wenn sie passieren. "Kämpfe nicht gegen die Marktmacher an, sondern folge ihnen", ist wohl der beste Rat, den ein Trader bekommen kann. Der TPA Indikator zeigt jedesmal seine Signale an wenn die Bullen definitiv stärker sind als die Bären und umgekehrt. Dieser Indikator wurde VON Tradern FÜR Trader gemacht und ist 100% NICHT NACHZEICHNEND! Signale werden STRENG am Schluss einer Kerze  generiert. Das sagen unsere Ku
168 USD
Advanced Supply Demand MT5
Bernhard Schweigert
4.46 (13)
Derzeit 33% Rabatt! Die beste Lösung für jeden Anfänger oder erfahrenen Händler! Dieser Indikator ist ein einzigartiges, qualitativ hochwertiges und erschwingliches Trading-Tool, da wir eine Reihe von proprietären Funktionen und eine neue Formel integriert haben. Mit diesem Update werden Sie in der Lage sein, doppelte Zeitrahmenzonen anzuzeigen. Sie können nicht nur einen höheren TF (Zeitrahmen) anzeigen, sondern sowohl den Chart-TF als auch den höheren TF: SHOWING NESTED ZONES. Alle Supply Dema
199 USD
MTF Supply Demand Zones MT5
Georgios Kalomoiropoulos
5 (1)
Automatisierte Angebots- und Nachfragezonen der nächsten Generation. Neuer und innovativer Algorithmus, der bei jedem Diagramm funktioniert. Alle Zonen werden dynamisch entsprechend der Preisbewegung des Marktes erstellt. ZWEI ARTEN VON WARNUNGEN --> 1) WENN DER PREIS EINE ZONE ERREICHT 2) WENN EINE NEUE ZONE BILDET WIRD Sie erhalten keinen weiteren nutzlosen Indikator. Sie erhalten eine vollständige Handelsstrategie mit nachgewiesenen Ergebnissen.     Neue Eigenschaften:    
149 USD
Golden Spikes Detector
Batsirayi L Marango
5 (1)
Golden Spikes Detector This indicator is based on an advanced strategy primarily for trading spikes on Boom and Crash Indices. Complex algorithms were implanted to detect high probability entries only. It alerts on potential Buy and Sell entries. To trade spikes on the Deriv or Binary broker, only take Buy Boom and Sell Cash alerts. It was optimised for 5-minute timeframe. Features ·          Sends push notifications to mobile phone ·          Pop up and sound alerts on computer or laptop ·     
150 USD
Der MultiChart-Indikator überträgt Liniendiagramme von einem bis drei ausgewählten anderen Währungspaaren auf das Diagramm des Hauptwährungspaars und überträgt außerdem die Werte der RSI-Indikatoren auf den RSI-Indikator des Hauptwährungspaars. Der Chart des Hauptwährungspaares kann als Linie oder Kerze dargestellt werden. Mit dem MultiChart-Indikator können Sie gleichzeitig die Bewegung von bis zu 4 Währungspaaren überwachen, Abweichungen vom RSI, SMT-Abweichungen sowie Abweichungen der RSIs se
199 USD
Sind Sie es leid, Unterstützungs- und Widerstandslinien zu zeichnen? Der Unterstützungswiderstand ist ein Multi-Zeitrahmen-Indikator, der Unterstützungs- und Widerstandslinien mit einer sehr interessanten Wendung automatisch erkennt und zeichnet: Wenn das Preisniveau im Laufe der Zeit getestet wird und seine Bedeutung zunimmt, werden die Linien dicker und dunkler. [ Installationsanleitung | Update-Anleitung | Fehlerbehebung | FAQ | Alle Produkte ] Steigern Sie Ihre technische Analyse über Nacht
149 USD
Elliot Waves Analyzer Pro
Viktor Weidenthal
3.25 (4)
Elliot Waves Analyzer Pro calculates Elliot Waves to Help Identify Trend direction and Entry Levels. Mainly for Swing Trading Strategies. Usually one would open a Position in trend direction for Wave 3 or a Correction for Wave C . This Indicator draws Target Levels for the current and next wave. Most important Rules for Elliot Wave Analysis are verified by the Indicator.  The Pro version analyzes Multiple Timeframes and shows the Subwaves and Target-Levels.   For an Overview  " Elliot Waves Anal
220 USD
PZ Day Trading MT5
PZ TRADING SLU
2.83 (6)
Dieser Indikator erkennt Preisumkehrungen im Zick-Zack, wobei nur Preisaktionsanalysen und ein Donchian-Kanal verwendet werden. Es wurde speziell für den kurzfristigen Handel entwickelt, ohne dass ein Nachlackieren oder ein Backpainting erforderlich ist. Es ist ein fantastisches Werkzeug für clevere Trader, die darauf abzielen, das Timing ihrer Operationen zu verbessern. [ Installationsanleitung | Update-Anleitung | Fehlerbehebung | FAQ | Alle Produkte ] Erstaunlich einfach zu handeln Es bi
249 USD
Introduction to X3 Chart Pattern Scanner X3 Cherart Pattern Scanner is the non-repainting and non-lagging indicator detecting X3 chart patterns including Harmonic pattern, Elliott Wave pattern, X3 patterns, and Japanese Candlestick patterns. Historical patterns match with signal patterns. Hence, you can readily develop the solid trading strategy in your chart. More importantly, this superb pattern scanner can detect the optimal pattern of its kind. In addition, you can switch on and off individu
250 USD
Weis Wave with Alert MT5
Trade The Volume Waves Single Member P.C.
4.93 (14)
Rental/Lifetime Package Options and Privileges  * For optimum results the yearly or lifetime package is suggested due to live training ! Rent Monthly Six Months   Yearly/Lifetime Weis Wave with Speed with Alert+Speed Index x x x Manual  x x x Quick Set up Video x x x Blog x x x Lifetime Updates x x x Setup and Training Material x x Free Rectangle Break Alert Tool      x Discord Access Channel "The SI traders" x 2-hour live methodology training x How to trade with it:     http:/
599 USD
ToolBox 360 is the swiss knife of all indicators. It is full packed with useful tools to help you with your trading. It can be used to find best entry and exit points and help you to decide if you should open a trade or not. It shows market trends, candlestick formations outside / inside bars and you can sett time based allerts. Main features: Time based Fibonacci lines Choose a start and end time and the indicator shows you Fibonacci lines within the selected time range including range high
399 USD
Description Very precise patterns to detect: entry signals as well as breakout, support and resistance reversal patterns. It points out zones in which, with a high probability, institutional orders with the potential to change the price’s direction and keep moving towards it, have been placed. Support:   We create great tools for the entire trading community. Most of them are free. If you believe in what we do  Support Us Here.   KEY LINKS:   Indicator Manual  -  All Products  How is this ind
280 USD
Introduction to Fractal Pattern Scanner Fractal Indicator refers to the technical indicator that makes use of the fractal geometry found in the financial market. Fractal Pattern Scanner is the advanced Fractal Indicator that brings the latest trading technology after the extensive research and development work in the fractal geometry in the financial market. The most important feature in Fractal Pattern Scanner is the ability to measure the turning point probability as well as the trend probabil
180 USD
TheStrat Monitor MT5
Robert Gerald Wood
5 (1)
Wenn Sie   die Handelsstrategie von The Strat   noch nicht kennen, googeln Sie sie jetzt. Ich verspreche, es wird keine Zeitverschwendung sein, und Sie werden wahrscheinlich einige neue Tricks lernen, ob Sie es verwenden oder nicht. OK, jetzt, da Sie wissen, was TheStrat ist, können Sie verstehen, was dieser Indikator für Sie tun kann. Hauptmerkmale Kurz gesagt, der Indikator wird: Zeitrahmenkontinuität für alle unterstützten Zeitrahmen anzeigen Unterstützt zwei Timeset-Ansichten, Daytrader un
150 USD
Divergenzen sind schwierig zu finden und seltener anzutreffen. Sie sind eines der zuverlässigsten Handelsszenarien. Dieser Indikator sucht automatisch mit Ihrem bevorzugten Oszillator nach regelmäßigen und versteckten Abweichungen. [ Installationsanleitung | Update-Anleitung | Fehlerbehebung | FAQ | Alle Produkte ] Einfach zu handeln Findet regelmäßige und versteckte Abweichungen Unterstützt viele bekannte Oszillatoren Implementiert Handelssignale basierend auf Ausbrüchen Zeigt geeignete
249 USD
The indicator is designed to close positions on the market in time. For example: to take profits ahead of schedule if the price has not reached TakeProfit, and the market is turning around. The indicator analyzes the momentum, not the trend. He does not give any information about the trend. The indicator is well suited for finding divergence. The Ershov 38 Parrots indicator dynamically adjusts to the market and detects price movement impulses of medium and high amplitude. It almost does not rea
630 USD
Introducing the South African Sniper indicator created by a small group of traders with a few years trading trading the financial market profitably . This is a plug and play indicator that provides you with  BUY and SELL (SNIPER ENTRY) signals with TARGET and trail stops. The indicator Works with all MT5 trading instruments. The indicator uses previous  chart data as receipt to speculate on future market moves.
150 USD
IVISTscalp5
Vadym Zhukovskyi
5 (1)
Wir stellen Ihnen den iVISTscalp5-Indikator vor, der nicht nur einzigartig, sondern auch effektiv im Handel ist. Dieser Indikator basiert auf Zeitdaten und ist das Ergebnis jahrelanger Erfahrung und eingehender Analyse der Finanzmärkte. Der iVISTscalp5-Indikator ist ein ausgezeichnetes Werkzeug für manuellen Handel. Bequemlichkeit, Einfachheit und Visualisierung - die gesamte Komplexität ist verborgen. Wir haben die Einstellungen und Verwendung des iVISTscalp5-Indikators auf das Maximum vereinfa
500 USD
Introduction to EFW Analytics EFW Analytics was designed to accomplish the statement "We trade because there are regularities in the financial market". EFW Analytics is a set of tools designed to maximize your trading performance by capturing the repeating fractal geometry, known as the fifth regularity in the financial market. The functionality of EFW Analytics consists of three parts. Firstly, Equilibrium Fractal Wave Index is an exploratory tool to support your trading logic to choose which r
200 USD
Gartley Hunter Multi
Siarhei Vashchylka
5 (4)
Gartley Hunter Multi - An indicator for searching for harmonic patterns simultaneously on dozens of trading instruments and on all classic timeframes: (m1, m5, m15, m30, H1, H4, D1, Wk, Mn). Manual (Be sure to read before purchasing) | Version for MT4 Advantages 1. Patterns: Gartley, Butterfly, Shark, Crab. Bat, Alternate Bat, Deep Crab, Cypher 2. Simultaneous search for patterns on dozens of trading instruments and on all classic timeframes 3. Search for patterns of all possible sizes. Fr
149 USD
Native Channels
BeeXXI Corporation
5 (2)
This indicator recognizes all support and resistance levels. A number of unique high-performance techniques have been applied, which made the existence of this indicator possible. All formed channels are naturally visible: horizontal linear linear parabolic cubic (Polynomial 3 degrees - Wave) This is due to a bundle of approximating channels. The formed channels form "standing waves" in a hierarchical sequence. Thus, all support and resistance levels are visible. All parameter management is
177 USD
MT4 Version   Kill Zones   SMT Divergences Order Blocks ICT Multi TF The Order Blocks ICT Multi TF indicator is a cutting-edge tool designed to help traders make better trading decisions based on order block analysis. Order blocks are key levels on a price chart where large institutional traders placed their orders. These levels tend to act as strong support or resistance zones and often signal a potential reversal or continuation of a trend. By identifying these order blocks, traders can gain
224 USD
All in One package includes the  Oscillator Predictor ,  MACD Predictor ,  Thrust Scanner  and  Advanced Fibonacci  indicators which are mandatory for applying  Dinapoli  trade plans.  Please visit below links for detailed explanations of indicators. Advanced Fibonacci Indicator =>  https://www.mql5.com/en/market/product/107933 Thrust Scanner Indicator =>  https://www.mql5.com/en/market/product/52829 Overbought /Oversold Predictor indicator => https://www.mql5.com/en/market/product/52628 Macd
240 USD
MR Dynamic POC 5
Sergey Khramchenkov
The most crucial price level in any "Volume Profile" is the "Point of Control" . Is the price level with the highest traded volume. And mainly, is the level where the big guys start there their positions, so it's an accumulation/distribution level for smart money. The idea of the indicator arose after the "MR Volume Profile Rectangles" indicator was made. When creating the "MR Volume Profile Rectangles" indicator, we spent a lot of time comparing the volumes with those from the volume profil
150 USD
Weitere Produkte dieses Autors
VolumeProfile
Robert Hess
3.8 (5)
Beschreibung: Das Volumen Profil zeigt detailierte Informationen von historischen trading Aktivitäten in bestimmten Preisbereichen (Markt Profil).  Damit finden Sie die Zonen mit den besten Preisen im Markt und erlangen so einen entscheidenen Vorteil gegenüber anderen Marktteilnehmern. Support: Zögern Sie bitte nicht, mich über die MQL5 Platform zu kontaktieren. Ich bin sehr dankbar für den Bericht von aufgetretenen Fehlern, sodass ich den Indikator verbessern kann. Bitte geben Sie auch gerne
99 USD
Beschreibung: TrendAccess optimiert ihre trading Zeit indem es Ihnen den Trend in zwei unterschiedlichen Berechnungsmethoden schnell und einfach anzeigen kann. Keine Suche nach Trends mehr nötig. Öffnen Sie einfach den Chart und lassen Sie sich die Trendrichtung anzeigen.  Features: Zeigt einen Indikator für den Aufwärt- und Abwärts- und Seitwärtstrend Zeigt das berechnete ZigZag Profil Funktioniert auf allen Zeiteinheiten Zwei unterschiedliche Berechnungsmethoden (MACD und Kerzenbasierte B
39 USD
Beschreibung Dieses Addon hat seinen Ursprung in meinem eigenem Handel. Ich wollte mir die Wartezeit auf der Suche nach Signalen sparen. Also fing ich an, mein eigenes Addon zu schreiben und nannte es "LifetimeSaver", weil es genau das für mich ist.  Da dieses Addon jedoch nicht nur für meinen persönlichen Handel bestimmt sein sollte, habe ich den LifetimeSaver erweitert sodass er nun anpassbar auf Ihre Bedürfnisse ist.  Funktionen: Benachrichtigung an Ihrem definierten Ziel/Signal Benachrich
165 USD
Description: The Multi POC displays multiple Point Of Controls on one chart.  This Indicator is also already included in the "VolumeProfile" Indicator . Features: Customizable Range POC Customizable section POCs with VAL&VAH lines Works on all timeframes Drag & Drop for live calculation Support: The indicator is constantly being developed and improved. Please do not hesitate to contact me via the MQL5 Platform. I am very grateful about any Bug report, so that i can constantly improve the ind
39 USD
Auswahl:
Douglas De Souza Goncalves
126
Douglas De Souza Goncalves 2023.11.29 22:55 
 

I migrate to another account with the same broker but the indicator doesn't work... do I need to do some activation or something like that for the indicator to work again? thank you very much

Jan Patzig
36
Jan Patzig 2023.08.09 15:42 
 

Supaaaaa...

RuedigerWuest
24
RuedigerWuest 2022.06.25 15:26 
 

Ich find das Tool sehr gut gelungen und hilfreich. Leider läuft es auf meinem Windows 11 Notebook nicht mehr. Nur unter Windows 10 läuft es bei mir.

00023867
114
00023867 2022.02.09 16:20 
 

a very good indicator

271811
158
271811 2022.01.26 18:04 
 

Please BEWARE of Fake Reviews by this seller!!Dont waste your money!! VERY BUGGY!! indicator options does not work correctly!!

No I am not selling my own product!! Im not a coder or programmer!! Mr Hess Volume Profile

is no good! It blinks when you change options...Terrible coding IMO!! Dont believe me, go ahead and purchase!!

Robert Hess
1618
Antwort vom Entwickler Robert Hess 2022.02.09 16:52
My Opinion: I think this is an account of somebody who is selling his own products and rate others bad, so he can sell his own stuff better. The Story: He bought (edit: *rented) the indicator for a Month, seemed very happy and all of a sudden he mentioned various "bugs". I wanted to help him, told him to give me the neccesary informations that I needed to look where exactly the problem is, because: I tested every setting on every timeframe and nearly every chart but couldnt find these issues that he mentioned. I even implemented a new feature on the MT4 version especialy for him. But neither he wanted to be helped, nor could I find any bug in the indicator!?
Lagoon3800
19
Lagoon3800 2021.11.08 10:40 
 

Hallo! Habe Volume Profile am 2.11.2021 für 165$ hier erworben, mir wurden 196,35 von Paypal abgebucht - absolut unfair. Wo findet man eine genauere Anleitung um auch alle Feinheiten dieses Indikators nutzen zu können?

Robert Hess
1618
Antwort vom Entwickler Robert Hess 2021.12.03 10:50
Hallo Lagoon3800, wie bereits erwähnt findest du eine umfassende Tabelle in der allgemeinen Übersicht des Indikators. Die 19% die du zusätzlich per PayPal bezahlt hast sind leider als Mehrwertsteuer (VAT) in Deutschland fällig. Dafür können weder ich, noch der Webseitenbetreiber etwas. Ich hoffe ich konnte dennoch zu Aufklärung beitragen :) Robert
CSG CSG
1514
CSG CSG 2020.06.05 11:59 
 

Jeden Euro wert! Ich finde es schade, dass manche Leute Bewertungen abgeben und dann auch noch aufgrund ihres mangelnden Wissens negative... Ich arbeite schon länger mit diesem Profil und nach diversen Tests und Fehlkäufen anderer Anbieter stimmen hier die Daten perfekt! Worauf kommt es eigentlich an? 1. Wenn ich rückwärtigen Raum betrachte, z.B. im M5 30 Tage als Profil darstellen will, muss ich 8640 Perioden nutzen, hier versagen manch andere, denn dort stellt man "Monat" ein und es wird nur auf die Daten der Monatskerze zugegriffen, was natürlich, je jünger der Monat ist nichts bringt. 2. Dieser Indikator hier aktualisiert sich sauber und das auch in volatilen Situationen, glaubt mir, wenn es richtig um Geld geht, ist es sehr ärgerlich, wenn ein Indikator die ganze Plattform aufhängt. 3. Man kann den Indikator mehrfach auf einen Chart verwenden und dann sieht man auch beim Umschalten die gleichen Daten, wenn man diese auch entsprechend einstellt. (Visualisierung z.B. nur in H1, dann Perioden 720 wenn man 30 Tage darstellen will) 4. Man kann Farbe, Skalierung, links rechts... alles frei gestalten und wenn gewünscht auch nur die Linien anzeigen. 5. Wenn man wirklich mit einem Indikator arbeitet, dann holt man den Preis dafür bereits nach 1 oder ein paar Trades wieder rein und hier stimmt P/L absolut, was man hier sicher von einigen 10 oder X Euro Produkten nicht sagen kann. 6. Bevor man etwas negativ bewertet, sollte man sich mit der Systematik dahinter beschäftigen und niemand zwingt einen etwas zu kaufen, ein Top Produkt aber aufgrund der eigenen Fehlentscheidung schlecht zu bewerten ist absolut daneben und solche Leute werden auch nie erfolgreich sein, denn sie suchen die Schuld für ihre eigenen Fehler bei anderen. Warum schreibe ich das alles? Weil ich absolut zufrieden mit dem Produkt bin, man auch mit dem Entwickler kommunizieren kann, er es immer aktiv weiter entwickelt und weil es mich ärgert, wenn jemand etwas ohne ausreichende Fachkenntnis schlechter bewertet. Absolute Empfehlung und außerdem - man kann es ja auch erst mal einen Monat testen. Danke und weiter so :-)

James Lavoie
56
James Lavoie 2019.05.14 15:18 
 

I don't want to be harsh but its a complete waste of money.

Less function than the FREE volume profile indicator available in the code base.

The addition of horizontal lines for vpoc and value areas don't do it for me and certainly not justify 150 USD.

Values are not displayed identically when switching tf's and scrolling, something is wrong.

Works on all timesframes but does not use data of all time frames. Somewhat misleading description, and a big difference.

Disappointed, but my own fault.

Robert Hess
1618
Antwort vom Entwickler Robert Hess 2021.04.25 13:54
Hi James, i wanted to solve the problems with you, but sadly you didnt answered. I think one star isn't what the indicator deserve.
Faisal Javed
803
Faisal Javed 2019.04.24 23:29 
 

Excellent tool and helpful as a part of your trading strategy. Highly recommened.

Antwort auf eine Rezension
Version 1.43 2023.07.24
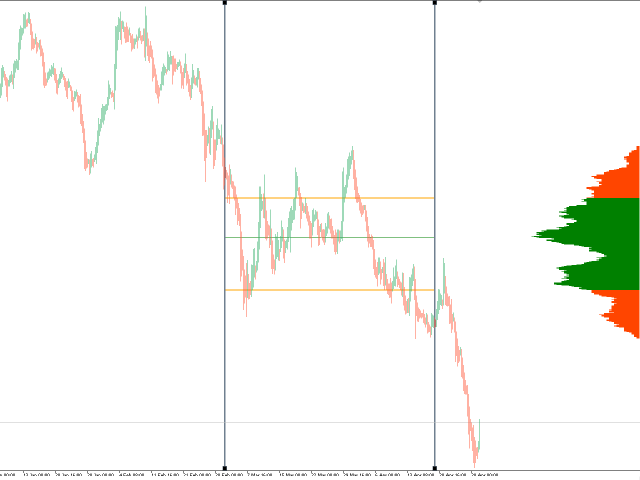
- VAL/VAH Linien zur "Section POC" Option hinzugefügt
Version 1.42 2022.05.12
New Feature:
- Customer request: A POC of the current period will now be calculated/displayed
-> You can change the gap between the current candle and the last period section line with a new input field
Version 1.41 2022.05.06
- Usability improvements
Version 1.40 2022.05.02
Neue Funktionen:
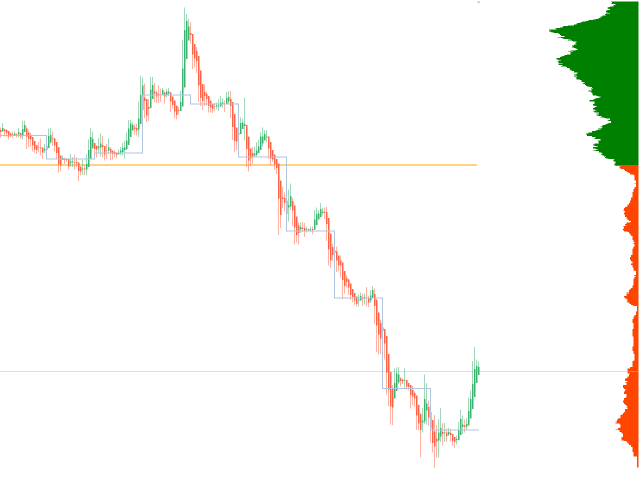
- Abschnitts-POCs so einstellen, dass sie an Periodentrennungen gebunden sind
Version 1.39 2022.04.29
Neue Funktionen:
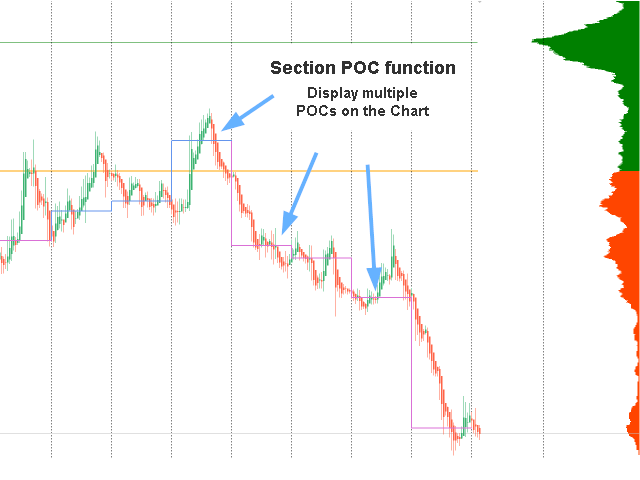
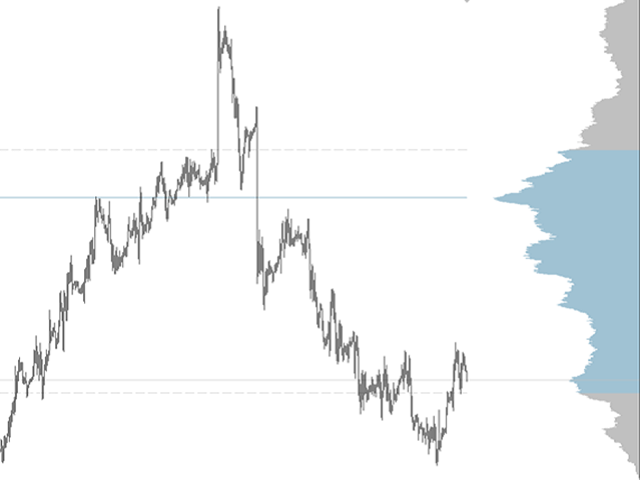
- Implementierung eines "Section POC"
-> Sie können nun einen POC für mehrere Abschnitte im Diagramm anzeigen
Version 1.38 2022.04.29
Neue Funktionen:
- Drag & Drop Linie für Start- und Endzeit der Indikatorberechnung

Sonstiges:
- Code-Optimierung
- Verbesserungen der Benutzerfreundlichkeit
Version 1.37 2021.12.20
Fehlerbehebung
- ein Fehler wurde behoben, der bei einem weiten hereinzoomen in den Chart zur Folge hatte, dass das VolumeProfile nicht mehr angezeigt werden konnte

Anpassungen
- das Attribut "Scale" setzt nun den Prozentsatz vom Chart, den das VolumeProfile verdeckt
-> der Standardwert für "Scale" wurde von 4 auf 10 angehoben (10% des Charts wird für das VolumeProfile benutzt)
Version 1.36 2021.10.11
User Request wurde implementiert:
- Kerzen History: Für jede Zeiteinheit können Sie nun separate Werte eintragen und zwischen der Allgemeinen Einstellung (Bar History), welche für alle Zeiteinheiten gilt, oder den von Ihnen definierten einzelnen Werten wechseln (Schalter "Set custom History values (below)").
Version 1.35 2021.07.02
- Das Aussehen im gespiegelten Modus wurde korrigiert, der Detailgrad sollte nun wie im ungespiegelten Modus sein
Version 1.34 2021.06.11
Neue Funktion
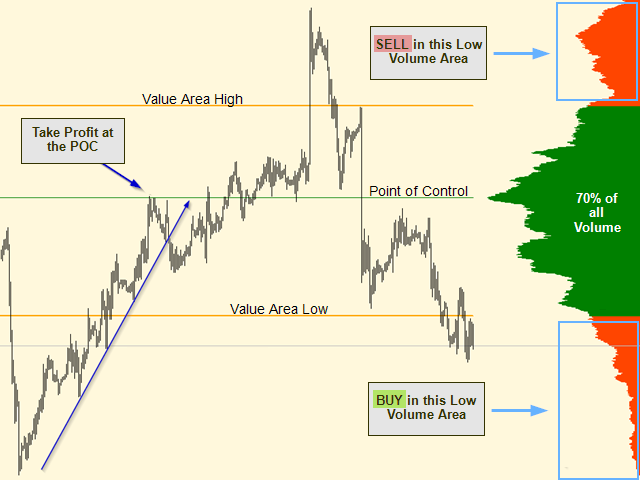
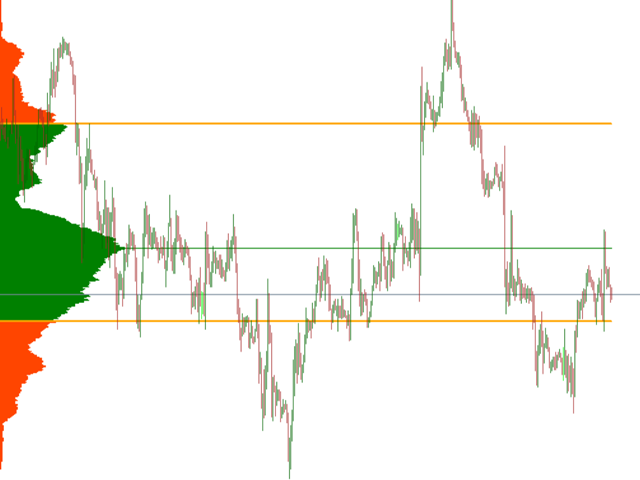
- Sie können nun den Prozentsatz der "Value Area" (die Zone mit dem höchsten Handelsvolumen) selbst bestimmen.
Version 1.33 2021.06.11
- Die Berechnung des Profils wurde angepasst, um die Genauigkeit zu verbessern
Version 1.32 2021.04.25
- Optimierung einiger Prozesse um die CPU Beanspruchung zu reduzieren
Version 1.31 2021.04.22
Fehlerbehebung
- Der Indikator wird nicht mehr neu berechnet, sobald ein Objekt im Chart verschoben wurde
Version 1.30 2021.03.13
- Eine History Linie wurde hinzugefügt, die per Drag&Drop bewegt werden kann, um das VolumeProfile neu zu berechnen
Version 1.29 2021.01.17
- Berechnung des automatischen Detail bei high Volume charts wurde geändert, somit wurde das VolumeProfile optisch verbessert
Version 1.28 2020.12.07
- Bugfixes
Version 1.27 2020.12.04
- Funktion hinzugefügt, die die automatische Berechnung der History Zeit bei einem Periodenwechsel ermöglicht
Version 1.26 2020.09.30
- Das VolumeProfile wird nun standardmäßig alle 10 Sekunden aktualisiert

Neue Parameter:
- "Refresh auto": Setzen Sie den Wert auf "true" um die automatische aktualisierung des VolumeProfile zu aktivieren
- "Refresh rate": Wählen Sie den Aktualisierungstimer in Sekunden
Version 1.25 2020.07.20
Anpassungen:
- Der default Wert für die Bar History ist nun 1440!

Fehlerbehebungen:
- Es gibt mehrere kleinere Anpassungen um die Initialisierung des VolumeProfile zu beschleunigen
Version 1.24 2020.07.06
Fehlerbehebung:
- Das VolumeProfile wird jetzt neu generiert, sobald die Periode gewechselt wird
Version 1.23 2020.06.03
Anpassungen:
- Mit dem "Enable Volume Profile" Schalter, ist es nun möglich nur die POC, VHigh und VLow Linien anzeigen zu lassen und das Volume Profile zu verstecken
Version 1.22 2020.06.03
Fehlerbehebung:
- Objekte die Sie im Chart erstellt haben, werden nicht mehr gelöscht bei einer Periodenänderung
Version 1.21 2020.06.03
Änderungen:
- im gespiegelten Modus kann das VolumeProfile nun mit dem "scale" Parameter angepasst werden
Version 1.2 2020.05.09
Neue Funktionen:
- Mirror to left side: Spiegelt das VolumeProfile auf die linke Seite des Charts

Anpassungen:
- "Mirror to left side" Funktion hinzugefügt
- die Beschreibungen folgender inputs wurden geändert
- "auto set X-Position" -> Horizontal Position (auto)
- "X-Position" -> Horizontal Position (manual)
Version 1.1 2019.04.09
Initial release