• Übersicht
  • Bewertungen (5)
  • Diskussion (36)
  • Neue Funktionen

Volume by Price MT5

5

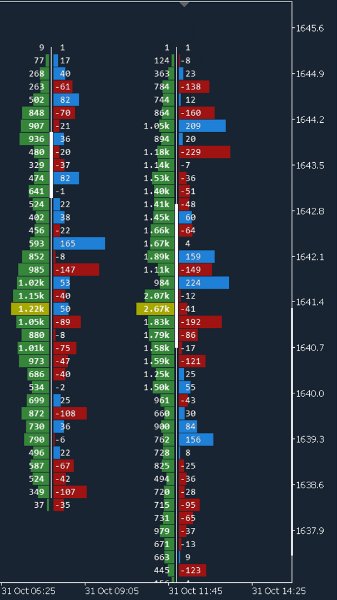
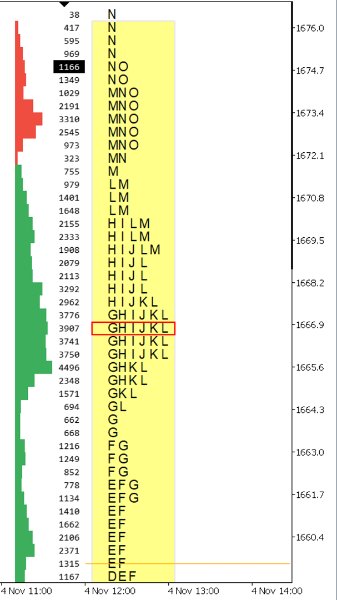
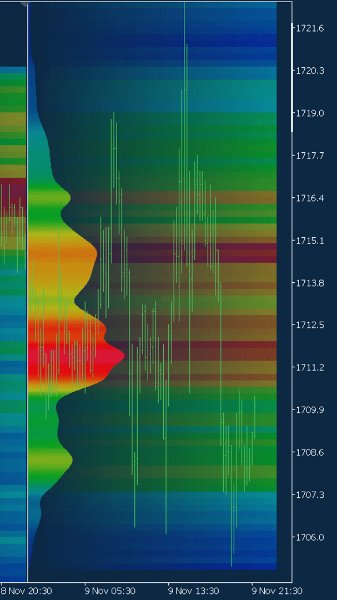
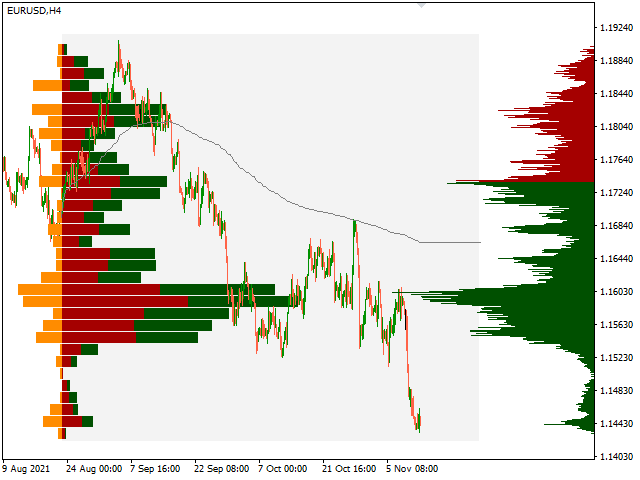
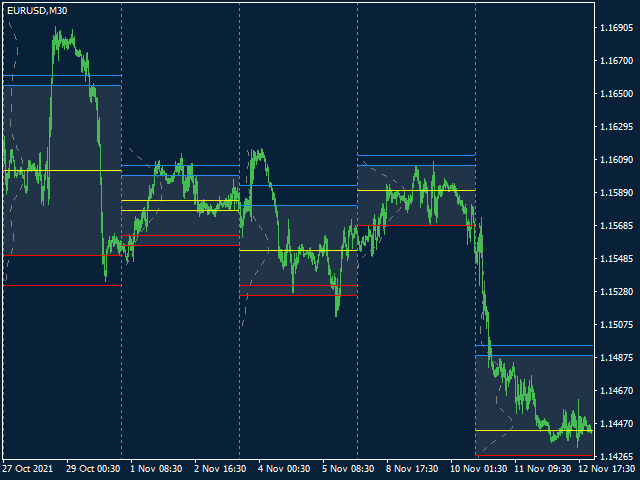
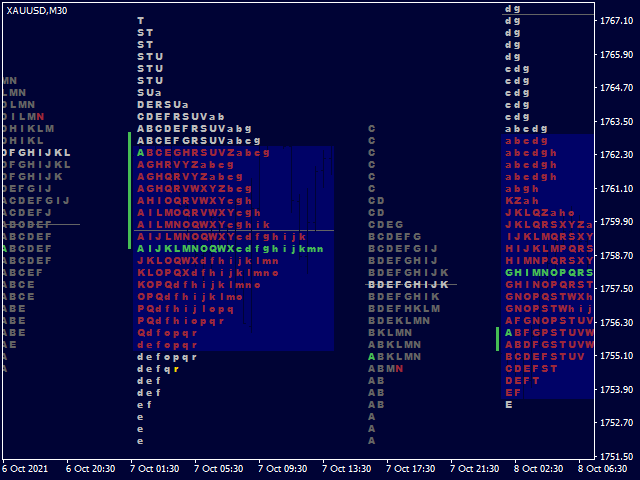
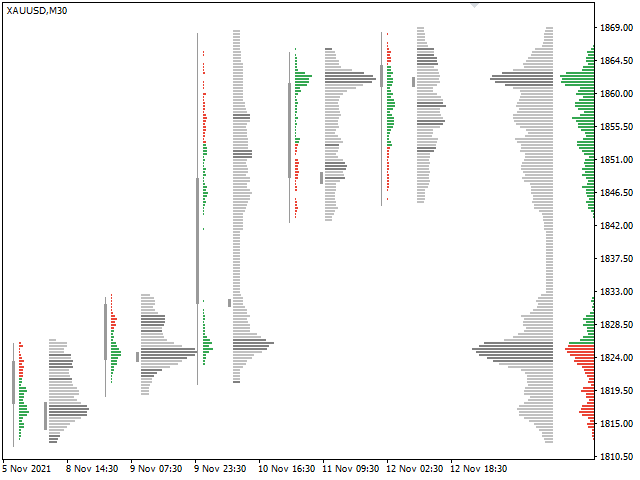
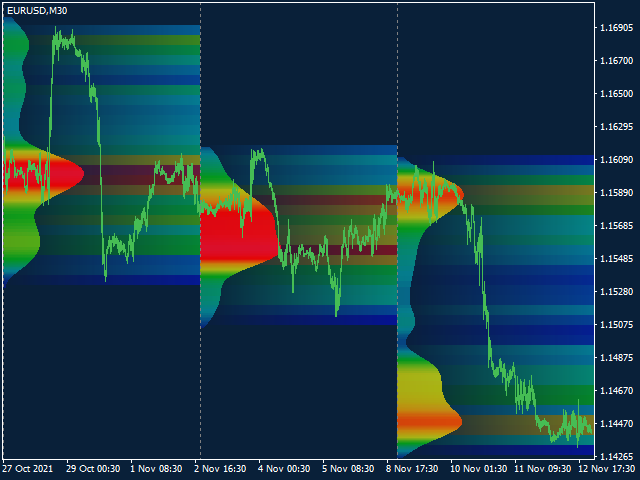
The Volume by Price Indicator for MetaTrader 5 features Volume Profile and Market Profile TPO (Time Price Opportunity). Volume and TPO histogram bar and line charts. Volume Footprint charts. TPO letter and block marker collapsed and split structure charts. Session filtering and grouping. Static, dynamic and flexible range segmentation and compositing methods with relative and absolute visualizations. Graphical layering, positioning and styling options to suit the user's analytic and aesthetic needs.

Volume Profile and Market Profile TPO Point of Control (VPOC and TPOC), Count, Balance, Imbalance, Value Area (VA) and High and Low Volume Nodes (HVN and LVN) with visualization and evaluation by multiple methods and a wide range of user-definable variables to apply with all disciplines and studies. Delta Volume Profile and Footprint charts with volume classification by price action or order type. Additionally includes Initial Balance (IB), Volume Weighted Average Price (VWAP), and Volume by Time histogram and bubble charts to perform Volume Spread Analysis (VSA) and Volume Price Analysis (VPA).

A suite of technical analysis data visualization tools to display the complex relations between volume, price and time in various easy to interpret forms. Types of charts include change over time, part-to-whole, correlation and distribution. Data Source API for data connector extensions and user file feeds to have full control over the scope and type of data beyond native brokerage provisioning. Tick volume, trade volume or open interest. Includes Order Book Time and Sales (T&S) and Depth Of Market (DOM) cross-platform terminal compatible MetaTrader 5 extension for Order Flow Analysis. Data Environment API for extension and developer programmatic access to dimensions and metrics. Includes Traces, Events, Notifications and Reports extensions, and code sample resources for automated algorithmic trading strategies.

High-level chart setups with drag and drop support for the casual user, and further in-depth and segmented by using advanced user features. For a quick start browse example compositions and download chart templates. For details on configuration options and methods see documentation.


Free demo limitations: Distribution with chart timeframe period price data. Range of 200 bars. Up to 5 segments.

Bewertungen 5
Tyler Sanchez
528
Tyler Sanchez 2022.10.15 16:59 
 

An incredible idicator

João Cavalcante
536
João Cavalcante 2019.05.18 21:00 
 

Very versatile volume and market profile indicator indeed. Glad to have found it. It is the only one available in metatrader market capable of creating profiles with data concatenated from multiple contract months. Delighted to finally see such a feature. Other platforms seem to struggle to get it done. Surprised the mt4 version features it as well. Takes a while to setup and requires some pre-knowledge but as any futures trader knows profiles are most accurate if data from consecutive contract months is aggregated and selected by highest trade activity. Some of the futures traders I know won't even look at a profile which isn't.

dbaumann
38
dbaumann 2019.04.30 01:36 
 

Best alternative to sierra chart for market and volume profiles.

Empfohlene Produkte
Was: $249  Now: $99   Market Profile defines a number of day types that can help the trader to determine market behaviour. A key feature is the Value Area, representing the range of price action where 70% of trading took place. Understanding the Value Area can give traders valuable insight into market direction and establish the higher odds trade. It is an excellent addition to any system you may be using. Inspired by Jim Dalton’s book “Mind Over Markets”, this indicator is designed to suit the
This indicator allows you to enjoy the two most popular products for analyzing request volumes and market deals at a favorable price: Actual Depth of Market Chart Actual Tick Footprint Volume Chart This product combines the power of both indicators and is provided as a single file. The functionality of Actual COMBO Depth of Market AND Tick Volume Chart is fully identical to the original indicators. You will enjoy the power of these two products combined into the single super-indicator! Below is
BoxChart MT5
Evgeny Shevtsov
5 (7)
The market is unfair if only because 10% of participants manage 90% of funds. An ordinary trader has slim changes to stand against these "vultures". This problem can be solved. You just need to be among these 10%, learn to predict their intentions and move with them. Volume is the only preemptive factor that faultlessly works on any timeframe and symbol. First, the volume appears and is accumulated, and only then the price moves. The price moves from one volume to another. Areas of volume accumu
Welcome to the Ultimate Harmonic Patterns recognition indicator that is focused to detect advanced patterns. The Gartley pattern, Bat pattern, and Cypher pattern  are popular technical analysis tools used by traders to identify potential reversal points in the market. Our Ultimate Harmonic Patterns recognition Indicator is a powerful tool that uses advanced algorithms to scan the markets and identify these patterns in real-time. With our Ultimate Harmonic Patterns recognition Indicator, you
Der Indikator erstellt aktuelle Notierungen, die mit historischen verglichen werden können, und auf dieser Grundlage eine Preisbewegungsprognose erstellen. Der Indikator verfügt über ein Textfeld zur schnellen Navigation zum gewünschten Datum. Optionen: Symbol - Auswahl des Symbols, das der Indikator anzeigen soll; SymbolPeriod - Auswahl des Zeitraums, aus dem der Indikator Daten aufnimmt; IndicatorColor - Indikatorfarbe; HorisontalShift - Verschiebung der vom Indikator gezeichnet
VolumeProfile MT5
Robert Hess
3.75 (8)
Beschreibung: Das Volumen Profil zeigt detailierte Informationen von historischen trading Aktivitäten in bestimmten Preisbereichen (Markt Profil/Preis Profil).  Damit finden Sie die Zonen mit den besten Preisen im Markt und erlangen so einen entscheidenen Vorteil gegenüber anderen Marktteilnehmern. Support: Der Indikator wird stetig weiterentwickelt und verbessert (siehe "Versionen"). Ich bin sehr dankbar für jeden Bericht von aufgetretenen Fehlern, sodass ich den Indikator verbessern kann. Bi
Blahtech Supply Demand MT5
Blahtech Limited
4.57 (14)
Was: $299  Now: $99   Supply Demand uses previous price action to identify potential imbalances between buyers and sellers. The key is to identify the better odds zones, not just the untouched ones. Blahtech Supply Demand indicator delivers functionality previously unavailable on any trading platform. This 4-in-1 indicator not only highlights the higher probability zones using a multi-criteria strength engine, but also combines it with multi-timeframe trend analysis, previously confirmed swings
Premium-Level ist ein einzigartiger Indikator mit mehr als 80% Genauigkeit der richtigen Vorhersagen! Dieser Indikator wurde von den besten Trading-Spezialisten seit mehr als zwei Monaten getestet! Den Indikator des Autors finden Sie nirgendwo anders! Anhand der Screenshots können Sie sich von der Genauigkeit dieses Tools überzeugen! 1 ist ideal für den Handel mit binären Optionen mit einer Ablaufzeit von 1 Kerze. 2 funktioniert bei allen Währungspaaren, Aktien, Rohstoffen, Kryptowähr
UPD1 Profile Levels MT5
Vitaliy Kuznetsov
5 (3)
Der Indikator findet die Niveaus des maximalen und minimalen Preisvolumens (Marktprofil) auf dem Arbeitsbalkendiagramm für die angegebene Anzahl von Balken.   Verbundprofil. Die Höhe des Histogramms ist vollautomatisch und passt sich an jedes Werkzeug und jeden Zeitrahmen an. Der Algorithmus des Autors wird verwendet und wiederholt bekannte Analoga nicht. Die Höhe der beiden Histogramme ist ungefähr gleich der durchschnittlichen Höhe der Kerze. Smart Alert (Smart alert) hilft Ihnen, den Preis in
This is a multi-symbol and multi-timeframe table-based indicator designed for a candlestick patterns detection with 46 patterns for META TRADER 5. Each formation has own image for easier recognition. Here you find most popular formations such as "Engulfing", "Hammer", "Three Line Strike", "Piercing" or Doji - like candles. Check my full list of patterns on my screenshots below. Also you can not only switch all bearish or bullish patterns from input, but also select formation for a specified symb
Wapv Price and volume
Eduardo Da Costa Custodio Santos
Der WAPV Price and Volume Indicator for MT5 ist Teil des Toolsets (Wyckoff Academy Wave Market) und (Wyckoff Academy Price and Volume). Der WAPV-Preis- und Volumenindikator für MT5 wurde entwickelt, um die Volumenbewegung auf dem Chart auf intuitive Weise einfach zu visualisieren. Damit können Sie die Momente des Spitzenvolumens und Momente beobachten, in denen der Markt kein professionelles Interesse hat Identifizieren Sie Momente, in denen sich der Markt durch Trägheit bewegt und nicht durch d
Owl Smart Levels MT5
Sergey Ermolov
4.43 (37)
MT4-Version  |  FAQ Der Owl Smart Levels Indikator ist ein komplettes Handelssystem innerhalb eines Indikators, der so beliebte Marktanalysetools wie die fortschrittlichen Fraktale von Bill Williams , Valable ZigZag, das die richtige Wellenstruktur des Marktes aufbaut, und Fibonacci-Levels , die die genauen Einstiegslevels markieren, enthält in den Markt und Orte, um Gewinne mitzunehmen. Detaillierte Strategiebeschreibung Anleitung zur Verwendung des Indikators Berater-Assistent im Handel Owl H
Market Profile MetaTrader System  — is a classic Market Profile implementation that can show the price density over time, outlining the most important price levels, value area, and control value of a given trading session. This indicator can be attached to timeframes between M1 and D1 and will show the Market Profile for daily, weekly, monthly, or even intraday sessions. Lower timeframes offer higher precision. Higher timeframes are recommended for better visibility. It is also possible to use a
Die Einzigartigkeit dieses Indikators liegt im Volumenabrechnungsalgorithmus: Die Akkumulation erfolgt direkt für den ausgewählten Zeitraum ohne Bezug auf den Tagesbeginn. Die letzten Balken können aus der Berechnung ausgeschlossen werden, dann haben die aktuellen Daten weniger Einfluss auf die vorher gebildeten signifikanten Niveaus (Volumina). Für eine genauere Berechnung werden standardmäßig Daten aus dem M1-Diagramm verwendet. Der Verteilungsschritt der Preismengen ist geregelt. Standardmäßi
Mine Farm
Maryna Kauzova
5 (1)
Mine Farm is one of the most classic and time-tested scalping strategies based on the breakdown of strong price levels. Mine Farm is the author's modification of the system for determining entry and exit points into the market... Mine Farm - is the combination of great potential with reliability and safety. Why Mine Farm?! - each order has a short dynamic Stop Loss - the advisor does not use any risky methods (averaging, martingale, grid, locking, etc.) - the advisor tries to get
Heikin Ashi candlesticks are a powerful tool for traders, offering a clear and smooth visualization of market trends. Unlike traditional candlesticks, they filter out market noise, providing a cleaner view of the market's direction and strength, which helps traders make more informed decisions. The Hull Heikin Ashi Smoothed indicator from Minions Labs takes this a step further by integrating the Hull Moving Average for enhanced smoothing and precision. This indicator not only simplifies trend id
Noize Absorption Index - is the manual trading system that measures the difference of pressure between bears forces and bulls forces. Green line - is a noize free index that showing curent situation. Zero value of index shows totally choppy/flat market.Values above zero level shows how powerfull bullish wave is and values below zero measures bearish forces.Up arrow appears on bearish market when it's ready to reverse, dn arrow appears on weak bullish market, as a result of reverse expectation.
Trading Utility for Forex Currency Pairs Only not for Gold  Functions Auto Lot Calculation based on Risk Auto stoploss  Auto TakeProfit Breakeven Auto Close Half % Close in percentage with respect to the PIPs Pending Orders BuyLimit Sell Limit with distances BuyStop Sell Stop    with distances Trading Informations Risk in percentage For Multiple trades Combine Takeprofit and Combine Stoplosses
A "Volume Profile" is an advanced charting indicator that displays total volume traded at every price level over a user specified time period. The main components of the volume profile are POC ( Point Of Control - the price level, at which the maximum number of contracts were executed during a selected period), VAH ( Value Area High - the highest price in the Value Area) and VAL ( Value Area Low - the lowest price in the Value Area). When we settled on the original indicator, we spent a lot o
Your Trend Friend
Luigi Nunes Labigalini
The trend is your friend! Look at the color of the indicator and trade on that direction. It does not  repaint. After each candle is closed, that's the color of the trend. You can focus on shorter faster trends or major trends, just test what's most suitable for the symbol and timeframe you trade. Simply change the "Length" parameter and the indicator will automatically adapt. You can also change the color, thickness and style of the lines. Download and give it a try! There are big movements
[ MT4 Version ] Supply and Demand Multitimeframe Supply and Demand Multitimeframe is the first indicator in the market that combines multiple aspects like trading volume, price structure and momentum to identify Supply and Demand zones for every asset. The Supply and Demand indicator analyzes simultaneously up to 4 different TFs and represents their information in the current graph. Its interactive UI highlights everytime the price enters a Supply or Demand zone even if the zones are not visible
PipFinite Exit EDGE MT5
Karlo Wilson Vendiola
4.89 (35)
Did You Have A Profitable Trade But Suddenly Reversed? In a solid strategy, exiting a trade is equally important as entering. Exit EDGE helps maximize your current trade profit and avoid turning winning trades to losers. Never Miss An Exit Signal Again Monitor all pairs and timeframes in just 1 chart www.mql5.com/en/blogs/post/726558 How To Trade You can close your open trades as soon as you receive a signal Close your Buy orders if you receive an Exit Buy Signal. Close your Sell orde
Strong Support mt5
Vasiliy Strukov
5 (9)
Unterstützungs- und Widerstandsniveaus sind seit langem ein mächtiges Werkzeug für die Marktanalyse. Der Strong Support Indikator baut Unterstützungsniveaus auf lokalen Preistiefs und Widerstandsniveaus auf lokalen Preishochs auf. Meine anderen Entwicklungen finden Sie hier Es wird empfohlen, in Verbindung mit einem Trendindikator wie Gold Stuff zu verwenden, um den Trend zu handeln und gleichzeitig Konsolidierungs- oder Umkehrzonen zu definieren sowie Stop-Loss und Take-Profit auf Unterstü
Before installing the HeatMap indicator make sure you are using a broker that gives you access to the Depth of market (DOM) !! This indicator creates a heatmap on your chart allowing you to see the buy or sell limit orders easily and in real time. You have the possibility to change the setting and the colors of the HeatMap in order to adapt to all markets and all charts. Here is an example of a setting you can use with the NASDAQ100 on the AMPGlobal broker :  https://www.youtube.com/watch?v=x0
No Demand No Supply MT5
Trade The Volume Waves Single Member P.C.
No Demand No Supply   This indicator identifies   No Demand –No Supply candles  to your chart and plots volume bars colored according to the signal. It can be applied to all timeframes or to a specific one only. It can also be used as regular volume indicator  with exceptional future of WEIGHTED VOLUME. Furthermore is has an alert notification, sound and email when a signals occurs. The indicator does not repaint but the alert will come on two candles back due to the definition of No Demand No S
Do you use volume in your reading of the market? Certainly many traders use it, and do not imagine operating without it. The Color Histogram Volume Set indicator allows the user to choose the value that he considers interesting to monitor. When you pass this you will have visual confirmation and if you want you will also have the audible alert that is given by the indicator. Of course, there are other ways to try to find a high volume, such as assessing whether the volume
ClusterSecond
Rafil Nurmukhametov
4.78 (32)
The utility allows you to build different types of graphs: Seconds chart from 1 second to 86400 seconds Tick chart from 1 tick and above The volume chart Delta chart Renko chart Range chart Demo version of the utility https://www.mql5.com/ru/channels/clustersecond Built-in indicators for volumetric analysis: daily market profile and market profile of the selected timeframe, Cluster Search Imbalance VWAP Dynamic POC, VAH, VAL the profile depth of the market vertical volume with various display op
Each bar graph is a brick, take buy a bill now as an example, the brick that is in lowest position at the moment, go to the left, when the brick with the 3rd highest is in existence, take the height of this brick as a benchmark, when the price exceeds the height of this brick, can establish buy a bill, when appear opposite circumstance closes a position, establish empty order at the same time. This is a simple rule, need each friend grope by oneself.
Gioteen Volatility Index (GVI) - your ultimate solution to overcoming market unpredictability and maximizing trading opportunities. This revolutionary indicator helps you in lowering your losing trades due to choppy market movements. The GVI is designed to measure market volatility, providing you with valuable insights to identify the most favorable trading prospects. Its intuitive interface consists of a dynamic red line representing the volatility index, accompanied by blue line that indicate
US30NinjaMT5
Satyaseelan Shankarananda Moodley
US30 Ninja is a 5 minute scalping indicator that will let know you when there is a trade set up (buy or sell). Once the indicator gives the trade direction, you can open a trade and use a 30 pip stop loss and a 30 pip to 50 pip take profit. Please trade at own own risk. This indicator has been created solely for the US30 market and may not yield positive results on any other pair. 
Käufer dieses Produkts erwarben auch
Bill Williams Advanced
Siarhei Vashchylka
5 (4)
Bill Williams Advanced is designed for automatic chart analysis using Bill Williams' "Profitunity" system. The indicator analyzes four timeframes at once. Manual (Be sure to read before purchasing) Advantages 1. Automatically analyzes the chart using the "Profitunity" system of Bill Williams. The found signals are placed in a table in the corner of the screen. 2. Equipped with a trend filter based on the Alligator indicator. Most of the system signals are recommended to be used only accordi
FxaccurateLS
Shiv Raj Kumawat
WHY IS OUR FXACCCURATE LS MT5 THE PROFITABLE ? PROTECT YOUR CAPITAL WITH RISK MANAGEMENT Gives entry, stop and target levels from time to time. It finds Trading opportunities by analyzing what the price is doing during established trends. POWERFUL INDICATOR FOR A RELIABLE STRATEGIES We have made these indicators with a lot of years of hard work. It is made at a very advanced level. Established trends provide dozens of trading opportunities, but most trend indicators completely ignore them!
Professional Scalping Tool on Deriv Attention! The indicator will be sold in limited quantities!!! The previous 5 copies were sold for $250 The remaining 4 copies will be sold for $350 The next price is $500 Description: This trading indicator is designed for professional traders focused on scalping. Designed with the market in mind, it provides highly accurate spike trading signals. It works on the M1 timeframe and supports the following symbols: Boom 300 Index, Boom 500 Index, Boom 1000 I
Dies ist wahrscheinlich der vollständigste Indikator für die automatische Erkennung der harmonischen Preisbildung, den Sie für die MetaTrader-Plattform finden können. Es erkennt 19 verschiedene Muster, nimmt Fibonacci-Projektionen genauso ernst wie Sie, zeigt die potenzielle Umkehrzone (PRZ) an und findet geeignete Stop-Loss- und Take-Profit-Werte. [ Installationsanleitung | Update-Anleitung | Fehlerbehebung | FAQ | Alle Produkte ] Es erkennt 19 verschiedene harmonische Preisbildungen Dar
TrendMaestro5
Stefano Frisetti
note: this indicator is for METATRADER4, if you want the version for METATRADER5 this is the link:  https://www.mql5.com/it/market/product/108106 TRENDMAESTRO ver 2.4 TRENDMAESTRO recognizes a new TREND in the bud, he never makes mistakes. The certainty of identifying a new TREND is priceless. DESCRIPTION TRENDMAESTRO identifies a new TREND in the bud, this indicator examines the volatility, volumes and momentum to identify the moment in which there is an explosion of one or more of these data a
"Piranha" - an autonomous trading system that determines overbought and oversold levels on the chart. Red and blue zones represent overbought and oversold levels respectively. Entry points are marked with arrows: a downward arrow in the red zone for "sell" and an upward arrow in the blue zone for "buy". The Take profit level is indicated by the green moving average. Key features: Adjusting the Take profit level as the green moving average changes position. Averaging ability when a new market e
TREND HARMONY MT5 – Multi Timeframe Trend and Phase and Pullback Level Visualizer indicator for Metatrader5 The TREND HARMONY indicator automates deep trend analysis and generates visualizations for you. Take control of your trades by eliminating uncertainty! Revolutionize your trading experience with precision and insight through the TREND HARMONY Multi Timeframe indicator – your ultimate MT5 trend visualization indicator. [  Features and Manual   | MT4 version |   All Products   ] Are you t
Eng Gold
Ely Alkrar Xshkaky
ENG-GOLD Scalper It is an auxiliary indicator that identifies potential targets and determines the place of entry with a stop loss that works on Heiken Ashi candles  The green lines are usually the targets, the red lines are the stop loss, and the yellow lines are the entry location.  This file is recognized on small and medium frames, usually less than the watch frame I highly recommend using XAUUSD US100 US30 USOIL 
IVISTscalp5
Vadym Zhukovskyi
5 (3)
Wir stellen Ihnen den iVISTscalp5-Indikator vor, der nicht nur einzigartig, sondern auch effektiv im Handel ist. Dieser Indikator basiert auf Zeitdaten und ist das Ergebnis jahrelanger Erfahrung und eingehender Analyse der Finanzmärkte. Der iVISTscalp5-Indikator ist ein ausgezeichnetes Werkzeug für manuellen Handel. Bequemlichkeit, Einfachheit und Visualisierung - die gesamte Komplexität ist verborgen. Wir haben die Einstellungen und Verwendung des iVISTscalp5-Indikators auf das Maximum vereinfa
RAD CRITICAL LEVES RAD indicator tracks “Relevant Volume” in real time, identifying accumulation and distribution processes, projecting them in the chart as SUPPORT or RESISTANCE zones. Natural   support   and resistance levels are generated by Volume Accumulation and Distribution processes. As these processes evolve, levels at which the relevant volume in the market place is positioned, become difficult areas to cross upwards or downwards. By using this information, traders can identify very s
VTrende Pro
Andrii Diachenko
5 (1)
VTrende Pro - MTF indicator for trend trading with a display panel for MT5 *** Videos can be translated into any language using subtitles (video language - Russian) Although the signals of the VTrende Pro indicator can be used as signals of a full-fledged trading system, it is recommended to use them in conjunction with the Bill Williams TS. VTrende Pro is an extended version of the VTrende indicator. Difference between Pro version and VTrende: - Time zones - Signal V - signal 1-2 waves
Weis Wave with Alert MT5
Trade The Volume Waves Single Member P.C.
4.93 (15)
Rental/Lifetime Package Options and Privileges  * For optimum results the yearly or lifetime package is suggested due to live training ! Rent Monthly Six Months   Yearly/Lifetime Weis Wave with Speed with Alert+Speed Index x x x Manual  x x x Quick Set up Video x x x Blog x x x Lifetime Updates x x x Setup and Training Material x x Free Rectangle Break Alert Tool      x Discord Access Channel "The SI traders" x 2-hour live methodology training x How to trade with it:    http://
INDIKATOR basierend auf KÜNSTLICHER INTELLIGENZ, der mögliche Call- und Put-Eingaben für binäre Optionen generiert. Der Indikator funktioniert nach drei verschiedenen Strategien: 1) Durch das Ablesen der Volumina wird ein Signal gesendet, wann sich der Preis umkehren sollte 2) Durch die Divergenz zwischen Preis und Volumen sendet es ein Signal, wann sich der Trend fortsetzen oder umkehren sollte 3) Durch die Konvergenz zwischen Preis und Volumen sendet es ein Signal, wann sich der Trend
ZigZag de Suavizador
Cesar Juan Flores Navarro
Teniendo una entrada de precios suavizados, los cuales son procesador por un ZigZag en tiempo real, dando como resultado un suavizador ajustado a un ZigZag. Con valores de entrada (periodo) mayores se vuelve un poco lenta en M1,, Ideal para H1, H4, D1 Trabaja bien con otros suavizadores, ya que su intersección es ideal Al iniciar empiza con mayor precisión desde el momento de activación, siendo el historial (anterior) de referencia ----------------------------------------------------------------
The indicator is designed to close positions on the market in time. For example: to take profits ahead of schedule if the price has not reached TakeProfit, and the market is turning around. The indicator analyzes the momentum, not the trend. He does not give any information about the trend. The indicator is well suited for finding divergence. The Ershov 38 Parrots indicator dynamically adjusts to the market and detects price movement impulses of medium and high amplitude. It almost does not rea
Super Suavizador
Cesar Juan Flores Navarro
Indicador en MQL5 que obtiene el promedio de 10 EMAS que son alineadas y procesadas según Fibonacci luego el promedio es suavizado"  Se ingresa un número de 2 a N que multiplica los EMA-Fibonacci y por consiguiente aumenta los fibonacci, resultando un promedio.   Se ingresa un número que suaviza los EMA-Fibonacci. Considerando los números 1/1 seria la suavización minima. Considerando los números 3/5 seria la suavización media. Considerando los números 10/30 seria la suavización alta.....etc
Smooth price for Monarch
Konstantin Gruzdev
5 (1)
The Smooth Price technical indicator is used for plotting a smoothed line as close to the price of the financial instrument as possible, and serves to eliminate its noise components. The indicator is part of the Monarch trading system, but here it is presented as an independent technical analysis tool. The indicator is based on the cluster digital filter , which, unlike the ClusterSMA , is applied directly to the price time series. Smooth Price does not redraw (except the very last, zero bar) an
Классификатор силы тренда. Показания на истории не меняет. Изменяется классификация только незакрытого бара. По идее подобен полной системе ASCTrend, сигнальный модуль которой, точнее его аппроксимация в несколько "урезанном" виде, есть в свободном доступе, а также в терминале как сигнальный индикатор SilverTrend . Точной копией системы ASCTrend не является. Работает на всех инструментах и всех временных диапазонах. Индикатор использует несколько некоррелируемых между собой алгоритмов для класси
Currency Index Watcher is a simple and user-friendly tool for whoever wish to trade Forex using currencies indexes. Currency Index Watcher is configurable and usable directly from the panel. Indexes of 8 custom currencies EUR, USD, GBP, JPY, CHF, AUD, CAD, NZD (default) Any 3-chars symbol from your market watch could be used (BTC = bitcoin, RUB = ruble, CNH = yuan etc ...) : double click the symbol label  Ability to select which currencies and made-of pairs will be analyzed : check/uncheck want
SmartTrendMt5
Andrey Spiridonov
The SmartTrendMt5 trend indicator generates signals based on the principle of combined analysis of calculated reference points within the Keltner channel. The indicator plots the Keltner channel in a separate window (by default, red lines and a blue line - the middle of the channel), and also draws the histogram of calculated reference points for each candle (by default, the histogram bars are yellow). The should be attached to a chart of any timeframe and any trading symbol in the usual way.
Forex Relative Performance indicator This indicator calculates the relative strength of major currencies against the US dollar. The basic idea behind this indicator is "to buy strong currency and to sell weak currency". This indicator allows you to quickly identify the best forex pair to trade according to your trading style (Intraday, Scalping, Swing, or Long Term)
The latest most requested Binary Options arrow indicator in the Garuda Signals product line is now on MT5! Binary options signal based on multiple time frame cross over analysis. Gets confirmation from the most consistent signals known to man; Ichimoku, SMA, Bollinger Bands; and also uses the 1 Hour time frame as trend confirmation , so you don't have to open up multiple chart and waste time. - Can be used for all time frames up to 1 hour, but is most POWERFUL for 1 and 5 min options. - Place yo
SuavizadorDePrecio
Cesar Juan Flores Navarro
Funciona identificando picos de máximos y mínimos, para luego eliminarlos haciendo una linea o curva, pudiendo el usuario ingresar el valor de que tanto puede suavizar. Nos facilita poder ver la tendencia así como ver el cruce que puede hacer con otros indicadores, mostrando a simple vista los inicios y salidas de una tendencia u operación. Así también facilita la visualización de subidas y bajadas.
Pendiente de Precio
Cesar Juan Flores Navarro
Indicador en base a la pendiente de la linea de precio, dibuja una línea de color cuando sube a base de los precios que previamente has sido procesados o linealizados, y cuando baja la pendiente la linea linealizada toma otro color. En este caso se a considerado 6 lineas de diferentes procesos desde pendientes largas hacia las cortas, observándose que cuando coincidan las pendientes se produce un máximo o mínimo, lo que a simple vista nos permitirá hacer una COMPRA O VENTA.
WanaScalper
Isaac Wanasolo
1 (1)
A scalping indicator based on mathematical patterns, which on average gives signals with relatively small SL, and also occasionally helps to catch big moves in the markets (more information in the video) This indicator has three main types of notifications: The first type warns of a possible/upcoming signal on the next bar The second type indicates the presence of a ready signal to enter the market/open a position The third type is for SL and TP levels - you will be notified every time price r
Индикатор Coefficient Of Determination (COD) представляет собой значение коэффициента детерминации или квадрат коэффициента корреляции между зависимой переменной — ценой и объясняющей переменной — тиковым объемом. Что это дает нам на практике? COD отлично распознает кульминацию трендовых движений, что позволяет подбирать оптимальные точки и ловить развороты рынка. Как использовать индикатор: Наиболее популярная торговая стратегия строится совместно с трендовым индикатором Moving Average (MA), пе
Fibonacci Multiple 12
Cesar Juan Flores Navarro
Fibonacci Múltiple 12, utiliza la serie fibonacci plasmado en el indicador fibonacci, aumentadolo 12 veces según su secuencia. El indicador fibonacci normalmente muestra una vez, el presente indicador se mostrara 12 veces empezando el numero que le indique siguiendo la secuencia. Se puede utilizar para ver la tendencia en periodos cortos y largos, de minutos a meses, solo aumentado el numero MULTIPLICA.
Recommended TimeFrame >= H1. 100% Non Repainted at any moment.  Use it carefully, only with Trend Direction. Trading Usage: 2 Variants: as Range System or as BreakOut System (Both Only With Trend Direction)::: (Always use StopLoss for minimise Risk); [1] as Range System: (Recommended) in UP TREND:  - BUY in Blue Line , then if price goes down by 50 points (on H1) open Second BUY.   Close in any Profit you wish: TrailingStop(45 points) or Close when Price touches upper Gold Line. in DOWN TR
Super Zone   For several years of observing the principles of the market, Super Zone worked, both then and now, because the indicator  allows you to see the trading range of the  week and even the month that major market participants use. It’s very easy to use, we work on H4 in the weekly range (  in the tester it doesn’t work in the demo mode  ) - we sell from the upper zones, we buy from the lower ones. It marks the zones from the beginning of the week (month) that are  not redrawn  , works on
En base a cálculos matemáticos de determino una linea Horizontal que cruza a todas las señales de trading, mostrando los máximos y mínimos. La linea horizontal parte en dos las subidas y bajadas de las señales de trading, de tan manera que es fácil identificar los máximos y mínimos, y es inteligente por que es sensible a las subidas y bajadas, afín de no quedarse en un solo lado por siempre, trabaja excelentemente con otros indicadores suavizadores ya que les garantiza que en un intervalo de tie
Weitere Produkte dieses Autors
Volume by Price MT4
Brian Collard
4.71 (14)
The Volume by Price Indicator for MetaTrader 4 features Volume Profile and Market Profile TPO (Time Price Opportunity). Volume and TPO histogram bar and line charts. Volume Footprint charts. TPO letter and block marker collapsed and split structure charts. Session filtering and grouping. Static, dynamic and flexible range segmentation and compositing methods with relative and absolute visualizations. Graphical layering, positioning and styling options to suit the user's analytic and aesthetic n
Auswahl:
Marlonsadler
49
Marlonsadler 2023.04.25 14:58 
 

Hi, i bought this indicator and found it brilliant, is it possible to combine the default view with the Market Profile TPO singles and split structure. I tried to split the default view but it dont look like the Market Profile TPO singles and split structure. i want the histogram with the split letters. is there a way i could send a picture so you can see what i mean?

Tyler Sanchez
528
Tyler Sanchez 2022.10.15 16:59 
 

An incredible idicator

Adeshola Adeyinka
662
Adeshola Adeyinka 2020.06.20 05:55 
 

Well I haven't been able to use it and all support channels are not working. So I can't give an honest review till I put it to use. When I have used it I will review and allocate star ratings.

João Cavalcante
536
João Cavalcante 2019.05.18 21:00 
 

Very versatile volume and market profile indicator indeed. Glad to have found it. It is the only one available in metatrader market capable of creating profiles with data concatenated from multiple contract months. Delighted to finally see such a feature. Other platforms seem to struggle to get it done. Surprised the mt4 version features it as well. Takes a while to setup and requires some pre-knowledge but as any futures trader knows profiles are most accurate if data from consecutive contract months is aggregated and selected by highest trade activity. Some of the futures traders I know won't even look at a profile which isn't.

dbaumann
38
dbaumann 2019.04.30 01:36 
 

Best alternative to sierra chart for market and volume profiles.

Antwort auf eine Rezension
Version 9.840 2024.05.14
• Improved functions for 'Dataset Segment'
Version 9.824 2024.05.07
• Improved functions for 'Dataset Range'
Version 9.810 2024.05.06
• Support for new extensions and resources
Version 9.806 2024.05.06
• Stability and performance improvements
Version 9.802 2024.05.05
• Improved graphics
Version 9.762 2024.05.03
• Improved functions for 'Object Panel'
Version 9.756 2024.05.01
• Improved functions for 'Extension Volume by Time'
Version 9.752 2024.04.30
• Stability and performance improvements
Version 9.750 2024.04.30
• Improved functions for 'Interface Data Source'
Version 9.718 2024.04.29
• Support for new extensions and resources
Version 9.716 2024.04.29
• Accessibility improvements
Version 9.712 2024.04.29
• Improved graphics
Version 9.708 2024.04.28
• Improved functions for 'Dataset Segment'
Version 9.706 2024.04.28
• Improved functions for 'Object Position'
Version 9.702 2024.04.24
• Improved functions for 'Interface Data Source'
Version 9.698 2024.04.23
• Support for new extensions and resources
Version 9.612 2024.04.11
• Stability and performance improvements
Version 9.604 2024.04.09
• Improved functions for 'Dataset Segment Session'
Version 9.602 2024.04.08
• Improved graphics
Version 9.598 2024.04.06
• Stability and performance improvements
Version 9.540 2024.04.04
• Improved functions for 'Object Position'
Version 9.528 2024.04.01
• Improved functions for 'Dataset Segment'
Version 9.524 2024.03.29
• Accessibility improvements
Version 9.520 2024.03.29
• Improved graphics
Version 9.512 2024.03.27
• Improved graphics
Version 9.502 2024.03.27
• Improved functions for 'Dataset Segment'
Version 9.452 2024.03.25
• Improved functions for 'Object Position'
Version 9.450 2024.03.25
• Improved functions for 'Column'
Version 9.424 2024.03.21
• Performance improvements
Version 9.422 2024.03.20
• Support for new extensions and resources
Version 9.420 2024.03.20
• Accessibility improvements
Version 9.410 2024.03.20
• Improved functions for 'Extension Volume by Time'
Version 9.402 2024.03.20
• Stability and performance improvements
Version 9.398 2024.03.18
• Accessibility improvements
Version 9.396 2024.03.18
• Improved functions for 'Object Position'
Version 9.354 2024.03.05
• Improved graphics
Version 9.350 2024.02.14
• Improved functions for 'Interface Data Source'
Version 9.318 2024.02.13
• Support for new extensions and resources
Version 9.316 2024.02.13
• Improved functions for 'Dataset Segment Session'
Version 9.314 2024.02.11
• Improved graphics
Version 9.312 2024.02.06
• Performance improvements
Version 9.308 2024.02.06
• Accessibility improvements
Version 9.306 2024.02.06
• Improved graphics
Version 9.298 2024.01.22
• Stability and performance improvements
Version 9.244 2024.01.16
• Improved graphics
Version 9.242 2024.01.15
• Improved defaults for 'Dataset Segment'
Version 9.240 2024.01.15
• Improved functions for 'Dataset Segment'
Version 9.230 2024.01.12
• Accessibility improvements
Version 9.220 2024.01.11
• Support for new extensions and resources
Version 9.218 2024.01.11
• Improved functions for 'Interface Data Source'
Version 9.216 2024.01.10
• Improved functions for 'Interface Data Environment'
Version 9.214 2024.01.08
• Stability and performance improvements
Version 9.212 2024.01.08
• Stability and performance improvements
Version 9.210 2024.01.07
• Stability and performance improvements
Version 9.208 2024.01.07
• Accessibility improvements
Version 9.206 2024.01.06
• Improved graphics
Version 9.205 2024.01.06
• Improved functions for 'Dataset Segment'
Version 9.134 2023.12.31
• Improved functions for 'Column'
Version 9.132 2023.12.30
• Improved graphics
Version 9.126 2023.12.29
• Support for new resources
Version 9.124 2023.12.29
• Improved graphics
Version 9.122 2023.12.28
• Accessibility improvements
Version 9.120 2023.12.28
• Accessibility improvements
Version 9.118 2023.12.27
• Accessibility improvements
Version 9.116 2023.12.27
• Improved functions for 'Interface Data Environment'
Version 9.114 2023.12.26
• Stability and performance improvements
Version 9.112 2023.12.25
• Stability and performance improvements
Version 9.108 2023.12.25
• Improved presets for 'Panel'
Version 9.106 2023.12.24
• Improved functions for 'Interface Data Source'
Version 9.104 2023.12.23
• Support for new extensions and resources
Version 9.102 2023.12.23
• Improved functions for 'Main'
• Improved functions for 'Column'
• Stability and performance improvements
Version 8.906 2023.12.19
• Improved functions for 'Object Position'
Version 8.904 2023.12.18
• Improved functions for 'Dataset Segment'
Version 8.902 2023.12.17
• Improved functions for 'Dataset'
• Stability and performance improvements
Version 8.710 2023.12.12
• Support for new extensions
Version 8.704 2023.12.12
• Improved presets for 'Panel'
• Improved functions for 'Interface Data Environment'
Version 8.702 2023.12.10
• Stability and performance improvements
Version 8.692 2023.11.30
• Improved functions for 'Main'
Version 8.614 2023.11.27
• Improved graphics
Version 8.610 2023.11.25
• Accessibility improvements
Version 8.608 2023.11.25
• Accessibility improvements
Version 8.604 2023.11.24
• Stability and performance improvements
Version 8.602 2023.11.24
• Improved functions for 'Style Column'
Version 8.598 2023.11.23
• Accessibility improvements
• Improved functions for 'Object Position'
Version 8.542 2023.11.20
• Accessibility improvements
Version 8.524 2023.11.10
• Accessibility improvements
Version 8.520 2023.11.09
• Support for new extensions and resources
• Improved functions for 'Panel'
Version 8.518 2023.11.08
• Stability and performance improvements
Version 8.516 2023.11.08
• Improved graphics
• Improved functions for 'Style Column'
• Improved functions for 'Interface Data Environment'
Version 8.502 2023.06.15
• Improved functions for 'Style Main Line'
Version 8.498 2023.06.13
• Improved functions for 'Style Panel'
Version 8.496 2023.06.12
• Improved functions for 'Style Main Line'
Version 8.316 2023.06.08
• Improved graphics
Version 8.314 2023.06.05
• Stability and performance improvements
Version 8.312 2023.06.01
• Accessibility improvements
Version 8.310 2023.06.01
• Performance improvements
Version 8.204 2023.05.24
• Improved functions for 'Object Position'
• Improved functions for 'Dataset Segment'
Version 8.198 2023.05.22
• Improved graphics
Version 8.102 2023.05.01
• Improved functions for 'Interface Data Environment'
Version 8.0 2023.05.01
• Improved defaults
Version 7.998 2023.05.01
• Improved graphics
Version 7.996 2023.05.01
• Accessibility improvements
Version 7.994 2023.04.28
• Accessibility improvements
Version 7.993 2023.04.28
• Support for new extensions and resources
• Accessibility improvements
Version 7.991 2023.04.04
• Improved graphics
Version 7.987 2023.04.01
• Improved graphics
Version 7.985 2023.03.29
• Improved graphics
Version 7.975 2023.03.27
• Stability and performance improvements
Version 7.973 2022.11.15
• Support for new extensions
Version 7.972 2022.11.15
• Accessibility improvements
Version 7.970 2022.11.13
• Stability and performance improvements
Version 7.968 2022.11.11
• Stability and performance improvements
Version 7.962 2022.11.07
• Stability and performance improvements
Version 7.946 2022.11.03
• Stability and performance improvements
Version 7.942 2022.10.28
• Improved presets for 'Panel'
Version 7.941 2022.10.28
• Support for new resources
Version 7.940 2022.10.28
• Improved functions for 'Interface Data Source'
Version 7.931 2022.10.26
• Support for new extensions
Version 7.927 2022.10.25
• Accessibility improvements
Version 7.926 2022.10.25
• Improved resources
Version 7.924 2022.10.24
• Stability and performance improvements
Version 7.920 2022.10.21
• Stability and performance improvements
Version 7.918 2022.10.19
• Improved functions for 'Interface Data Source'
Version 7.914 2022.10.17
• Improved functions for 'Style Main Histogram'
Version 7.912 2022.10.17
• Support for new resources
Version 7.910 2022.10.17
• Improved functions for 'Style Column'
Version 7.902 2022.10.17
• Improved functions for 'Object Position'
Version 7.896 2022.10.10
• Support for new extensions
Version 7.895 2022.10.10
• Stability and performance improvements
Version 7.893 2022.10.06
• Improved resources
Version 7.892 2022.10.06
• Improved graphics
Version 7.891 2022.10.02
• Support for new resources
Version 7.890 2022.10.02
• Improved functions for 'Dataset Segment'
• Improved functions for 'Interface On-Chart Controls'
Version 7.850 2022.09.26
• Improved functions for 'Dataset'
Version 7.810 2022.09.24
• Stability and performance improvements
Version 7.808 2022.09.23
• Improved resources
Version 7.807 2022.09.22
• Improved graphics
Version 7.805 2022.09.20
• Performance improvements
Version 7.802 2022.09.15
• Support for new extensions
Version 7.799 2022.09.13
• Support for new resources
Version 7.798 2022.09.12
• Improved functions for 'Dataset'
Version 7.795 2022.09.10
• Improved functions for 'Interface Data Source'
Version 7.793 2022.09.04
• Improved functions for 'Interface Data Environment'
Version 7.792 2022.09.04
• Improved graphics
Version 7.791 2022.09.04
• Support for new resources
Version 7.790 2022.09.03
• Stability and performance improvements
Version 7.786 2022.08.29
• Improved resources
Version 7.785 2022.08.29
• Accessibility improvements
Version 7.765 2022.08.10
• Improved functions for 'Dataset'
Version 7.764 2022.08.10
• Improved functions for 'Interface Data Environment'
Version 7.762 2022.08.08
• Support for new resources
Version 7.761 2022.08.07
• Improved graphics
Version 7.760 2022.08.07
• Support for new resources
Version 7.759 2022.08.07
• Stability and performance improvements
Version 7.756 2022.08.05
• Stability and performance improvements
Version 7.754 2022.07.31
• Accessibility improvements
Version 7.752 2022.07.29
• Improved presets for 'Column'
Version 7.750 2022.07.27
• Improved functions for 'Dataset'
Version 7.740 2022.07.25
• Stability and performance improvements
Version 7.739 2022.07.24
• Improved functions for 'Interface Data Environment'
• Improved presets for 'Panel'
Version 7.712 2022.07.11
• Support for new resources
Version 7.711 2022.07.10
• Performance improvements
Version 7.709 2022.07.06
• Improved functions for 'Dataset'
Version 7.654 2022.06.28
• Improved functions for 'Panel'
Version 7.653 2022.06.27
• Stability and performance improvements
Version 7.652 2022.06.27
• Stability and performance improvements
Version 7.651 2022.06.27
• Support for new resources
Version 7.650 2022.06.26
• Improved functions for 'Dataset Segment'
Version 7.601 2022.06.20
• Improved graphics
Version 7.600 2022.06.20
• Accessibility improvements
Version 7.590 2022.06.15
• Performance improvements
Version 7.560 2022.05.23
• Accessibility improvements
Version 7.550 2022.05.23
• Accessibility improvements
Version 7.540 2022.05.15
• Accessibility improvements
Version 7.530 2022.05.14
• Accessibility improvements
Version 7.520 2022.04.18
• New 'TPO' parameter for 'Evaluation Column'
• Improved functions for 'Interface Data Environment'
Version 7.509 2022.04.06
• Accessibility improvements
Version 7.508 2022.04.04
• Support for new resources
Version 7.507 2022.04.03
• Accessibility improvements
Version 7.506 2022.03.08
• Accessibility improvements
Version 7.504 2022.03.04
• Improved functions for 'Style Indication'
Version 7.502 2022.03.03
• Performance improvements
Version 7.501 2022.03.03
• Stability and performance improvements
Version 7.499 2022.03.02
• Improved functions for 'Text'
Version 7.498 2022.03.02
• New 'Size' parameters for 'Style Main' and 'Style Column'
Version 7.495 2022.03.01
• Improved presets for 'Column'
Version 7.490 2022.02.27
• New 'Volume' and 'Price Level' parameters for 'Evaluation'
• Improved functions for 'Style Main'
• Improved presets for 'Dataset'
Version 7.410 2022.02.25
• Improved functions for 'Style Column'
• Fix for multi timeframe data load issue on platform restart
Version 7.405 2022.02.22
• New 'Actual Price Level' preset for 'Panel'
Version 7.400 2022.02.22
• New 'Price Level Grid' parameter for 'Dataset'
Version 7.370 2022.01.06
• Support for new resources
• Improved graphics
Version 7.360 2021.12.11
• New 'Area' option for 'Indication Column'
• New 'Volume' parameter for 'Evaluation Column'
Version 7.350 2021.12.09
• Support for new resources
• Improved 'Market Profile (TPO) - Histogram' option for 'Main'
Version 7.340 2021.12.06
• New 'History' parameter for 'Dataset'
• New 'Padding' parameter for 'Style Column'
• Accessibility improvements
Version 7.310 2021.12.02
• Support for new resources
• Improved functions for 'Main'
Version 7.300 2021.11.30
• New 'Direction' parameter for 'Main'
• New 'Market Profile (TPO) - Histogram' option for 'Main'
• New 'Ray' and 'Color' parameters for 'Style Highlight Line' and 'Style Highlight Background Fill'
• New 'Line' options for 'Highlight Main'
• New 'Label' parameters for 'Style Highlight Line'
• Fix for templates issue
• New 'Anchor' parameter options for 'Panel'
• Improved defaults for 'Evaluation HVN/LVN'
Version 7.190 2021.11.24
• Stability and performance improvements
Version 7.103 2021.11.22
• Accessibility improvements
Version 7.0 2021.11.19
several improvements
Version 6.191 2021.07.06
fixed issue string value parameter (input as file)
Version 6.190 2021.07.05
feature update (data environment)
several improvements
reset parameter default values
Version 6.112 2021.06.27
several improvements
presets update
Version 6.110 2021.06.25
several improvements
Version 6.109 2021.06.24
several improvements
Version 6.108 2021.06.23
several improvements
Version 6.107 2021.06.21
several improvements
Version 6.105 2021.06.20
several improvements
Version 6.101 2021.06.17
several improvements
Version 6.1 2021.06.15
several improvements
Version 6.0 2021.06.12
feature upgrades
reorder parameters
Version 5.912 2021.03.12
extended drawing functions
performance improvements
Version 5.910 2021.03.08
extended data functions (time range method)
Version 5.909 2021.03.07
several improvements
extended data functions (market profile)
Version 5.900 2021.03.04
several improvements
extended data functions (price zone labels)
Version 5.897 2021.03.02
several improvements
extended data functions (volume time statistics)
improvements strategy tester / free demo
reset parameter default values
Version 5.895 2021.03.01
several improvements
fixed issue drawing function (market profile - expanded structure)
presets update (example setting files)
Version 5.893 2021.03.01
extended data functions (time range method)
extended drawing functions (market profile - block marker)
reorder parameters
Version 5.845 2021.02.27
several improvements
user manual update
Version 5.843 2021.02.27
extended drawing functions (highlight option)
Version 5.842 2021.02.27
performance improvements
presets update (example setting files)
reset parameter default values
Version 5.839 2021.02.26
several improvements
Version 5.838 2021.02.26
extended data functions (session filter)
Version 5.833 2021.02.25
several improvements
extended drawing functions (update rates)
Version 5.830 2021.02.24
feature upgrade
extended data functions (volume time statistics - segment)
Version 5.821 2021.02.23
fixed issue drawing function (vp scale by chart)
Version 5.820 2021.02.23
extended drawing functions
improvements strategy tester / free demo
Version 5.810 2021.02.22
extended data functions (time statistics option)
Version 5.809 2021.02.22
several improvements
presets update (example setting files)
Version 5.807 2021.02.21
reset parameter default values
performance improvements
Version 5.806 2021.02.21
several improvements
Version 5.802 2021.02.19
several improvements
Version 5.800 2021.02.18
extended drawing functions
bug fixes and performance improvements
presets update (chart color schemes)
reset parameter default values
Version 5.652 2021.02.17
several improvements
Version 5.641 2021.02.14
extended data functions (market profile - dynamic)
presets update (built-in)
user manual update
Version 5.631 2021.02.12
several improvements
presets update (example setting files)
Version 5.622 2021.02.10
several improvements
Version 5.621 2021.02.10
several improvements
extended data functions (volume time statistics - segment)
Version 5.617 2021.02.08
several improvements
Version 5.614 2021.02.08
several improvements
presets update (setting files)
Version 5.611 2021.02.08
extended data functions (time range option)
Version 5.606 2021.02.06
several improvements
Version 5.604 2021.02.04
reset parameter default values
Version 5.603 2021.02.04
performance improvements
Version 5.601 2021.02.03
extended drawing functions (vwap)
Version 5.598 2021.02.03
several improvements
reset parameter default values
Version 5.596 2021.02.03
several improvements
Version 5.593 2021.02.01
several improvements
Version 5.590 2021.02.01
extended drawing functions (volume time statistics - mtf)
presets update (setting files)
Version 5.521 2021.01.28
performance improvements
Version 5.517 2021.01.28
several improvements
extended data functions (range bar)
Version 5.514 2021.01.28
several improvements
Version 5.510 2021.01.28
extended data functions (volume time statistics - mtf)
extended drawing functions (market profile)
Version 5.490 2021.01.27
extended data functions (market profile)
extended drawing functions (volume time statistics)
Version 5.460 2021.01.26
several improvements
Version 5.452 2021.01.25
several improvements
extended data functions (time range option)
Version 5.450 2021.01.25
performance improvements
extended data functions
Version 5.218 2021.01.24
several improvements
extended data functions (update rates)
user manual update
Version 5.208 2021.01.23
reset parameter default values
user manual update
presets update (setting files)
Version 5.207 2021.01.22
several improvements
presets update (setting files)
Version 5.206 2021.01.22
presets update (setting files)
Version 5.205 2021.01.22
reset parameter default values
extended drawing functions (line highlights)
Version 5.204 2021.01.21
extended drawing functions (mp marker block)
Version 5.203 2021.01.18
extended data functions (market profile - dynamic)
Version 5.202 2021.01.18
extended data functions (time range option)
Version 5.201 2021.01.17
presets update (built-in)
improvements strategy tester / free demo
Version 5.199 2021.01.16
user manual update
Version 5.198 2021.01.16
improvements strategy tester / free demo
Version 5.197 2021.01.16
several improvements
extended data functions (market profile)
Version 5.195 2021.01.15
several improvements
extended data functions (session filter)
Version 5.193 2021.01.13
several improvements
resources update
Version 5.192 2021.01.10
user manual update
presets update (setting files)
Version 5.191 2021.01.09
several improvements
user manual update
Version 5.190 2021.01.08
several improvements
reset parameter default values
presets update (setting files)
Version 5.163 2020.07.08
several improvements
reset parameter default values
Version 5.162 2020.07.07
several improvements
Version 5.161 2020.05.04
extended data functions
performance improvements
Version 5.159 2020.05.03
feature update
performance improvements
Version 5.152 2020.05.01
several improvements
Version 5.150 2020.05.01
feature upgrade
extended data functions (highlight method)
presets update (setting files)
Version 5.141 2020.04.30
several improvements
Version 5.140 2020.04.30
feature update
Version 5.137 2020.04.29
extended data functions (time range segmentation method)
Version 5.135 2020.04.28
extended data functions (time range update rate)
performance improvements
Version 5.134 2020.04.27
performance improvements
Version 5.133 2020.04.27
several improvements
Version 5.132 2020.04.21
several improvements
Version 5.131 2020.04.20
several improvements
Version 5.130 2020.04.20
extended drawing functions (mp marker block size scale non-uniform)
reset parameter default values
presets update (setting files)
Version 5.120 2020.04.18
feature upgrade
extended data functions (time range segmentation method)
reset parameter default values
presets update (setting files)
Version 5.118 2020.04.14
extended data functions (time range segmentation method)
presets update (setting files)
Version 5.116 2020.04.13
several improvements
presets update (setting files)
Version 5.115 2020.04.13
extended data functions (time range option)
Version 5.113 2020.04.10
extended data functions (time range options and update rate)
reset parameter default values
presets update (setting files)
Version 5.112 2020.04.04
presets update
Version 5.110 2020.04.03
extended drawing functions
reset parameter default values
Version 5.109 2020.04.02
feature update
reset parameter default values
presets update (setting files)
Version 5.108 2020.03.31
performance improvements
reset parameter default values
Version 5.107 2020.03.30
feature update
Version 5.106 2020.03.29
extended data functions
Version 5.105 2020.03.27
presets update
chart script update
Version 5.104 2020.03.27
several improvements
Version 5.103 2020.03.25
feature upgrade
reset parameter default values
presets update
Version 5.99 2020.03.16
several improvements
Version 5.98 2020.03.15
extended data functions
extended drawing functions
Version 5.97 2020.03.14
presets update (built-in)
Version 5.96 2020.03.13
several improvements
Version 5.95 2020.03.12
several improvements
Version 5.94 2020.02.17
several improvements
Version 5.93 2020.02.10
extended data functions
performance improvements
Version 5.91 2020.02.09
extended data functions
Version 5.90 2020.02.09
several improvements
reset parameter default values
presets update
Version 5.89 2020.02.08
several improvements
Version 5.88 2020.02.05
performance improvements
Version 5.87 2020.02.05
presets update (built-in)
Version 5.86 2020.02.05
several improvements
Version 5.85 2020.02.05
several improvements
reset parameter default values
presets update
Version 5.84 2020.02.04
several improvements
Version 5.83 2020.02.04
extended data functions
Version 5.82 2020.02.04
several improvements
Version 5.81 2020.02.03
feature update
extended data functions
Version 5.78 2020.02.01
feature update
extended data functions
extended drawing functions
reset parameter default values
presets update
Version 5.76 2020.01.31
several improvements
reset parameter default values
Version 5.75 2020.01.30
reset parameter default values
Version 5.74 2020.01.30
feature updates
extended data functions
extended drawing functions
reset parameter default values
presets update
Version 5.65 2020.01.22
feature upgrade
extended drawing functions
presets update
Version 5.62 2020.01.21
performance improvements
presets update
Version 5.61 2020.01.21
performance improvements
presets update
Version 5.60 2020.01.21
feature updates
extended drawing functions
reset parameter default values
presets update
Version 5.57 2020.01.19
several improvements
Version 5.56 2020.01.19
feature update
extended drawing functions
Version 5.54 2020.01.19
performance improvements
Version 5.53 2020.01.18
feature upgrade
Version 5.52 2020.01.18
performance improvements
Version 5.49 2020.01.17
several improvements
Version 5.47 2020.01.17
feature updates
extended drawing functions
extended data functions
performance improvements
reset parameter default values
Version 5.45 2020.01.16
performance improvements
Version 5.40 2020.01.15
feature update
extended drawing functions
reset parameter default values
presets update
Version 5.38 2020.01.14
feature update
extended data functions
reset parameter default values
Version 5.37 2020.01.13
performance improvements
Version 5.36 2020.01.13
feature update
Version 5.35 2020.01.12
several improvements
reset parameter default values
Version 5.34 2020.01.11
several improvements
Version 5.33 2020.01.10
feature upgrade
extended data functions
extended drawing functions
reset parameter default values
presets update
Version 5.27 2020.01.08
feature upgrade
extended data functions
extended drawing functions
reset parameter default values
presets update
Version 5.24 2020.01.06
feature upgrade
extended data functions
extended drawing functions
reset parameter default values
presets update
Version 5.22 2020.01.05
performance improvements
Version 5.21 2020.01.04
feature upgrade
extended drawing functions
Version 5.20 2020.01.04
several improvements
Version 5.19 2020.01.03
several improvements
reset parameter default values
presets update
Version 5.18 2020.01.02
several improvements
Version 5.17 2020.01.02
reset parameter default values
Version 5.16 2020.01.02
feature upgrade
extended data functions
extended drawing functions
Version 5.15 2019.12.30
feature upgrade
Version 5.14 2019.12.28
performance improvements
Version 5.13 2019.12.27
several improvements
Version 5.12 2019.12.27
feature updates
extended data functions
several improvements
reset parameter default values
Version 5.10 2019.12.24
explicitly set encoding for string conversion operations
Version 5.8 2019.12.24
feature update
reset parameter default values
Version 5.7 2019.12.22
feature upgrade
parameters update
Version 5.6 2019.12.21
feature upgrade
several improvements
reset parameter default values
presets update
Version 5.5 2019.12.20
extended drawing functions
reset parameter default values
Version 5.4 2019.12.20
extended drawing functions
Version 5.3 2019.08.01
feature update
extended data functions
Version 5.2 2019.07.20
feature update
Version 5.0 2019.07.19
final checks
Version 4.102 2019.07.11
feature update
Version 4.101 2019.07.09
feature update
Version 4.99 2019.07.08
several improvements
Version 4.98 2019.07.07
feature upgrade
various feature updates
extended drawing and data functions
reset parameter default values
Version 4.96 2019.06.20
several improvements
Version 4.95 2019.06.20
several improvements
Version 4.93 2019.06.14
feature update
Version 4.92 2019.06.14
several improvements
Version 4.90 2019.06.13
reset parameter default values
Version 4.89 2019.06.13
feature upgrades
Version 4.78 2019.06.09
various feature updates
reset parameter default values
Version 4.74 2019.06.07
extended drawing functions
Version 4.71 2019.06.06
extended drawing functions
performance improvements
Version 4.70 2019.06.05
feature update
Version 4.69 2019.06.05
several improvements
Version 4.67 2019.06.04
performance improvements
Version 4.66 2019.06.04
feature update
several improvements
Version 4.63 2019.06.02
several improvements
Version 4.62 2019.06.02
extended drawing functions
Version 4.61 2019.06.02
extended drawing functions
performance improvements
Version 4.58 2019.05.31
several improvements
reset parameter default values
Version 4.57 2019.05.31
feature upgrade
extended drawing functions
Version 4.45 2019.05.30
feature update
several improvements
Version 4.41 2019.05.27
various feature updates and upgrades
extended drawing and data functions
performance improvements
reset parameter default values
Version 4.1 2019.05.22
extended data functions
Version 4.0 2019.05.21
various feature updates
extended drawing functions
reset parameter default values
Version 3.106 2019.05.21
several improvements
Version 3.104 2019.05.19
feature upgrade
various feature updates
reset parameter default values
Version 3.98 2019.05.17
feature upgrade
Version 3.97 2019.05.16
several improvements
updated various parameter defaults
Version 3.96 2019.05.16
performance improvements
extended drawing functions
Version 3.95 2019.05.15
feature upgrade
Version 3.93 2019.05.15
various feature updates
reset parameter default values
Version 3.91 2019.05.14
several improvements
Version 3.89 2019.05.13
various feature updates
reset parameter default values
Version 3.87 2019.05.13
updated various parameter defaults
Version 3.86 2019.05.13
feature upgrade
various feature updates
reset parameter default values
Version 3.61 2019.05.10
several improvements
Version 3.59 2019.05.06
various feature updates
reset parameter default values
Version 3.57 2019.05.02
several improvements
Version 3.56 2019.04.29
various feature updates
Version 3.54 2019.04.29
several improvements
Version 3.53 2019.04.29
feature upgrade
Version 3.51 2019.04.26
feature upgrade
Version 3.48 2019.04.26
various feature updates
Version 3.44 2019.04.24
performance improvements
Version 3.43 2019.04.24
several improvements
reset parameter default values
Version 3.42 2019.04.23
feature upgrade
Version 3.36 2019.04.21
feature upgrade
Version 3.33 2019.04.20
performance improvements
Version 3.32 2019.04.20
several improvements
reset parameter default values
Version 3.31 2019.04.20
feature upgrade
Version 3.29 2019.04.19
feature upgrade
Version 3.28 2019.04.18
various feature updates
Version 3.27 2019.04.17
extended drawing functions
Version 3.26 2019.04.17
performance improvements
Version 3.25 2019.04.16
performance improvements
Version 3.24 2019.04.16
several improvements
Version 3.23 2019.04.16
various feature updates
Version 3.22 2019.04.15
performance improvements
Version 3.21 2019.04.15
feature upgrade
Version 3.17 2019.04.14
several improvements
Version 3.16 2019.04.14
various feature updates
reset parameter default values
Version 3.15 2019.04.13
several improvements
Version 3.13 2019.04.13
performance improvements
Version 3.11 2019.04.12
feature upgrade
various feature updates
Version 3.7 2019.04.10
several improvements
Version 3.5 2019.04.08
various feature upgrades
Version 3.1 2019.04.05
changed various parameter defaults
Version 3.0 2019.04.05
various feature upgrades
performance improvements
Version 2.49 2019.04.04
various feature updates
Version 2.44 2019.04.03
feature upgrade
Version 2.41 2019.04.03
feature upgrade
Version 2.39 2019.04.01
feature upgrade
Version 2.37 2019.04.01
several improvements
Version 2.36 2019.04.01
various feature updates
Version 2.34 2019.03.30
several improvements
Version 2.33 2019.03.29
various feature updates
Version 2.32 2019.03.28
several improvements
Version 2.31 2019.03.26
feature upgrade
Version 2.30 2019.03.26
several improvements
Version 2.26 2019.03.22
various feature upgrades
Version 2.24 2019.03.20
extended data functions
Version 2.22 2019.03.20
extended drawing functions
Version 2.21 2019.03.19
performance improvements
Version 2.20 2019.03.19
various feature upgrades
Version 2.18 2019.03.18
changed parameter 'Buffer Limit' default to max
Version 2.17 2019.03.18
several improvements
Version 2.16 2019.03.18
several improvements
Version 2.15 2019.03.17
various feature upgrades
Version 2.3 2019.02.26
extended drawing functions
Version 2.1 2019.02.24
added input parameter "Draw Height Subtract"
added input parameter "Draw Anchor, Time"
Version 2.0 2019.02.22
performance improvements
extended drawing functions
Version 1.9 2019.02.22
performance improvements
extended drawing functions
added input parameter "Border Merge"
Version 1.8 2019.02.21
fixed incorrect link properties
Version 1.7 2019.02.20
added new feature "Snap Time"
Version 1.5 2019.02.18
improvements strategy tester
various feature updates
Version 1.3 2019.02.15
stability and performance improvements
fixed issue strategy tester
Version 1.2 2019.02.12
updated description and link properties
Version 1.1 2019.02.11
stability and performance improvements
fixed issue initial drawing