• Übersicht
  • Bewertungen
  • Diskussion (2)
  • Neue Funktionen

KT Advance Ichimoku

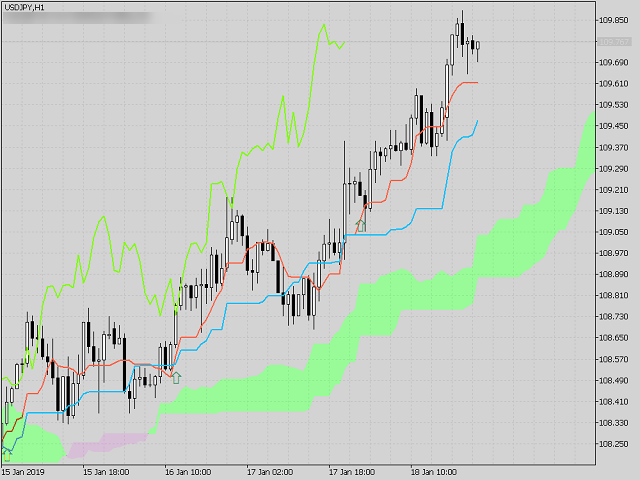
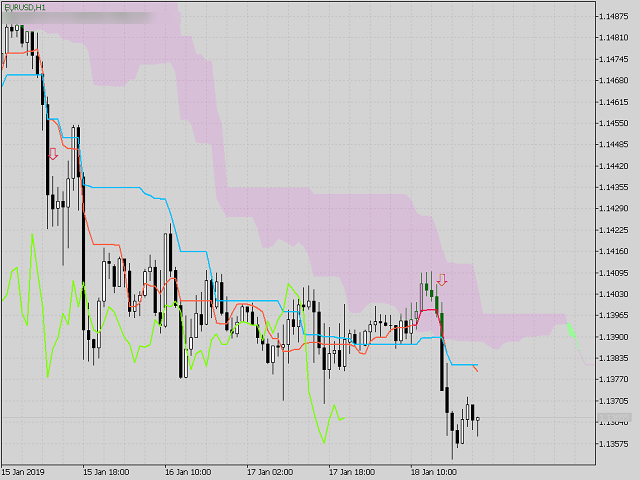
KT Advance Ichimoku plot the arrows and provide alerts for the four trading strategies based on Ichimoku Kinko Hyo indicator. The generated signals can be filtered by other Ichimoku elements. 


Four Strategies based on the Ichimoku Kinko Hyo


1.Tenkan-Kijun Cross

  • Buy Arrow: When Tenkan-Sen cross above the Kijun-Sen.
  • Sell Arrow: When Tenkan-Sen cross below the Kijun-Sen.

2.Kumo Cloud Breakout

  • Buy Arrow: When price close above the Kumo cloud. 
  • Sell Arrow: When price close below the Kumo cloud.

3.Chikou-Sen Breakout

  • Buy Arrow: When Chikou-Sen breaks above the last 26 period price range.
  • Sell Arrow: When Chikou-Sen breaks below the last 26 period price range.

4.Kumo Cloud Future Twist

  • Buy Alert: When the future Kumo Cloud turns bullish.
  • Sell Alert: When the future Kumo cloud turns bearish.


Input Parameters

  • History Bars: Set the value of max. bars to consider for indicator calculation.

  • ----- Set Ichimoku Parameters -----
  • Set the value for Tenkan-sen, Kijun-sen and Senkou Span

  • ----- Turn ON/OFF the Ichimoku Signals -----
  • Tenkan-Kijun Cross:  Off | Without cloud confirmation | With cloud confirmation
  • Kumo Cloud Breakout:  Off | Without Tenkan-Kijun confirmation | With Tenkan-Kijun confirmation
  • Chikou-sen Breakout: Off | Without cloud confirmation | With cloud confirmation
  • Kumo Cloud Future Twist: true/false (alert only)
  • Rest of the inputs are self-explanatory.
Empfohlene Produkte
Robo do curso freedom
Renan De Souza Quinelato
1 (1)
CRIANDO OPORTUNIDADE COM ROBÔ INVESTIDOR O curso “Criando Oportunidade com Robô Investidor” é destinado para pessoas que acreditam serem capazes de gerar suas próprias oportunidades no mercado digital , através da programação de sistemas automatizados você será capaz de criar seus próprios robôs e executar suas operações operando seu próprio capital ou de terceiro, além de descobrir onde e como vender seus robôs.
FREE
HLC bar MT5 Wyckoff
Eduardo Da Costa Custodio Santos
Der Indikator "HLC_bar_MT5 Wyckoff" für MT5 wurde erstellt, um die Analyse zum Zeitpunkt des Handels zu erleichtern. Die HLC Bar wurde von Richard Wyckoff verwendet und wird derzeit häufig in "VSA" -Operationen verwendet. Wyckoff stellte fest, dass die Verwendung von High, Low und Close den Graphen viel sauberer und einfacher zu analysieren machte. Der Indikator "HLC_bar_MT5 Wyckoff" ermöglicht: # Ändern Sie die Balkenbreite; # Lassen Sie die Leiste dieselbe Farbe; # Und markieren Sie die Bar, d
30 USD
EA Loc Trade
Francisco Alexandre Da Cruz Junior
EA developed to operate at specific price locations on the chart, in relation to a TimeFrame higher than the current one. After defining the direction of positions through locations, the EA seeks to identify candlestick patterns as a trigger to open a position. The parameters being: StartHour=00; //Start hour(operations) StartMinute=00; //Start minute(Operations); FinalHour=17; //End Hour(Operations) FinalMinute=00; //End Minutes(Operations) CloseHour=18; //Position Closing Hour (open operations
500 USD
To get access to MT4 version please contact via private message - This is the exact conversion from TradingView: "Supertrend" by " KivancOzbilgic ". - This is a popular version of DIDI index on tradingview. - This is a light-load processing and non-repaint indicator. - Buffers are available for processing in EAs. - You can message in private chat for further changes you need. Thanks for downloading
40 USD
Indicador que calcula o volume real e a porcentagem da agressão vencedora num determinado período de tempo. Podendo o usuário escolher entre as opções : 3 vezes por segundo ; 2 vezes por segundo ; 1 vez por segundo ; 1 vez a cada 2 segundos ; Exemplo 1: Se o usuário optar pela opção 2 vezes por segundo, o indicador vai mostrar na tela 2 vezes em um segundo a quantidade de contratos negociados (volume real) e quantos por cento a agressão vencedora foi superior a perdedora nesse período. Ou seja,
200 USD
The ChannelTrend indicator is a trading system, which allows to analyze the market from various aspects of a technical analysis. The first aspect is a price channel, which is built in an automatic mode and enables a trader to see the main direction of price movement. It also enables you to analyze the market using a channel strategy (breakout and bounce off channel lines). Block 2 represents SAR system that gives general information about micro-movements in the market and serves as a confirmatio
39 USD
Market Entropy
Elian Isaac Rodrigues Oliveira
The Market Entropy indicator was created to measure the order of price changes over time. consists of two lines and a histogram where the lines are responsible for measuring the price movement and the histogram measures the strength of the analyzed movement. It can be used to find a trend (Image 2) or price reversal (Image 3). Blue Line: Buy Entropy Red Line: Sell Entropy Historgram: Market Entropy Interpretation: Buy Line above the Sell Line indicates that in the analyzed period buyers wer
30 USD
Future of Ea: We make this Ea on scalping strategy for short term trend. Ea is able to works on any Currency pair and any time chart frames but profits and risk are depends on time chart.We provide you full support to setup ea on his best time chart according to currency pair. Contact us by sending massage in mql5 chat for Ea setups. We also stored our set files in comment area for easy use for you.This Ea's Mt4 version is also available in Mt4 expert area. Using of Ea: Indicator settings is o
101 USD
Impulse fractals indicator - is counter-trend oriented complex market fractal pattern.  Market creates bull/bear impulse, trend starts, fractals on impulsed wave are an agressive pullback signals. Buy arrow is plotted when market is bearish and it's impulse showed up-side fractal, and sell arrow is plotted when market is bullish and it's impulse showed dn-side fractal. Main indicator's adjustable inputs : impulsePeriod - main period of impulse histogram  filterPeriod  - smoothes impulse accordi
199 USD
Stormer RSI 2
Ricardo Rodrigues Lucca
This strategy was learned from Stormer to be used on B3. Basically, 15 minutes before closing the market, it will check RSI and decided if it will open an position. This strategy do not define a stop loss. If the take profit reach the entry price it will close at market the position. The same happens if the maximal number of days is reached. It is created to brazilian people, so all configuration are in portuguese. Sorry Activations allowed have been set to 50.
99 USD
Trend scalper is   a scalping expert advisor that mainly trades the trend and major breakouts, normally opens trades on a daily basis. It secures the profits using a trailing stop. All the opened trades come with a fixed stop-loss and take-profit. To maximize profits you can set on the settings a max daily loss and profit goal. Trend scalper works ideally with major pairs such as EURUSD, GBPUSD, XAUUSD on H1 timeframe.  Trend scalper  does NOT use any dangerous trading strategies that can bl
899 USD
A professional tool for trading - the divergence indicator between the WPR and the price, which allows you to receive a signal about a trend reversal in a timely manner or catch price pullback movements (depending on the settings). The indicator settings allow you to adjust the strength of the divergence due to the angle of the WPR peaks and the percentage change in price, which makes it possible to fine-tune the signal strength. The indicator code is optimized and is tested very quickly as par
37 USD
Helios Gold
Duc Phong Ha
2 (1)
Discount 20% within 7 days as request of someone from 7 Oct - Helios Gold Trade for two-way scalping Trade with the trend and use a fairly large SL, so when Gold is likely to reverse, it will open a hedging trade. - Use the optimal analysis tools to confirm the trend of gold. - no Grid, no martingale - H1 time frame - Defauls Setting - The optimal capital for Helios is 0.01 for every $500. Use accounts with low spreads for accurate indicators. - link live signal:  https://www.mql5.com/en/signals
1 500 USD
EA Alpha Expert
Jonatas Da Silva Cruz
Eu tentei muitas coisas na negociação forex no passado e aprendi muito nos últimos 3,5 anos. Tentei   varias  ferramentas para negociação manual e nao tive muito sucesso. Sempre fui fascinado com o mercado forex, . A integração dos dados de volume é uma característica única e aumenta muito a qualidade das decisões comerciais do Expert Advisor. E sim, você tem que lembrar que os resultados do backtest não são os mesmos que resultados ao vivo. Mas aqui eles estão muito próximos. agora o único Exp
50 USD
ScriptBot Global
Fabio Luis Pretti
4.33 (3)
ScriptBot is a multi-strategy robot developed to be practical and robust, with ScriptBot you are able to create different strategies of your own, install up to 51 indicators of your liking and build your own trigger using simple logic expressions. AVISO:    Versão brasileira:  mql5.com/pt/market/product/67311 Below we will tell you a little about the structure: Indicators:   ScriptBot does not have indicators in its coding, this means that you have full control of which indicators you want to
FREE
ROMAN5 Time Breakout Indicator automatically draws the boxes for daily support and resistance breakouts. It helps the user identifying whether to buy or sell. It comes with an alert that will sound whenever a new signal appears. It also features an email facility. Your email address and SMTP Server settings should be specified in the settings window of the "Mailbox" tab in your MetaTrader 5. Blue arrow up = Buy. Red arrow down = Sell. You can use one of my Trailing Stop products that automatical
FREE
Eine der Zahlenfolgen heißt „Forest Fire Sequence“. Es wurde als eine der schönsten neuen Sequenzen anerkannt. Sein Hauptmerkmal ist, dass diese Sequenz lineare Trends vermeidet, selbst die kürzesten. Diese Eigenschaft bildete die Grundlage dieses Indikators. Bei der Analyse einer Finanzzeitreihe versucht dieser Indikator, alle möglichen Trendoptionen abzulehnen. Und nur wenn er scheitert, dann erkennt er das Vorhandensein eines Trends und gibt das entsprechende Signal. Dieser Ansatz ermöglicht
30 USD
Atr Suporte Resistencia
Leandro Henrique Lopes
Indicador baseado em cálculo black box derivado do indicador ATR e Volatilidade média. Calcula para o dia atual, a partir do fechamento anterior, o distanciamento padrão dos períodos selecionáveis em dias.  É possível plotar até 5 períodos no gráfico. Nas configurações (1= D-1), 2(D-2) etc... O indicador permite plotar até o histórico 50 dias atrás.  Uma ótima ferramenta que pode ser utilizada de duas formas: Para operar distorção do preço como suportes e resistências (contra tendência); ou util
199 USD
Forca Relativa
Edson Cavalca Junior
5 (4)
The robot issues buy/sell signals based on the setting of the RELATIVE STRENGTH INDICATOR Know our products    This Expert Advisor (EA) works on HEDGE (Forex, etc.) and NETTING (Bovespa, etc.) accounts, but manages only one position at a time. The  filters  are used to increase the accuracy  and if activated and not met your criteria, the order is not sent. 5 FILTERS available: ADX indicator; ADX + (DM +) and - (DM-) directional indicator; Closing price of the previous candle above or bel
FREE
Cls PRO
Marco Aurelio Santos Costa
With CLS you WILL NOT LOSE, as long as you have a professional capital management. It is impossible to make a loss with CLS, why?  It works by buying and selling two positively correlated currency pairs. This means that when PAR 1 goes up PAR 2 also goes up, however, there is something that happens in the market that is the distortion of the price ratio. That is, when the PAR 1 rises and PAR 2 falls, that's when we enter, buying Par 2 and selling Par 1.  This seems simple but it is not, y
999.99 USD
The Expert Advisor (EA) is based on the Dynamic Linear Regression indicator ( https://www.mql5.com/en/market/product/49702 ). User inputs: Number of candles is considered when calculating linear regression; Distance to the top line; Distance to the bottom line; Stop the loss of. The EA executes purchase and sale orders in the market when the value of a line, higher or lower, is reached at the current price, when the lower line is reached, a buy order at market is executed and when the upper l
FREE
Тем, кто изучил книги Билла Вильямса "Новые измерения в биржевой торговле" и "Торговый Хаос (второе издание)" и пробовал торговать по этим методикам, становится ясно, что стандартного набора индикаторов недостаточно для полноценной работы. Индикатор  Trading Chaos Map  рисует "карту рынка", позволяя вам видеть графики так же, как автор трилогии. В параметрах предусмотрены опции включения и отключения каждого сигнала. Вы можете использовать ту или иную методику, либо использовать их вместе. Может
150 USD
Jakarta mt5
Mikhail Mitin
3 (2)
Main: Not martingale, not a grid; Working on all symbols; Signals: There is a good rational algorithm. Work of two indicators:  Stochastic   and  OsMA  (you can set a separate Timeframe for each indicator) Stop Loss/Take Profit: There is a good money management system (there are several type for trailing stop loss); There is virtual levels of Stop Loss / Take Profit; There is smart lot (percent by risk) or fix lot Important: EA can work on closed candles, and on current candles; Quickly o
FREE
Robo Nuvem
Edson Cavalca Junior
The robot uses one of the most used indicators in Asia: * ICHIMOKU CLOUD * There are two trading strategies: Crossing of Tenkan and Kijun lines and; Kumo lines crossing. Know our products    Position openings are based on the parameters identified as signals, if you activate all the robot will issue a trading order only if the number of signals is greater than the minimum stipulated by the user. This Expert Advisor (EA) works on HEDGE (Forex, etc.) and NETTING (Bovespa, etc.) accou
30 USD
BBTrend is a relatively new indicator developed by John Bollinger to work with Bollinger Bands. It is one of only a few indicators that can signal both strength and direction making it a very valuable tool for traders. Calculations The calculations are fairly simple. The default periods of 20 and 50 are shown, but these can be changed through the parameters. Lower = MathAbs(lowerBB(20) - lowerBB(50)) Upper = MathAbs(upperBB(20) - upperBB(50)) BBTrend = (lower - upper) / middleBB(20) Interpr
FREE
Stochastic R
Antony Augustine
Stochastic  Reversal  allows you to recognize reversals professionally. Stochastic Indicator: This technical indicator was developed by George Lane more than 50 years ago. The reason why this indicator survived for so many years is because it continues to show consistent signals even in these current times. The Stochastic indicator is a momentum indicator that shows you how strong or weak the current trend is. It helps you identify overbought and oversold market conditions within a trend.  Rules
30 USD
GBot 8G 4G OG
James Rogers
5 (1)
GBot is an Expert Advisor (EA) that uses sophisticated algorithms to trade on trends or reverse trends in the forex market. With four different algorithms to choose from, traders have the flexibility to customize the strategy to their specific needs and preferences. One of the standout features of GBot is its ability to work with multiple trading pairs, making it a versatile tool for traders looking to diversify their portfolio. While the bot is particularly effective with the XAU/USD pair, it c
600 USD
Trend indicator based on the ADX / ADXWilder indicator The indicator shows trend areas using ADX or ADXWilder indicator data. How the indicator works: if PDI is greater than NDI, then it`s bullish movement; if PDI is less than NDI, then it`s bearish movement; if ADX is less than or equal to the filter value specified in the parameters, then there is no movement state. Input parameters of the indicator: Calculate Timeframe - timeframe for calculation; ADX Type - type of ADX calculation
FREE
ArrowZigZag EA
Wenfei Huang
2 (4)
Dies ist ein EA basierend auf Arrowzigzag und der benutzerdefinierten Anzeige der Pfeilmarkierungsreihenfolge. Wenn der grüne Pfeil oben ist, machen Sie mehrere Aufträge. Wenn der rote Pfeil unten ist, kürzen Sie die Reihenfolge. Dies ist eine gute Implementierung des klassischen EA basierend auf Zickzack-Index. Der Pfeil wird verwendet, um den einzelnen Punkt zu markieren, der eine hohe Genauigkeit hat. Dann wird es geschrieben, um die einzelne Richtung nach dem Pfeil zu markieren. E
35 USD
LineaMMSuavizado
Cesar Juan Flores Navarro
Se considera la secuencia de la serie Fibonacci (2,3,5,8,13) que sera multiplicado por un periodo (11 o 33 o 70 etc.), de las 5 lineas se sacara una sola que sera contendrá el máximo y mínimo de las 5, a esta linea se le aplicara un suavizador de 3....y a esta linea suavizada se le volverá a aplicar un suavizador de 3. obteniéndose 2 lineas suavizadas. A simple vista se ve las intersecciones que hacen las lineas que pueden ser usadas para comprar o vender. Cambien se puede usar con apoyo de otro
120 USD
Käufer dieses Produkts erwarben auch
Dies ist ein Indikator für MT5, der genaue Signale für den Einstieg in einen Handel ohne Repainting (Neuzeichnen) liefert. Er kann auf alle Finanzwerte angewendet werden: Forex, Kryptowährungen, Metalle, Aktien, Indizes. Er liefert ziemlich genaue Schätzungen und sagt Ihnen, wann es am besten ist, eine Position zu eröffnen und zu schließen. Sehen Sie sich das Video (6:22) mit einem Beispiel für die Verarbeitung nur eines Signals an, das sich für den Indikator gelohnt hat! Die meisten Händler ver
125 USD
Gold Stuff mt5
Vasiliy Strukov
4.97 (92)
Gold Stuff mt5-Ein Trendindikator, der speziell für Gold entwickelt wurde, kann auch auf allen Finanzinstrumenten verwendet werden. Der Indikator wird nicht neu gezeichnet und verzögert sich nicht. Empfohlener Zeitrahmen H1. WICHTIG! Kontaktieren Sie mich sofort nach dem Kauf, um Anweisungen und Bonus zu erhalten! DATEN Draw Arrow - inkl.aus. zeichnen von Pfeilen in einem Diagramm. Alerts-inkl.aus.akustische Warnungen. E - mail notification-inkl.aus. benachrichtigungen per E-Mail. Puch-
125 USD
ICT, SMC, SMART MONEY CONCEPTS, SMART MONEY, Smart Money Concept, Support and Resistance, Trend Analysis, Price Action, Market Structure, Order Blocks, BOS/CHoCH,   Momentum Shift, HH/LL/HL/LH,    Fair Value Gap, FVG,  Premium  &   Discount   Zones, Fibonacci Retracement, OTE, Buy Side Liquidity, Sell Side Liquidity, BSL/SSL Taken, Equal Highs & Lows, MTF Dashboard, Multiple Time Frame, BigBar, HTF OB, HTF Market Structure,  Liquidity Voids, Long Wicks, Candle Timer, Fractals, ZigZag, Time Zone
63 USD
Trend Screener Pro MT5
STE S.S.COMPANY
4.97 (36)
Trendindikator, bahnbrechende, einzigartige Lösung für Trendhandel und -filterung mit allen wichtigen Trendfunktionen in einem Tool! Es handelt sich um einen 100 % nicht neu zu malenden Multi-Timeframe- und Multi-Währungs-Indikator, der für alle Symbole/Instrumente verwendet werden kann: Forex, Rohstoffe, Kryptowährungen, Indizes und Aktien. Trend Screener ist ein effizienter Trendfolgeindikator, der Pfeiltrendsignale mit Punkten im Diagramm liefert. Die Funktionen, die im Trendanalysator-Indika
50 USD
AW Trend Predictor MT5
Alexander Nechaev
5 (24)
Die Kombination von Trend- und Aufschlüsselungsebenen in einem System. Ein fortschrittlicher Indikatoralgorithmus filtert Marktrauschen, bestimmt den Trend, Einstiegspunkte sowie mögliche Ausstiegsniveaus. Indikatorsignale werden in einem Statistikmodul aufgezeichnet, das es Ihnen ermöglicht, die am besten geeigneten Tools auszuwählen, die die Wirksamkeit der Signalhistorie zeigen. Der Indikator berechnet Take-Profit- und Stop-Loss-Marken. Handbuch und Anleitung ->   HIER   / MT4-Version ->   H
55 USD
Advanced Supply Demand MT5
Bernhard Schweigert
4.36 (11)
Derzeit 33% Rabatt! Die beste Lösung für jeden Anfänger oder erfahrenen Händler! Dieser Indikator ist ein einzigartiges, qualitativ hochwertiges und erschwingliches Trading-Tool, da wir eine Reihe von proprietären Funktionen und eine neue Formel integriert haben. Mit diesem Update werden Sie in der Lage sein, doppelte Zeitrahmenzonen anzuzeigen. Sie können nicht nur einen höheren TF (Zeitrahmen) anzeigen, sondern sowohl den Chart-TF als auch den höheren TF: SHOWING NESTED ZONES. Alle Supply Dema
199 USD
Blahtech Supply Demand MT5
Blahtech Limited
4.45 (11)
Supply Demand uses previous price action to identify potential imbalances between buyers and sellers. The key is to identify the better odds zones, not just the untouched ones. Blahtech Supply Demand indicator delivers functionality previously unavailable on any trading platform. This 4-in-1 indicator not only highlights the higher probability zones using a multi-criteria strength engine, but also combines it with multi-timeframe trend analysis, previously confirmed swings and engulfing detecto
142 USD
Owl Smart Levels MT5
Sergey Ermolov
5 (1)
Indikator-Leitfaden  |  Owl Smart Levels-Strategie  |   MT4-Version  |  Wie installiert man?   |   FAQ Der Owl Smart Levels Indikator ist ein komplettes Handelssystem innerhalb eines Indikators, der so beliebte Marktanalysetools wie die fortschrittlichen Fraktale von Bill Williams , Valable ZigZag, das die richtige Wellenstruktur des Marktes aufbaut, und Fibonacci-Levels , die die genauen Einstiegslevels markieren, enthält in den Markt und Orte, um Gewinne mitzunehmen. Eine detaillierte Beschre
97 USD
Royal Wave Pro M5
Vahidreza Heidar Gholami
5 (2)
Royal Wave is a Trend-Power oscillator which has been programmed to locate and signal low-risk entry and exit zones. Its core algorithm statistically analyzes the market and generates trading signals for overbought, oversold and low volatile areas. By using a well-designed alerting system, this indicator makes it easier to make proper decisions regarding where to enter and where to exit trades. Features Trend-Power Algorithm Low risk Entry Zones and Exit Zones Predictions for Overbought and Over
129 USD
Der ADR-Umkehrindikator zeigt Ihnen auf einen Blick, wo der Preis derzeit im Verhältnis zu seiner normalen durchschnittlichen Tagesspanne gehandelt wird. Sie erhalten sofortige Benachrichtigungen per Pop-up, E-Mail oder Push, wenn der Preis seine durchschnittliche Spanne und darüber liegende Niveaus Ihrer Wahl überschreitet, sodass Sie schnell in Pullbacks und Umkehrungen einsteigen können. Der Indikator zeichnet horizontale Linien auf dem Chart an den durchschnittlichen täglichen Range-Extreme
49 USD
Werden Sie Breaker Trader und profitieren Sie von Änderungen der Marktstruktur, wenn sich der Preis umkehrt. Der Order Block Breaker Indikator zeigt an, wann sich eine Trend- oder Preisbewegung der Erschöpfung nähert und bereit ist, sich umzukehren. Es weist Sie auf Änderungen in der Marktstruktur hin, die normalerweise auftreten, wenn eine Umkehrung oder ein größerer Rückzug bevorsteht. Der Indikator verwendet eine proprietäre Berechnung, die Ausbrüche und Preisdynamik identifiziert. Jedes
49 USD
Matrix Arrow Indicator MT5
Juvenille Emperor Limited
5 (11)
Matrix Arrow Indicator MT5   ist ein einzigartiger 10-in-1-Trend, der zu   100 % nicht neu gezeichnet   werden kann. Multi-Timeframe-Indikator, der für alle Symbole/Instrumente verwendet werden kann:   Forex ,   Rohstoffe ,   Kryptowährungen ,   Indizes ,   Aktien .  Der  Matrix Arrow Indicator MT5  wird den aktuellen Trend in seinen frühen Stadien bestimmen und Informationen und Daten von bis zu 10 Standardindikatoren sammeln, die sind: Durchschnittlicher Richtungsbewegungsindex (ADX) Rohstoff
75 USD
Market Profile defines a number of day types that can help the trader to determine market behaviour. A key feature is the Value Area, representing the range of price action where 70% of trading took place. Understanding the Value Area can give traders valuable insight into market direction and establish the higher odds trade. It is an excellent addition to any system you may be using. Blahtech Limited presents their Market Profile indicator for the MetaTrader community. Inspired by Jim Dalton’s
142 USD
Royal Scalping Indicator M5
Vahidreza Heidar Gholami
5 (8)
Royal Scalping Indicator is an advanced price adaptive indicator designed to generate high-quality trading signals. Built-in multi-timeframe and multi-currency capabilities make it even more powerful to have configurations based on different symbols and timeframes. This indicator is perfect for scalp trades as well as swing trades. Royal Scalping is not just an indicator, but a trading strategy itself. Features Price Adaptive Trend Detector Algorithm Multi-Timeframe and Multi-Currency Trend Low
149 USD
Das ADR Alert Dashboard zeigt Ihnen auf einen Blick, wo der Preis aktuell im Verhältnis zu seiner normalen durchschnittlichen Tagesspanne gehandelt wird. Sie erhalten sofortige Benachrichtigungen per Pop-up, E-Mail oder Push, wenn der Preis seine durchschnittliche Spanne und darüber liegende Niveaus Ihrer Wahl überschreitet, sodass Sie schnell in Pullbacks und Umkehrungen einsteigen können. Das Dash ist so konzipiert, dass es auf einem leeren Diagramm platziert werden kann und einfach im Hinter
49 USD
Introduction to X3 Chart Pattern Scanner X3 Cherart Pattern Scanner is the non-repainting and non-lagging indicator detecting X3 chart patterns including Harmonic pattern, Elliott Wave pattern, X3 patterns, and Japanese Candlestick patterns. Historical patterns match with signal patterns. Hence, you can readily develop the solid trading strategy in your chart. More importantly, this superb pattern scanner can detect the optimal pattern of its kind. In addition, you can switch on and off individu
250 USD
Automated Trendlines MT5
Georgios Kalomoiropoulos
Trendlinien sind das wichtigste Werkzeug der technischen Analyse im Devisenhandel. Leider zeichnen die meisten Händler sie nicht richtig. Der automatische Trendlinien-Indikator ist ein professionelles Tool für ernsthafte Trader, das Ihnen hilft, die Trendbewegung der Märkte zu visualisieren. Es gibt zwei Arten von Trendlinien Bullische Trendlinien und Bärische Trendlinien. Im Aufwärtstrend wird die Forex-Trendlinie durch die niedrigsten Swing-Punkte der Preisbewegung gezogen. Wenn man m
99 USD
Auto Order Block with break of structure Detect Break of Structure , Mark Order Block and draw Entry / Stop and Risk to Reward lines when Order block is touch by price with Alert. Trend is Manually set to filter signals in a direction by a button on the chart. Entry / Stop and Risk to Reward lines can also be switch on / off by button on chart. Futures Auto Mark Break of Structure Auto Mark Order block Auto Mark higher time frame Point Of  Interest ( POI ) Popup Alert when BoS , Order block
55 USD
Market Structure MT5
Reza Aghajanpour
5 (1)
**   All Symbols   x   All Timeframes   scan just by pressing scanner button ** *** Contact me immediately after the purchase to send you instructions and add you in "Market Structure group" for sharing or seeing experiences with other users. CURRENT PRICE $39..... Future Price $200 Introduction: Market structure is important for both new and professional traders since it can influence the liquidity and price action of a market. It’s also one of the most commonly used techniques to understand tr
39 USD
Strong Support mt5
Vasiliy Strukov
5 (5)
Unterstützungs- und Widerstandsniveaus sind seit langem ein mächtiges Werkzeug für die Marktanalyse. Der Strong Support Indikator baut Unterstützungsniveaus auf lokalen Preistiefs und Widerstandsniveaus auf lokalen Preishochs auf. Meine anderen Entwicklungen finden Sie hier Es wird empfohlen, in Verbindung mit einem Trendindikator wie Gold Stuff zu verwenden, um den Trend zu handeln und gleichzeitig Konsolidierungs- oder Umkehrzonen zu definieren sowie Stop-Loss und Take-Profit auf Unterstü
125 USD
PZ Swing Trading MT5
PZ TRADING SLU
5 (4)
Swing Trading ist der erste Indikator, der Schwankungen in Trendrichtung und mögliche Umkehrschwankungen erkennt. Es wird der in der Handelsliteratur weit verbreitete Baseline-Swing-Trading-Ansatz verwendet. Der Indikator untersucht mehrere Preis- und Zeitvektoren, um die aggregierte Trendrichtung zu verfolgen und erkennt Situationen, in denen der Markt überverkauft oder überkauft ist und zur Korrektur bereit ist. [ Installationsanleitung | Update-Anleitung | Fehlerbehebung | FAQ | Alle Produkte
125 USD
Automatisierte Angebots- und Nachfragezonen der nächsten Generation. Neuer und innovativer Algorithmus, der bei jedem Diagramm funktioniert. Alle Zonen werden dynamisch entsprechend der Preisbewegung des Marktes erstellt. ZWEI ARTEN VON WARNUNGEN --> 1) WENN DER PREIS EINE ZONE ERREICHT 2) WENN EINE NEUE ZONE BILDET WIRD Sie erhalten keinen weiteren nutzlosen Indikator. Sie erhalten eine vollständige Handelsstrategie mit nachgewiesenen Ergebnissen.     Neue Eigenschaften:    
149 USD
PZ Trend Trading MT5
PZ TRADING SLU
3.25 (4)
Trend Trading ist ein Indikator, der so weit wie möglich von den Markttrends profitiert, indem er Pullbacks und Breakouts zeitlich festlegt. Sie findet Handelsmöglichkeiten, indem sie analysiert, was der Preis während etablierter Trends tut. [ Installationsanleitung | Update-Anleitung | Fehlerbehebung | FAQ | Alle Produkte ] Handeln Sie mit Zuversicht und Effizienz an den Finanzmärkten Profitieren Sie von etablierten Trends, ohne ins Wanken zu geraten Profitable Pullbacks, Ausbrüche und vor
125 USD
Stargogs Spike Catcher
Lorenzo Edward Beukes
5 (6)
Stargogs Spike Catcher V3 This Indicator is Developed To milk the BOOM and CRASH indices . Send me Message if you need any help with the indicator.  CHECK OUT THE STARGOGS SPIKE CATCHER EA/ROBOT V3: CLICK HERE ALSO CHECK OUT SECOND TO NONEFX SPIKE CATCHER:   CLICK HERE STARGOGS SPIKE CATCHER V3 WHATS NEW! Brand New Strategy. This is the Indicator you need for 2023. The Indicator Gives you an Entry at a time when conditions are met and you should use TP & SL. New Trendline that changes color in
100 USD
** All Symbols x All Timeframes scan just by pressing scanner button ** ***Contact me after purchase to send you instructions and add you in "123 scanner group" for sharing or seeing experiences with other users. After 15 years of experience in the markets and 3 years of programming, Winner indicator is ready. I would like to share with you! Introduction The 123 Pattern Scanner indicator with a special enhanced algorithm is a very repetitive common pattern finder with a high success rate . Inte
39 USD
PZ Day Trading MT5
PZ TRADING SLU
2.6 (5)
Dieser Indikator erkennt Preisumkehrungen im Zick-Zack, wobei nur Preisaktionsanalysen und ein Donchian-Kanal verwendet werden. Es wurde speziell für den kurzfristigen Handel entwickelt, ohne dass ein Nachlackieren oder ein Backpainting erforderlich ist. Es ist ein fantastisches Werkzeug für clevere Trader, die darauf abzielen, das Timing ihrer Operationen zu verbessern. [ Installationsanleitung | Update-Anleitung | Fehlerbehebung | FAQ | Alle Produkte ] Erstaunlich einfach zu handeln Es bi
125 USD
Trend Scanner mt5 GS
Vasiliy Strukov
5 (6)
Trend Scanner scannt Markttrends aus Multi-Symbolen und Multi-Time-Frames und zeigt sie auf einem beweglichen Panel auf dem Chart an, den er zur Analyse verwendet. Der Händler kann mehrere Paare seiner Wahl zur Anzeige auswählen. Trend Scanner ist ein großartiges Tool, um die Richtung des Trends zu sehen, und kann für den manuellen Handel oder den EA-Handel verwendet werden, indem nur Kauf- oder Verkaufsaufträge gemäß dem Trend zugelassen werden. Echtzeit-Ergebnisse können hier eingesehen wer
125 USD
Sind Sie es leid, Unterstützungs- und Widerstandslinien zu zeichnen? Der Unterstützungswiderstand ist ein Multi-Zeitrahmen-Indikator, der Unterstützungs- und Widerstandslinien mit einer sehr interessanten Wendung automatisch erkennt und zeichnet: Wenn das Preisniveau im Laufe der Zeit getestet wird und seine Bedeutung zunimmt, werden die Linien dicker und dunkler. [ Installationsanleitung | Update-Anleitung | Fehlerbehebung | FAQ | Alle Produkte ] Steigern Sie Ihre technische Analyse über Nacht
99 USD
God win spike system
Israr Hussain Shah
1 (1)
• Non Repaint • DelayNo Lag •Pop Up notification • 98% Verified Accuracy • Real time arrows to catch spikes at least 4-8 bars We forward guide video how milk spikes  We also add in telegram group for better quality help  +see live trading results  https://youtu.be/DCG4CAWlg4I you will see an arrow signal and open trade for spike stop-loss of trade will be 8 or 10 candles if no spike exit you just need to follow spike arrow signals and for more good results follow inst
200 USD
Dieses Dashboard ist ein Warntool zur Verwendung mit dem Indikator für die Umkehrung der Marktstruktur. Sein Hauptzweck besteht darin, Sie auf Umkehrmöglichkeiten in bestimmten Zeitrahmen und auch auf die erneuten Tests der Warnungen (Bestätigung) aufmerksam zu machen, wie es der Indikator tut. Das Dashboard ist so konzipiert, dass es auf einem eigenen Chart sitzt und im Hintergrund arbeitet, um Ihnen Benachrichtigungen zu Ihren ausgewählten Paaren und Zeitrahmen zu senden. Es wurde entwickelt,
49 USD
Weitere Produkte dieses Autors
Use of support and resistance in systematic trading is very subjective. Every trader has their own idea and way to plotting the support and resistance levels on the chart. KT Support and Resistance indicator take out this ambiguity out of the situation and automatically draws support and resistance levels following an algorithmic approach using a unique multi-timeframe analysis. When launched on the chart, It immediately scan the most significant extreme points across all the available timefr
120 USD
ACB Breakout Arrows MT5
KEENBASE SOFTWARE SOLUTIONS
5 (1)
The ACB Breakout Arrows indicator provides a crucial entry signal in the market by detecting a special breakout pattern. The indicator constantly scans the chart for a settling momentum in one direction and provide the accurate entry signal right before the major move. Get multi-symbol and multi-timeframe scanner from here - Scanner for ACB Breakout Arrows MT 5 Key features Stoploss   and Take Profit levels are provided by the indicator. Comes with a MTF Scanner dashboard which tracks the br
180 USD
If you trade Forex, having detailed information about the currency strength and currency pairs correlation can take your trading to new heights. The correlation will help to cut your risk in half, and strength analysis will help to maximize the profits. This indicator provides a hybrid approach for selecting the most appropriate currency pairs using the strength analysis and currency pairs correlation. How to use the Currency Strength Analysis Suppose your trading strategy provides a buying o
120 USD
KT Heiken Ashi Smoothed MT5
KEENBASE SOFTWARE SOLUTIONS
KT Heiken Ashi Smoothed is a smoothed version of the standard Heiken Ashi. Moreover, it also plots buy/sell arrows on a trend change. A buy arrow is plotted when it change to a bullish state from bearish state. A sell arrow is plotted when it change to a bearish state from bullish state. Mobile notifications, Email, Sound and Pop-up alerts included. What exactly is Heiken Ashi Smoothed? It filters out the false signals and noise in the standard Heiken Ashi. It applies the set of two moving a
30 USD
KT Pin Bar MT5
KEENBASE SOFTWARE SOLUTIONS
KT Pin Bar identifies the pin bar formation which is a type of price action pattern which depicts a sign of reversal or rejection of the trend. When combined with support and resistance, BRN and other significant levels, Pin Bar pattern proved to be a very strong sign of reversal. Basically, a pin bar is characterized by a small body relative to the bar length which is closed either in upper or lower 50% part of its length. They have very large wicks and small candle body. A pin bar candlest
30 USD
KT Stoch Divergence MT5
KEENBASE SOFTWARE SOLUTIONS
Divergence is one of the vital signals that depicts the upcoming price reversal in the market. KT Stoch Divergence shows the regular and hidden divergences build between the price and stochastic oscillator. Limitations of KT Stoch Divergence Using the Stochastic divergence as a standalone entry signal can be risky. Every divergence can't be interpreted as a strong reversal signal. For better results, try to combine it with price action and trend direction. Features Marks regular and hidde
30 USD
KT Momentum Arrows MT5
KEENBASE SOFTWARE SOLUTIONS
5 (3)
KT Momentum Arrows Indicator is based on a momentary breakout which is calculated using the bands deviation and emerging volatility in a certain direction. A buy signal is generated when the price closes above the upper band and a sell signal is generated when the price closes below the lower band. A magnitude coefficient is used as the input which affects the band deviation and volatility at the same time. The coefficient value should be carefully selected and analyzed based on the instrument a
80 USD
KT Heiken Ashi Smoothed MT4
KEENBASE SOFTWARE SOLUTIONS
KT Heiken Ashi Smoothed is a smoothed version of the standard Heiken Ashi. Moreover, it also plots buy/sell arrows on a trend change. A buy arrow is plotted when it change to a bullish state from bearish state. A sell arrow is plotted when it change to a bearish state from bullish state. Mobile notifications, Email, Sound and Pop-up alerts included. What exactly is Heiken Ashi Smoothed? It filters out the false signals and noise in the standard Heiken Ashi. It applies the set of two moving a
30 USD
KT Stoch Divergence MT4
KEENBASE SOFTWARE SOLUTIONS
Divergence is one of the vital signals that depicts the upcoming price reversal in the market. KT Stoch Divergence shows the regular and hidden divergences build between the price and stochastic oscillator. Limitations of KT Stoch Divergence Using the Stochastic divergence as a standalone entry signal can be risky. Every divergence can't be interpreted as a strong reversal signal. For better results, try to combine it with price action and trend direction. Features Marks regular and hidde
30 USD
ACB Trade Filter MT5
KEENBASE SOFTWARE SOLUTIONS
ACB Trade Filter indicator provides a way to filtering out the low probability trading entries in a trading strategy. The indicator uses a sophisticated filtration algorithm based on the market sentiment and trend. The MT4 version of the same indicator is available here ACB Trade Filter MT4 Applications Works great with our indicator ACB Breakout Arrows MT5 Filter out low probability signals from any indicator. Avoid over-trading and minimize the losses. Trade in the direction of market sentim
60 USD
KT Trend Magic MT5
KEENBASE SOFTWARE SOLUTIONS
KT Trend Magic shows the trend depiction on chart using the combination of market momentum and volatility. A smoothing coefficient is used to smooth out the noise from the signal.It can be used to find out the new entries or confirm the trades produced by other EA or indicator. Features Drag n drop MTF scanner which scans for the new signals across multiple time-frames. Find new entries in the trend direction. Improve the accuracy of other indicators when used in conjunction. Can be used as a
30 USD
KT MA Crossover MT5
KEENBASE SOFTWARE SOLUTIONS
KT MA Crossover draws the buy and sell arrows based on the crossover of chosen moving averages. Moreover, it also generates the appropriate alerts and displays the MFE (Most Favorable Excursion) for each successive signal. The moving average crossover is one of the primary strategies followed by traders around the world. Usually, it consists of a fast and slow moving average to find a buy and sell entry signal according to the crossover direction. Buy signal - when fast MA crosses above the slo
30 USD
KT CCI Divergence MT4
KEENBASE SOFTWARE SOLUTIONS
KT CCI Divergence shows the regular and hidden divergence created between the price and CCI oscillator. Divergence is one of the vital signals that depicts the upcoming price reversal in the market. Manually spotting the divergence between price and CCI can be a hectic and ambiguous task. Limitations of KT CCI Divergence   Using the CCI divergence as a standalone entry signal can be risky. Every divergence can't be interpreted as a strong reversal signal. For better results, try to combine it
30 USD
KT CCI Divergence MT5
KEENBASE SOFTWARE SOLUTIONS
KT CCI Divergence shows the regular and hidden divergence created between the price and CCI oscillator. Divergence is one of the vital signals that depicts the upcoming price reversal in the market. Manually spotting the divergence between price and CCI can be a hectic and ambiguous task. Limitations of KT CCI Divergence   Using the CCI divergence as a standalone entry signal can be risky. Every divergence can't be interpreted as a strong reversal signal. For better results, try to combine it
30 USD
ACB Breakout Arrows
KEENBASE SOFTWARE SOLUTIONS
4.17 (35)
The ACB Breakout Arrows indicator provides a crucial entry signal in the market by detecting a special breakout pattern. The indicator constantly scans the chart for a settling momentum in one direction and provide the accurate entry signal right before the major move.  Get multi-symbol and multi-timeframe scanner from here - Scanner for ACB Breakout Arrows MT4 Key features Stoploss and Take Profit levels are provided by the indicator. Comes with a MTF Scanner dashboard which tracks the brea
180 USD
ACB Trade Filter MT4
KEENBASE SOFTWARE SOLUTIONS
5 (2)
The ACB Trade Filter indicator provides a solution for filtering out the low probability trading setups in a trading strategy. The indicator uses a sophisticated filtration algorithm based on the market sentiment and trend. Applications Works great with our indicator " ACB Breakout Arrows ". Filter out low probability signals from any indicator. Avoid overtrading and minimize the losses. Trade in the direction of market sentiment and trend. Avoid the choppiness in the market. How to use Only
60 USD
KT Momentum Arrows
KEENBASE SOFTWARE SOLUTIONS
KT Momentum Arrows Indicator is based on a momentary breakout which is calculated using the bands deviation and emerging volatility in a certain direction. A buy signal is generated when the price close above the upper band and a sell signal is generated when the price close below the lower band. A magnitude coefficient is used as the input which affects the band deviation and volatility at the same time. The coefficient value should be carefully selected and analyzed based on the instrument and
80 USD
KT COG Advanced MT4
KEENBASE SOFTWARE SOLUTIONS
1 (1)
KT COG is an advanced implementation of the center of gravity indicator presented by John F. Ehlers in the May 2002 edition of Technical Analysis of Stocks & Commodities magazine. It's a leading indicator which can be used to identify the potential reversal points with the minimum lag. The COG oscillator catches the price swings quite effectively. MT5 version of the same indicator is available here KT COG Advanced MT5 Calculation of COG The COG indicator is consist of the two lines. The mai
30 USD
KT Pin Bar
KEENBASE SOFTWARE SOLUTIONS
KT Pin Bar identifies the pin bar formation which is a type of price action pattern which depicts a sign of reversal or rejection of the trend. When combined with support and resistance, BRN and other significant levels, Pin Bar pattern proved to be a very strong sign of reversal. Basically, a pin bar is characterized by a small body relative to the bar length which is closed either in upper or lower 50% part of its length. They have very large wicks and small candle body. A pin bar candlest
30 USD
KT Trend Magic
KEENBASE SOFTWARE SOLUTIONS
KT Trend Magic shows the trend depiction on chart using the combination of market momentum and volatility. A smoothing coefficient is used to smooth out the noise from the signal.It can be used to find out the new entries or confirm the trades produced by other EA/Indicators. Usage Drag n drop MTF scanner which scans for the new signals across multiple time-frames. Find new entries in the trend direction. Improve the accuracy of other indicators when used in conjunction. Can be used as a dyna
30 USD
KT Auto Fibo
KEENBASE SOFTWARE SOLUTIONS
KT Auto Fibo draws Fibonacci retracement levels based on the ongoing trend direction. The Highs and Lows are automatically selected using the Maximum and Minimum points available on the chart. You can zoom in/out and scroll to adjust the Fibonacci levels accordingly. Modes Auto:  It draws the Fibonacci levels automatically based on the chart area. Manual: It draws the Fibonacci levels only one time. After that, you can change the anchor points manually. Usage: Helps to predict the future pr
30 USD
KT Psar Arrows
KEENBASE SOFTWARE SOLUTIONS
KT Psar Arrows plots the arrows on chart using the standard Parabolic SAR indicator. A bullish arrow is plotted when the candle's high touch the SAR. A bearish arrow is plotted when the candle's low touch the SAR. The signals are generated in the real-time without waiting for the bar close.  Features A beneficial tool for traders who want to experiment with the trading strategies that include the use of Parabolic Sar indicator.  Can be used to find turning points in the market. Use custom PSA
30 USD
KT Ichimoku Trader
KEENBASE SOFTWARE SOLUTIONS
1 (1)
KT Ichimoku Trader is a fully automated expert advisor that offers five popular trading strategies based on the Ichimoku indicator. Each strategy has it's own entry and exit method without any interference to other strategies. The Ichimoku system can be applied to all major currency pairs and metals. However, we found that it performs reasonably well mainly on two pairs.   MT5 Version is available here  https://www.mql5.com/en/market/product/35043 Features Trade up to 5 famous trading strate
80 USD
KT Volatility Oscillator
KEENBASE SOFTWARE SOLUTIONS
KT Volatility oscillator analyze the past and current market data with a mathematical formula to display the result in a form of an oscillator. The growing and deteriorating waves are equivalent to high and low volatility in the asset.  In a nutshell, volatility is simply a measurement of the price fluctuation of an asset over a certain period of time. Without volatility, there would not much movement in the market and traders would not be able to profit from the price movements. Use of Volati
30 USD
KT COG Robot
KEENBASE SOFTWARE SOLUTIONS
KT COG Robot is a fully automated Expert Advisor based on the KT COG Indicator . The COG indicator was originally presented by John F. Ehlers in the May 2002 edition of Technical Analysis of Stocks & Commodities magazine. The EA fires a long trade when COG line cross above the signal line and a short trade is fired when the COG line cross below the signal line.  Adaptive Filtration Our adaptive filtration algorithm combines the original COG formula with the major trend direction and market ac
60 USD
ACB Breakout Arrows EA
KEENBASE SOFTWARE SOLUTIONS
This is a 100% automated expert advisor based on our custom indicator named "ACB Breakout Arrows" . The entries are based on a breakout pattern that constantly occurs in a bi-directional manner. The intensity of entry signals can be manipulated using the external input called "Signal Sensitivity". MT5 Version is available here  https://www.mql5.com/en/market/product/35785 Trades Confirmation ACB Breakout Arrows EA provides an ability to filter the entries using our another custom indicator n
180 USD
KT Asian Breakout
KEENBASE SOFTWARE SOLUTIONS
KT Asian Breakout carefully analyzes the range-bound market during the Asian session and then fires a long or short trade after doing some preassessment based on its inbuilt technical analysis module. The executed orders are closed within a day before the completion of the next day session. The inbuilt technical analysis module checks for the session range and compares it with the last 20 days price movement. If it finds any erratic price movement within the session, the orders are not execute
140 USD
KT London Breakout
KEENBASE SOFTWARE SOLUTIONS
First thirty minutes are essential for a trading session. The early reaction of traders and market players sets a path for the rest of the day. KT London Breakout EA takes advantage of this phenomenon, and after analyzing the first thirty minutes of London session, it places two bidirectional pending orders. One of pending order is eventually canceled after realizing the market direction with certainty. It has been strictly tested and developed for EUR/JPY using 30-Min Time Frame. You can ex
100 USD
Use of support and resistance in systematic trading is very subjective. Every trader has their own idea and way to plotting the support and resistance levels on the chart. KT Support and Resistance indicator take out this ambiguity out of the situation and automatically draws support and resistance levels following an algorithmic approach using a unique multi-timeframe analysis. When launched on the chart, It immediately scan the most significant extreme points across all the available timefr
120 USD
If you trade Forex, having detailed information about the currency strength and currency pairs correlation can take your trading to new heights. The correlation will help to cut your risk in half, and strength analysis will help to maximize the profits. This indicator provides a hybrid approach for selecting the most appropriate currency pairs using the strength analysis and currency pairs correlation. How to use the Currency Strength Analysis Suppose your trading strategy provides a buying o
120 USD
Auswahl:
Keine Bewertungen
Antwort auf eine Rezension
Version 2.0 2022.04.30
- fixes a bug that was causing the Chikou line to offset vertically.
- fixes the alerts related to the Kumo twists.
Version 1.6 2022.03.26
recompiled.