Netsrac Correlation Dashboard Free
- Indikatoren
- Carsten Pflug
- Version: 1.40
- Aktualisiert: 13 Februar 2021
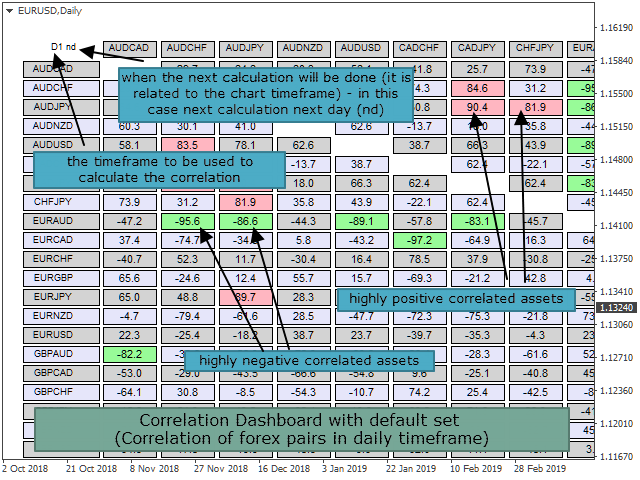
Das Dashboard soll dabei helfen, eine schnelle Übersicht über die Korrelationen verschiedener Underlyings zueinander zu bekommen. Dafür werden die Werte-Reihen nach der Pearson-Methode miteinander verglichen. Das Ergebnis ist der Wert der Korrelation (in Prozent).
Verwendung
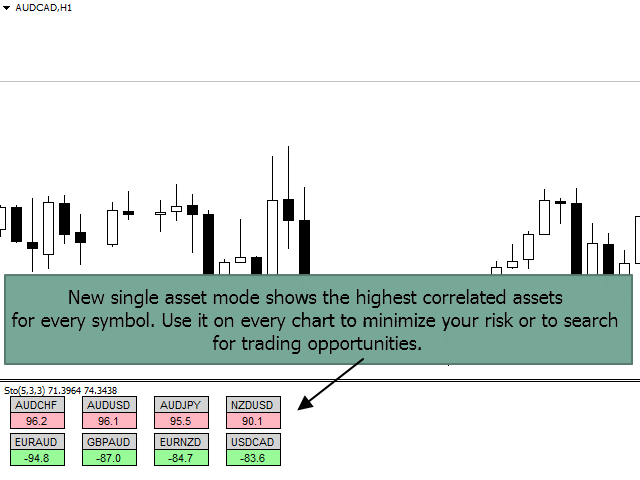
Für die Korrelation gibt es unterschiedliche Methoden. Beim so genannten Carry-Trade wird ein Underlying gekauft. Ein möglichst hoch negativ korreliertes Paar wird verkauft. Eine wesentliche Rolle spielen bei dieser Methode die jeweiligen Swaps.
Eine weitere Methode ist das Hedgen von Positionen. Eine Position soll hierbei durch den Kauf oder Verkauf eines korrelierten Paares abgesichert werden.
Anzeige des Indikators
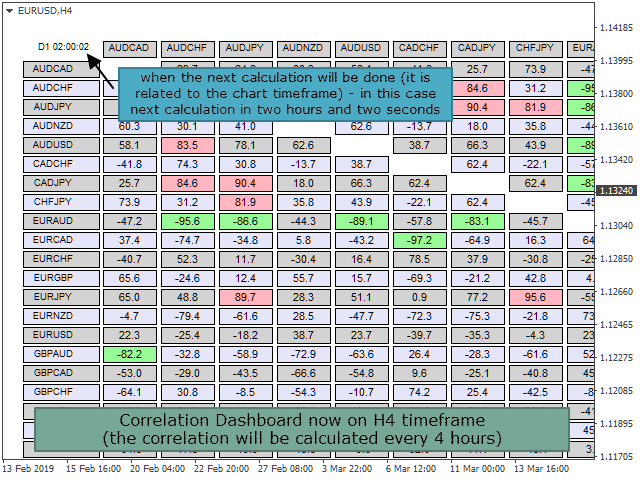
In der Matrix werden die errechneten Werte der Korrelation angezeigt. Es können Werte von -100% (absolut negativ korreliert) bis zu 100% (absolut positiv korreliert) angezeigt werden.
Wird ein (!) hinter dem Wert angezeigt, ist die Anzahl der Bars kleiner als die eingestellte Perioden-Anzahl.
Sind weniger als drei Bars für das Underlying vorhanden, wird keine Korrelation berechnet. Dann wird ein "X" angezeigt.
Optionen
Underlyings
Eine Liste mit Underlyings durch Komma getrennt. Achtet bitte darauf, dass alle hier gewählten UL auch als Aktiv im MT4 markiert sind. Das Dasboard liefert sonst keine Werte für dieses UL.
use chart timeframe
Wenn hier true eingestellt wird, wird für die Berechnung der Timeframe des Charts verwendet. Diese Einstellung eignet sich zum schnellen Umschalten zwischen den Timeframes.
timeframe
Wurde bei "use chart timeframe" false eingestellt, kann hier ein Timeframe fest vorgegeben werden. Dieser ändert sich dann auch nicht.
counting periods
Hier wird eingestellt, wie viele Perioden des jeweiligen Timeframes für die Berechnung herangezogen werden.
coloring field at correlation greater than x
Stelle hier den Schwellwert ein, ab dem ein positiv korreliertes Paar mit einer Farbe markiert wird.
coloring field at correlation smaller than x
Stelle hier den Schwellwert ein, ab dem ein negativ korreliertes Paar mit einer Farbe markiert wird.
Fonts und Farben (appearance)
Konfiguriere hier das Dashboard so, wie Du es gern haben möchtest und wie es auf den Bildschirm passt.
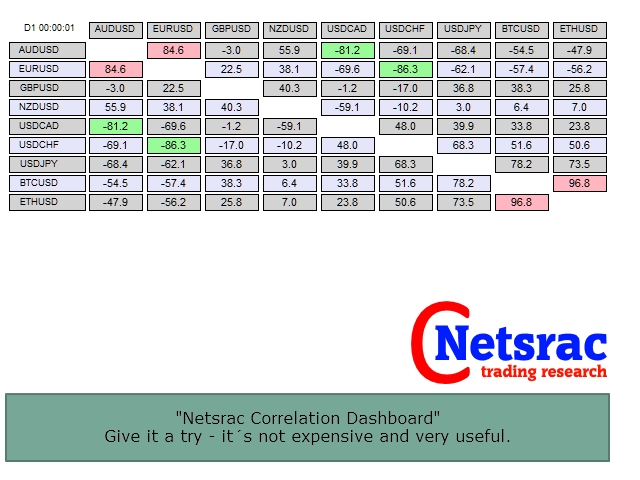
(Dies ist die freie Version des Netsrac Correlation Dashboard, welches hier zu finden ist: https://www.mql5.com/de/market/product/33834. Sie können mit der freien Version lediglich drei Underlyings beobachten.)

Thanks for sharing