• Übersicht
  • Bewertungen
  • Diskussion

Lines Target ZFS

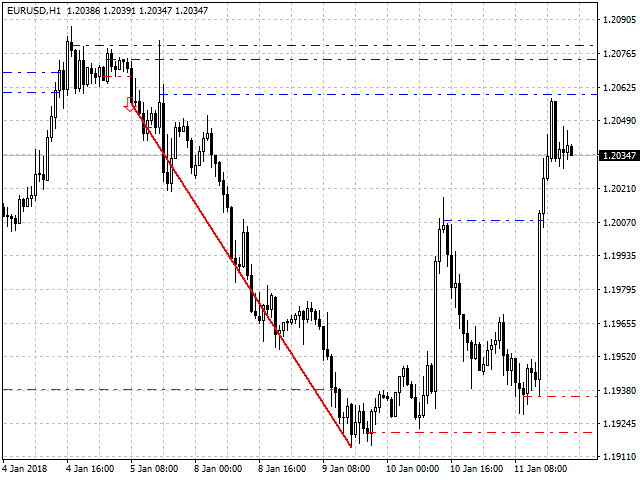
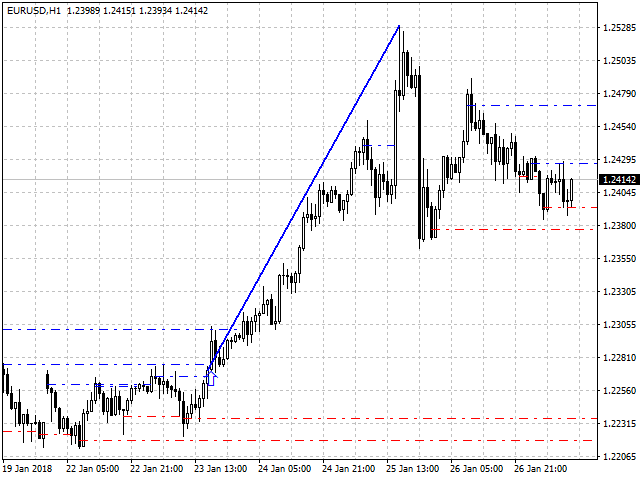
The main function of the indicator is to draw the target lines (support and resistance lines). The lines are plotted according to a special fractal algorithm. The lines are calculated with consideration of the zero bar. A different, more complicated calculation algorithm is used on the zero bar, in contrast to the other bars. This allows reacting to the market situation in real time, but on the other hand, redrawing is possible on the zero bar. If necessary, the zero bar can be omitted from calculations.

Strategies based on the target lines can be different. Trade signals can be obtained from:

  1. Breakout of the target line - the main signal.
  2. Formation of the target line.
  3. Rebound from the target line.

Signals based on target line breakouts can be tracked using alerts, push-notifications and email messages.

For more successful trading, use a competent money management, take into account the current distances between the target lines, the ratio of losses and profits, use higher timeframes to select a priority direction for trades (H1 is recommended), and trending liquid instruments (EURUSD, USDJPY, GBPUSD, AUDUSD, etc.).

Additional options include the Channel Lines plotted based on the last three fractals, the Direction Line to the projected fourth fractal and the Trend Line that shows the direction of the current trend move.


Indicator Inputs

  • Calculate bars - the number of calculated bars
  • switch Target Line - enable the target lines
  • color Up Target Line - color of the upper target lines
  • color Down Target Line - color of the lower target lines
  • width Target Line - width of the target lines
  • style Target Line - style of the target lines
  • switch Channel Line - enable the Channel Lines
  • color Up Channel Line - color of the upper Channel Line
  • color Down Channel Line - color of the lower Channel Line
  • width Channel Line - width of the Channel Lines
  • style Channel Line - style of the Channel Lines
  • switch Direction Line - enable the movement Direction Line
  • color Up Direction Line - color of the upward Direction Line
  • color Down Direction Line - color of the downward Direction Line
  • width Direction Line - width of the Direction Line
  • style Direction Line - style of the Direction Line
  • switch Trend Line - enable the Trend Line
  • color Up Trend Line - color of the upward Trend Line
  • color Down Trend Line - color of the downward Trend Line
  • width Trend Line - width of the Trend Line
  • style Trend Line - style of the Trend Line
  • switch Push notification - enable sending push notifications at a signal of target line breakout on the current or previous bar
  • switch Mail notification - enable sending email messages at a signal of target line breakout on the current or previous bar
  • switch Alert - enable sending alerts at a signal of target line breakout on the current or previous bar
Empfohlene Produkte
Der Indikator berechnet und zeichnet automatisch Fibonacci-Unterstützungs- und Widerstandsniveaus - eines der effektivsten Werkzeuge für die Marktanalyse. Die Berechnung verwendet die gemittelten Preisdaten für den ausgewählten Zeitraum und Zeitraum. Das Minimum und das Maximum für diesen Zeitraum gelten als Beginn und Ende der Bewegung. Fibonacci-Niveaus ermöglichen es Ihnen, potenzielle Referenzpunkte zu erkennen, um die sich die Preisbewegung verlangsamen oder umkehren kann, dh sie werden ver
Daily Candle Predictor ist ein Indikator, der den Schlusskurs einer Kerze vorhersagt. Der Indikator ist in erster Linie für die Verwendung in D1-Charts gedacht. Dieser Indikator eignet sich sowohl für den traditionellen Devisenhandel als auch für den Handel mit binären Optionen. Der Indikator kann als eigenständiges Handelssystem oder als Ergänzung zu Ihrem bestehenden Handelssystem verwendet werden. Dieser Indikator analysiert die aktuelle Kerze und berechnet bestimmte Stärkefaktoren innerhalb
VR Cub
Vladimir Pastushak
VR Cub ist ein Indikator für den Erhalt hochwertiger Einstiegspunkte. Der Indikator wurde entwickelt, um mathematische Berechnungen zu erleichtern und die Suche nach Einstiegspunkten in eine Position zu vereinfachen. Die Handelsstrategie, für die der Indikator geschrieben wurde, hat sich seit vielen Jahren bewährt. Ihr großer Vorteil liegt in der Einfachheit der Handelsstrategie, die es auch unerfahrenen Händlern ermöglicht, erfolgreich damit zu handeln. VR Cub berechnet Positionseröffnungspunkt
Fibonacci retracements can be used to draw support lines, identify resistance levels, place stop-loss orders and set target prices. The Advanced Automatic Fibonacci retracements draws automatically all the levels. You have a lot of options to choose. For exemple you can use the tracements of another time frame (MTF) in the current chart, you can also choose between the closest level or less close to draw the retracements. You can also add 2 levels of your choice. You can add levels extensions o
Trade with Gann on your side!! MASTER CIRCLE 360 CIRCLE CHART, originally created by Gann admitted that this is “The Mother of all charts”. It is one of the last studies that this great trader left for us. The numeric tab le is apparently quite simple like all the tables and is based on square numbers, the SQUARE OF 12 and is by evolution, one of the most important square numbers. Here we can find CYCLE, PRICE AND TIME thanks to angles and grades, to show past and future support and resistance.
The Th3Eng PipFinite indicator is based on a very excellent analysis of the right trend direction with perfect custom algorithms. It show the true direction and the best point to start trading. With StopLoss point and Three Take Profit points. Also it show the right pivot of the price and small points to order to replace the dynamic support and resistance channel, Which surrounds the price. And Finally it draws a very helpful Box on the left side on the chart includes (take profits and Stop loss
Master Scalping M1 ist ein innovativer Indikator, der einen Algorithmus verwendet, um den Trend schnell und genau zu bestimmen. Der Indikator berechnet den Zeitpunkt zum Öffnen und Schließen von Positionen, die Indikatoralgorithmen ermöglichen es Ihnen, die idealen Zeitpunkte für den Einstieg in einen Handel (Kauf oder Verkauf eines Vermögenswerts) zu finden, was den Erfolg von Transaktionen für die meisten Händler erhöht. Vorteile des Indikators: Einfach zu bedienen, überladen Sie das Diagramm
Noize Absorption Index MT4
Ekaterina Saltykova
5 (1)
Noize Absorption Index - is the manual trading system that measures the difference of pressure between bears forces and bulls forces. Green line - is a noize free index that showing curent situation. Zero value of index shows totally choppy/flat market.Values above zero level shows how powerfull bullish wave is and values below zero measures bearish forces.Up arrow appears on bearish market when it's ready to reverse, dn arrow appears on weak bullish market, as a result of reverse expectation. S
Owl smart levels
Sergey Ermolov
4.63 (54)
MT5-Version  |  FAQ Der   Owl Smart Levels Indikator   ist ein komplettes Handelssystem innerhalb eines Indikators, der so beliebte Marktanalysetools wie die   fortschrittlichen Fraktale von Bill Williams , Valable ZigZag, das die   richtige Wellenstruktur   des Marktes aufbaut, und   Fibonacci-Levels , die die genauen Einstiegslevels markieren, enthält in den Markt und Orte, um Gewinne mitzunehmen. Detaillierte Strategiebeschreibung Anleitung zur Verwendung des Indikators Berater-Assistent im
TWO PAIRS SQUARE HEDGE METER INDICATOR Try this brilliant 2 pairs square indicator It draws a square wave of the relation between your two inputs symbols when square wave indicates -1 then it is very great opportunity to SELL pair1 and BUY Pair2 when square wave indicates +1 then it is very great opportunity to BUY pair1 and SELL Pair2 the inputs are : 2 pairs of symbols         then index value : i use 20 for M30 charts ( you can try other values : 40/50 for M15 , : 30 for M30 , : 10 for H1 ,
This is the FXTraderariel-TakeProfit - Stop Loss Indicator . It provides you 3 potential Take Profits and 1 Stop Loss. These potential targets are computed based on several methods . The indicator can be used on every time frame, but we advise to use it on H1, H4 and D1. Especially if you are a novice trader. Pro Traders can also you use it for scalping in smaller time frames (M1, M5 and M15). This indicator is not a complete trading system. It doesn't provide you a Signal nor can predict the m
An indicator of pattern #31 ("Long Island") from Encyclopedia of Chart Patterns by Thomas N. Bulkowski. The second gap is in the opposite direction. Parameters: Alerts - show alert when an arrow appears   Push - send a push notification when an arrow appears (requires configuration in the terminal) GapSize - minimum gap size in points ArrowType - a symbol from 1 to 17 ArrowVShift - vertical shift of arrows in points   ShowLevels - show levels ColUp - color of an upward line ColDn - color of
Gold Bricks FX USES THE TREND WAVE INDICATOR AND IT CAN IDENTIFY THE BEGINNING AND THE END OF A NEW WAVE TREND MOVEMENT. AS AN OSCILLATOR, THE INDICATOR IDENTIFIES THE OVERBOUGHT AND OVERSOLD ZONES. IT WORKS GREAT TO CATCH THE SHORT TERM PRICE REVERSALS AND USES A MARTINGALE STRATEGY TO CLOSE ALL TRADES IN PROFIT. USE DEFAULT SETTINGS ON H1 OR HIGHER TIME FRAME ON ANY PAIR FOR MORE ACCURATE TRADES WHY THIS EA : Smart entries calculated by 4 great strategies The EA can be run on even a
Trendiness Index
Libertas LLC
5 (3)
"The trend is your friend" is one of the best known sayings in investing, because capturing large trendy price movements can be extremely profitable. However, trading with the trend is often easier said than done, because many indicators are based on price reversals not trends. These aren't very effective at identifying trendy periods, or predicting whether trends will continue. We developed the Trendiness Index to help address this problem by indicating the strength and direction of price trend
RTrends
Nikolay Likhovid
The RTrends indicator does two things: first, it automatically draws the layout of the price chart by plotting trend lines and, secondly, it produces bearish and bullish signals. The layout reflects the fractal nature of the market. Trends from different time horizons are applied simultaneously on the chart. Thus, from a single chart a trader can see trend lines of higher timeframes. The lines, depending on the horizon, differ in color and width: the older the horizon, the thicker the line is. T
Infinity Trend Pro
Yaroslav Varankin
1 (1)
This is a trend indicator without redrawing Developed instead of the binary options strategy (by the color of the Martingale candlestick) Also works well in forex trading When to open trades (binary options) A signal will appear in the place with a candle signaling the current candle It is recommended to open a deal for one candle of the current timeframe M1 and M5 When a blue dot appears, open a deal up When a red dot appears, open a trade down. How to open trades on Forex. When a signal is rec
We present you the indicator "Candle closing counter", which will become your indispensable assistant in the world of trading. That’s why knowing when the candle will close can help: If you like to trade using candle patterns, you will know when the candle will be closed. This indicator will allow you to check if a known pattern has formed and if there is a possibility of trading. The indicator will help you to prepare for market opening and market closure. You can set a timer to create a p
Fibonacci-Erweiterung und Retracement-Analyse-Tool Fibonacci-Retracing- und Extended-Line-Tools für die MT4-Plattform, ideal für Trader, die die und den Golden Section-Handel nutzen Hauptmerkmale: 1. Sie können mehrere Sätze von Fibonacci-Retracements direkt zeichnen, und die Beziehung zwischen wichtigen Rückkehrpunkten ist auf einen Blick ersichtlich. 2. Kann Fibonacci-Erweiterungen zeichnen 3. Das Fibonacci-Foldback und die Verlängerung der Linie können nach links und nach rechts zu
Trend Deviation
VLADISLAV AKINDINOV
Trend indicator with calculation of dynamic levels and signaling their intersection. Description of input parameters: StepTF = true; - Calculation of the indicator by closing the bar (true) or by each tick (false) BarsCount = 300; - Number of settlement bars Price = PRICE_CLOSE; - Type of price used TimeFrame = PERIOD_CURRENT; - Estimated timeframe TrendPeriod = 9; - Trend calculation period TrendDeviations = 4.9; - coefficient of deviation PeriodTrendSmooth = 1; - Trend smoothi
Intraday Levels shows intraday levels grid for intraday trading Shows a grid for the day levels, gives you a guide to know the trend and to measure intraday trades (stop-loss and take-profit). Parameters are: Levels Mode: Basic mode: Shows highest, lowest and middle levels. Advanced mode: Shows highest, lowest, middle and intermediate levels. Fibonacci mode: Shows session Fibonacci retracements levels. Momentum mode: Shows delayed Advanced levels to identify momentum. Smooth Period (Momentum
Wave Wolf MT4
Andrei Salanevich
Der MT4 Wave Wold Forex Indikator wurde entwickelt, um Wulff-Wellen zu finden und sie im aktuellen Fenster des Handelsterminals anzuzeigen. Ein ausgezeichneter Indikator für Händler, die Wulff-Wellen im Handel verwenden. Seine Anwendung in Handelsstrategien wird ihre Effizienz und Rentabilität erheblich verbessern. INFORMATIONEN ZUM INDIKATOR Im Gegensatz zu anderen Wolfswellenindikatoren hat der MT4 Wave Wold Forex Indikator eine Reihe von Funktionen, die seine Effizienz erheblich verbessern
What are Heiken Ashi Candles? Heiken Ashi, derived from the Japanese term 'Heikin Ashi,' translates to average price bars. It's an indicator depicting price bars on a chart. Formula for Heiken Ashi candles: - Heiken Ashi opening price: (previous candle's opening + closing price) / 2 - Closing price Heiken Ashi: (opening + high + low + closing) / 4 - Heiken Ashi peak: Max of high, opening, or closing price - Heiken Ashi bottom price: Min of low, opening, or closing price How to Read Heik
This indicator is a must have tool that scans the active chart for candlestick patterns. It labels each bar according the candlestick pattern(s) that it finds enabling you to more easily analyze price action and be more informed about your trading decision. There are 103 common and uncommon possible patterns plus 6 new patterns based on research that the indicator can identify. If a candlestick(s) meets the requirements for multiple patterns, the bar will be labeled with up to 4 patterns names f
Trend Ray
Andriy Sydoruk
The indicator shows the potential trend direction by cyclical-wave dependence. Thus, all the rays of the intersection will be optimal rays, in the direction of which the price is expected to move, taking into account the indicator period. Rays can be used as a direction for potential market movement. But we must not forget that the approach must be comprehensive, the indicator signals require additional information to enter the market.
YK-Fibo Pivot Indicator: Trade Smarter with Fibonacci Pivot Points The YK-Fibo Pivot Indicator is a powerful technical analysis tool that combines the precision of Fibonacci retracements with the insights of Pivot Points. Whether you're a novice or seasoned trader, this indicator empowers you to spot profitable opportunities in the market with ease. Why Choose YK-Fibo Pivot? Pinpoint Support & Resistance: By calculating Fibonacci levels based on the previous day's high, low, and close prices, y
For sure, this indicator has become very popular amongst traders. Through coding this indicator will give you the most accurate levels possible for your trading analysis. We have also added in the ability for you to receive alerts when the price breaks above or below a Support or Resistance lines! HOW TO USE The red rectangles represent your resistance/supply zone. The green rectangles represent your support/demand zone.  BONUS FEATURES We coded this indicator with the ability to switch between
All Symbols   AND  All Time frames Scan                                                                                                                 Document Introduction   The ABCD is a basic harmonic pattern. The ABCD pattern is a visual, geometric chart pattern comprised of three consecutive price swings. It looks like a diagonal lightning bolt and can indicate an upcoming trading opp
In the stock market technical analysis, support and resistance is a concept that the movement of the price of a security will tend to stop and reverse at certain predetermined price levels. Support and resistance levels can be identified on any timeframe. However, the most significant ones are found on the higher time frames, such as daily, weekly, and monthly. This indicator using the weekly OHLC data to identify the relevant levels. This is a support and resistance indicator and providing majo
This is an intraday indicator that uses conventional formulae for daily and weekly levels of pivot, resistance and support, but updates them dynamically bar by bar. It answers the question how pivot levels would behave if every bar were considered as the last bar of a day. At every point in time, it takes N latest bars into consideration, where N is either the number of bars in a day (round the clock, i.e. in 24h) or the number of bars in a week - for daily and weekly levels correspondingly. So,
Awesome Oscillator by Bill Williams with the ability to fine-tune and replace the averaging algorithms of the indicator, which significantly expands the possibilities of using this oscillator in algorithmic trading and brings it closer in its properties to such an indicator as the MACD. To reduce price noise, the final indicator is processed with an additional Smooth averaging. The indicator has the ability to give alerts, send mail messages and push signals when the direction of movement of th
Käufer dieses Produkts erwarben auch
Gann Made Easy
Oleg Rodin
4.93 (72)
Gann Made Easy ist ein professionelles und einfach zu bedienendes Forex-Handelssystem, das auf den besten Handelsprinzipien unter Verwendung der Theorie von Mr. basiert. W.D. Gann. Der Indikator liefert genaue KAUF- und VERKAUFSsignale, einschließlich Stop-Loss- und Take-Profit-Levels. Mit PUSH-Benachrichtigungen können Sie auch unterwegs handeln. Bitte kontaktieren Sie mich nach dem Kauf! Ich werde meine Handelstipps und tolle Bonusindikatoren kostenlos mit Ihnen teilen! Wahrscheinlich haben Si
DERZEIT 26% RABATT Die beste Lösung für jeden Newbie oder Expert Trader! Dieser Indikator ist ein einzigartiges, qualitativ hochwertiges und erschwingliches Trading-Tool, da wir eine Reihe von proprietären Funktionen und eine neue Formel integriert haben. Mit nur EINEM Chart können Sie die Währungsstärke für 28 Forex-Paare ablesen! Stellen Sie sich vor, wie sich Ihr Handel verbessern wird, weil Sie in der Lage sind, den genauen Auslösungspunkt eines neuen Trends oder einer Scalping-Gelegenh
Trend Punch
Mohamed Hassan
5 (10)
Manual guide:   Click here PROMO of  $79 for 2 copies left!  -- Next price is  $149 .  This indicator is unstoppable when combined with our other indicator called  Support & Resistance . After purchase, send us a message and you will get it   for  FREE as a BONUS! I like to use Trend Punch on XAUUSD & BTCUSD on the M1 timeframe!  Introducing Trend Punch , the revolutionary forex trend indicator that will transform the way you trade! Trend Punch is uniquely designed to provide preci
Atomic Analyst
Issam Kassas
5 (3)
Zunächst einmal ist es erwähnenswert, dass dieser Handelsindikator nicht neu malt, nicht neu zeichnet und keine Verzögerung aufweist, was ihn sowohl für manuellen als auch für Roboterhandel ideal macht. Benutzerhandbuch: Einstellungen, Eingaben und Strategie. Der Atom-Analyst ist ein PA-Preisaktionsindikator, der die Stärke und das Momentum des Preises nutzt, um einen besseren Vorteil auf dem Markt zu finden. Ausgestattet mit fortschrittlichen Filtern, die helfen, Rauschen und falsche Signale z
TPSpro RFI Levels
Roman Podpora
4.82 (17)
Reversal First Impulse levels (RFI)    INSTRUCTIONS        RUS       -       ENG              R ecommended to use with an indicator   -   TREND PRO -  Version MT5 A key element in trading is zones or levels from which decisions to buy or sell a trading instrument are made. Despite attempts by major players to conceal their presence in the market, they inevitably leave traces. Our task was to learn how to identify these traces and interpret them correctly. Main functions: Displaying active zones
Scalper Inside PRO
Alexey Minkov
4.74 (58)
An exclusive indicator that utilizes an innovative algorithm to swiftly and accurately determine the market trend. The indicator automatically calculates opening, closing, and profit levels, providing detailed trading statistics. With these features, you can choose the most appropriate trading instrument for the current market conditions. Additionally, you can easily integrate your own arrow indicators into Scalper Inside Pro to quickly evaluate their statistics and profitability. Scalper Inside
Werden Sie Breaker Trader und profitieren Sie von Änderungen der Marktstruktur, wenn sich der Preis umkehrt. Der Order Block Breaker Indikator zeigt an, wann sich eine Trend- oder Preisbewegung der Erschöpfung nähert und bereit ist, sich umzukehren. Es weist Sie auf Änderungen in der Marktstruktur hin, die normalerweise auftreten, wenn eine Umkehrung oder ein größerer Rückzug bevorsteht. Der Indikator verwendet eine proprietäre Berechnung, die Ausbrüche und Preisdynamik identifiziert. Jedes
Advanced Supply Demand
Bernhard Schweigert
4.92 (312)
Derzeit 33% Rabatt! Die beste Lösung für jeden Anfänger oder erfahrenen Händler! Dieser Indikator ist ein einzigartiges, qualitativ hochwertiges und erschwingliches Trading-Tool, da wir eine Reihe von proprietären Funktionen und eine neue Formel integriert haben. Mit diesem Update werden Sie in der Lage sein, doppelte Zeitrahmenzonen anzuzeigen. Sie können nicht nur einen höheren TF (Zeitrahmen) anzeigen, sondern sowohl den Chart-TF als auch den höheren TF: SHOWING NESTED ZONES. Alle Supply Dema
Gold Stuff
Vasiliy Strukov
4.89 (259)
Gold Stuff-Ein Trendindikator, der speziell für Gold entwickelt wurde, kann auch auf allen Finanzinstrumenten verwendet werden. Der Indikator wird nicht neu gezeichnet und verzögert sich nicht. Empfohlener Zeitrahmen H1. Nach diesem Indikator geschrieben EA Gold Stuff Berater, können Sie es in meinem Profil finden. WICHTIG! Kontaktieren Sie mich sofort nach dem Kauf, um Anweisungen und Bonus zu erhalten!   Sie können eine kostenlose Kopie unseres Strong Support- und Trendscanner-Indikators
Derzeit 20% Rabatt! Die beste Lösung für jeden Neueinsteiger oder Expert Händler! Dieses Dashboard arbeitet mit 28 Währungspaaren. Es basiert auf 2 unserer Hauptindikatoren (Advanced Currency Strength 28 und Advanced Currency Impulse). Es bietet einen hervorragenden Überblick über den gesamten Forex-Markt. Es zeigt die Werte der Advanced Currency Strength, die Veränderungsrate der Währungen und die Signale für 28 Devisenpaare in allen (9) Zeitrahmen. Stellen Sie sich vor, wie sich Ihr Hande
TPSproTREND PrO
Roman Podpora
4.78 (18)
TPSpro TRENDPRO  - is a trend indicator that automatically analyzes the market and provides information about the trend and each of its changes, as well as giving signals for entering trades without redrawing! The indicator uses each candle, analyzing them separately. referring to different impulses - up or down impulse. Exact entry points into transactions for currencies, crypto, metals, stocks, indices!  -  Version MT5               DETAILED DESCRIPTION                R ecommended to use with
Legacy of Gann
Pavel Zamoshnikov
4.83 (12)
The indicator very accurately determines the levels of the possible end of the trend and profit fixing. The method of determining levels is based on the ideas of W.D.Gann, using an algorithm developed by his follower Kirill Borovsky. Extremely high reliability of reaching levels (according to K. Borovsky  - 80-90%) Indispensable for any trading strategy – every trader needs to determine the exit point from the market! Precisely determines targets on any timeframes and any instruments (forex, met
FX Volume
Daniel Stein
4.6 (35)
Erhalten Sie Ihr tägliches Marktupdate mit Details und Screenshots über unser Morning Briefing hier auf mql5 und auf Telegram ! FX Volume ist der ERSTE und EINZIGE Volumenindikator, der einen ECHTEN Einblick in die Marktstimmung aus Sicht eines Brokers bietet. Es bietet fantastische Einblicke in die Positionierung von institutionellen Marktteilnehmern, wie z.B. Brokern, auf dem Forex-Markt, viel schneller als COT-Berichte. Diese Informationen direkt auf Ihrem Chart zu sehen, ist der wahre Game
FX Power MT4 NG
Daniel Stein
5 (10)
Erhalten Sie Ihr tägliches Marktupdate mit Details und Screenshots über unser Morning Briefing hier auf mql5 und auf Telegram ! FX Power MT4 NG ist die nächste Generation unseres langjährig sehr beliebten Währungsstärkemessers FX Power. Und was bietet dieser Stärkezähler der nächsten Generation? Alles, was Sie am ursprünglichen FX Power geliebt haben PLUS GOLD/XAU-Stärkeanalyse Noch präzisere Berechnungsergebnisse Individuell konfigurierbare Analysezeiträume Anpassbares Berechnungslimit für noc
Enigmera
Ivan Stefanov
5 (2)
ENIGMERA: Der Kern des Marktes https://www.enigmera.com Einführung Dieser Indikator und dieses Handelssystem sind ein bemerkenswerter Ansatz für die Finanzmärkte. ENIGMERA nutzt die fraktalen Zyklen zur genauen Berechnung von Unterstützungs- und Widerstandsniveaus. Er zeigt die echte Akkumulationsphase an und gibt Richtung und Ziele vor.  Ein System, das funktioniert, egal ob wir uns in einem Trend oder in einer Korrektur befinden.  Wie funktioniert es? ENIGMERA besteht aus drei Linien: der
Zunächst einmal ist es wichtig zu betonen, dass dieses Handelstool ein Nicht-Repaint-, Nicht-Redraw- und Nicht-Verzögerungsindikator ist, was es ideal für professionelles Trading macht. Online-Kurs, Benutzerhandbuch und Demo. Der Smart Price Action Concepts Indikator ist ein sehr leistungsstarkes Werkzeug sowohl für neue als auch erfahrene Händler. Er vereint mehr als 20 nützliche Indikatoren in einem und kombiniert fortgeschrittene Handelsideen wie die Analyse des Inner Circle Traders und Stra
Auto Order Block with break of structure based on ICT and Smart Money Concepts (SMC) Futures Break of Structure ( BoS )             Order block ( OB )            Higher time frame Order block / Point of Interest ( POI )    shown on current chart           Fair value Gap ( FVG ) / Imbalance   -  MTF      ( Multi Time Frame )    HH/LL/HL/LH  -  MTF      ( Multi Time Frame )  Choch  MTF      ( Multi Time Frame )  Volume Imbalance     ,  MTF          vIMB Gap’s Power of 3 Equal High
ICT, SMC, SMART MONEY CONCEPTS, SMART MONEY, Smart Money Concept, Support and Resistance, Trend Analysis, Price Action, Market Structure, Order Blocks, BOS/CHoCH,   Breaker Blocks ,  Momentum Shift,   Supply&Demand Zone/Order Blocks , Strong Imbalance, HH/LL/HL/LH,    Fair Value Gap, FVG,  Premium  &   Discount   Zones, Fibonacci Retracement, OTE, Buy Side Liquidity, Sell Side Liquidity, BSL/SSL Taken, Equal Highs & Lows, MTF Dashboard, Multiple Time Frame, BigBar, HTF OB, HTF Market Structure, 
Entdecken Sie das Geheimnis des erfolgreichen Forex -Handels mit unserem benutzerdefinierten MT4 -Indikator! Haben Sie sich jemals gefragt, wie Sie Erfolg auf dem Forex -Markt erzielen können und gleichzeitig Gewinne erzielen und gleichzeitig das Risiko minimieren können? Hier ist die Antwort, nach der Sie gesucht haben! Erlauben Sie uns, unseren proprietären MT4 -Indikator vorzustellen, der Ihren Handelsansatz revolutionieren wird. Einzigartige Vielseitigkeit Unser Indikator ist speziell
Volatility Trend System – ein Handelssystem, das Signale für Einstiege gibt. Das Volatilitätssystem liefert lineare und punktuelle Signale in Richtung des Trends sowie Signale zum Verlassen des Trends, ohne Neuzeichnung und Verzögerungen. Der Trendindikator überwacht die Richtung des mittelfristigen Trends, zeigt die Richtung und deren Änderung an. Der Signalindikator basiert auf Änderungen der Volatilität und zeigt Markteintritte an. Der Indikator ist mit mehreren Arten von Warnungen ausgest
TakePropips Donchian Trend Pro
Eric John Pajarillaga Aldana
4.82 (17)
TakePropips Donchian Trend Pro   (MT4) ist ein leistungsstarkes und effektives Tool, das mithilfe des Donchian-Kanals automatisch die Richtung des Trends erkennt und Ihnen Handelssignale für den Ein- und Ausstieg liefert! Dieser Multifunktionsindikator umfasst einen Trendscanner, Handelssignale, ein statistisches Panel, einen Screener, Handelssitzungen und ein Dashboard für den Verlauf von Warnungen. Es wurde entwickelt, um Ihnen Handelssignale zu liefern und Ihnen Stunden beim Analysieren der C
Currency Strength Wizard ist ein sehr leistungsstarker Indikator, der Ihnen eine Komplettlösung für erfolgreichen Handel bietet. Der Indikator berechnet die Stärke dieses oder jenes Forex-Paares anhand der Daten aller Währungen in mehreren Zeitrahmen. Diese Daten werden in Form von benutzerfreundlichen Währungsindizes und Währungsstärkelinien dargestellt, anhand derer Sie die Stärke dieser oder jener Währung erkennen können. Sie müssen lediglich den Indikator an das Diagramm anhängen, mit dem Si
Break and Retest
Mohamed Hassan
4.43 (14)
New update to V.4 where  Break & Retest automatically draws the take profit & stop loss levels and you also have more signals per day! ‍You can visually backtest Break & Retest to see how it behaved in the past!     Manual guide:   Click here $60 for a very limited time. Next price is $120   This Indicator only places quality trades when the market is really in your favor with a clear break and retest. Patience is key with this price action strategy! If you want more alert s
Trend Screener
STE S.S.COMPANY
4.83 (88)
Trendindikator, bahnbrechende, einzigartige Lösung für Trendhandel und -filterung mit allen wichtigen Trendfunktionen in einem Tool! Es handelt sich um einen 100 % nicht neu zu malenden Multi-Timeframe- und Multi-Währungs-Indikator, der für alle Symbole/Instrumente verwendet werden kann: Forex, Rohstoffe, Kryptowährungen, Indizes und Aktien. Trend Screener ist ein effizienter Trendfolgeindikator, der Pfeiltrendsignale mit Punkten im Diagramm liefert. Die Funktionen, die im Trendanalysator-Indika
M1 Arrow
Oleg Rodin
5 (14)
Eine Intraday-Strategie, die auf zwei Grundprinzipien des Marktes basiert. Der Algorithmus basiert auf der Analyse von Volumina und Preiswellen mit zusätzlichen Filtern. Der intelligente Algorithmus des Indikators gibt nur dann ein Signal, wenn sich zwei Marktfaktoren zu einem vereinen. Der Indikator berechnet Wellen eines bestimmten Bereichs auf dem M1-Diagramm unter Verwendung der Daten des höheren Zeitrahmens. Und um die Welle zu bestätigen, verwendet der Indikator eine Volumenanalyse. Dieser
NAM Order Blocks
NAM TECH GROUP, CORP.
5 (1)
MT4-Erkennungsanzeige für Auftragsblöcke mit mehreren Zeitrahmen. Eigenschaften - Vollständig anpassbar auf dem Diagrammbedienfeld, bietet vollständige Interaktion. - Verstecken und zeigen Sie das Bedienfeld, wo immer Sie möchten. - Erkennen Sie OBs in mehreren Zeiträumen. - Wählen Sie die anzuzeigende OB-Menge aus. - Verschiedene OBs Benutzeroberfläche. - Verschiedene Filter an OBs. - OB-Näherungsalarm. - ADR High- und Low-Leitungen. - Benachrichtigungsdienst (Bildschirmwar
DERZEIT 31% RABATT! Die beste Lösung für jeden Newbie oder Expert Trader! Dieser Indikator ist ein einzigartiges, qualitativ hochwertiges und erschwingliches Handelsinstrument, da wir eine Reihe von proprietären Funktionen und eine geheime Formel eingebaut haben. Mit nur EINEM Chart liefert er Alerts für alle 28 Währungspaare. Stellen Sie sich vor, wie sich Ihr Handel verbessern wird, weil Sie in der Lage sind, den genauen Auslösepunkt eines neuen Trends oder einer Scalping-Gelegenheit zu e
Entry Points Pro
Yury Orlov
4.7 (226)
Dies ist ein Indikator für MT4, der genaue Signale für den Einstieg in einen Handel ohne Repainting (Neuzeichnen) liefert. Er kann auf alle Finanzwerte angewendet werden: Forex, Kryptowährungen, Metalle, Aktien, Indizes. Er liefert ziemlich genaue Schätzungen und sagt Ihnen, wann es am besten ist, eine Position zu eröffnen und zu schließen. Sehen Sie sich das Video (6:22) mit einem Beispiel für die Verarbeitung nur eines Signals an, das sich für den Indikator gelohnt hat! Die meisten Händler ver
BullsEye Signal NoRepaint
Martin Alejandro Bamonte
BullseyeSignal – NoRepaint ist ein Signal, das, wie der Name schon sagt, unter keinen Umständen neu gezeichnet wird. Das Signal wird auf der gleichen Kerze ausgegeben, die im Bild zu sehen ist. Es ist ideal für stark volatile Märkte wie Forex, Kryptowährungen, Aktien, Indizes und Futures. Sie werden nur einen grünen Pfeil für den Kauf und einen roten Pfeil für den Verkauf sehen, aber hinter ihnen arbeiten viele Indikatoren zusammen, um ein vereinfachtes Handelserlebnis zu bieten. Es ist speziell
Up down v6T
Guner Koca
5 (1)
Thise indicator is up down v6  comes with tradingwiev pinescript. purchased people, after installed on terminal ,contact me on mql5  to get BONUS  TradingView pinescript. up-down indicator is no repaint and works all pairs and lower than weekly time frames charts. it is suitable also 1 m charts for all pairs. and hold long way to signal. dont gives too many signals. when red histogram cross trigger line that is up signal.and price probably will down when blue histogram cross trigger line that
Weitere Produkte dieses Autors
The indicator displays the resistance/support levels based on the history data of price action. It requires a depth of history to calculate the levels. The tool has been developed using an original proprietary technique. The resistance and support levels indicate the accumulations of orders. Indicator Parameters Start Data/Time - initial date/time of the history data for calculation of levels Width of Lines Resistance/Support in Points - thickness (density) of lines in points, it is recommende
The indicator draws channels. The estimated movement of the price within the channel is shown with a dotted line. The lines of the channel are the support and resistance lines. This allows using them in both rebound and breakout trading. The inclination of the channel allows determining the direction of the current trend, the channel width and angle allow estimating the current volatility. The channels are based on fractal bars, determined using the author's original method, 4 dimensions from th
Пинбар — это лишь 1 свечка или бар, представляющая собой цену, что отскочила от максимального или минимального ценового уровня. Свечка открылась, цена пошла в одном направлении и затем резко развернулась за период свечи — так формируется пинбар. Пинбар легко заметить — длинная тень (хвост), маленькое тело. Запомните: не все свечи с длинным хвостом являются пинбарами. Только когда хвост намного больше тела свечи, формируется пинбар. Как правило, рынок при этом закрывается там, где открылся или по
Ein regressionskanal, der auf rauhen fraktalen aufgebaut ist. Daten: Period ReCalculate - Zeitraum der Berechnung des Indikators switch Zero (Last) Bar-die ungeschlossene Letzte Bar zählen? switch Push-Benachrichtigungen, wenn sich die Position des groben Preises relativ zum Kanal ändert Line Risk-Anzeige der risikolinie Coeff Risk,% - der maximale Prozentsatz in der Transaktion in Prozent Der Kanal ermöglicht es Ihnen, den Trend und seine Stärke auf dem Markt zu bewerten und richtig eine
Grafischer Indikator für die Analyse des Handelsergebnisses, der Pfeilindikatoren, der Arbeit des Beraters, der Entwicklung einer Handelsstrategie. Ein Hauptparameter ist der minimale Prozentsatz des Gewinns. Der Indikator zeigt alle Trends in jedem Diagramm unter Berücksichtigung des geschlossenen Balkens und des Fraktals an und berechnet den maximalen Gewinnprozentsatz in jedem Trend. Berechnet zusätzlich den durchschnittlichen prozentualen Gewinn des Instruments. Ein größerer Prozentsa
Auswahl:
Keine Bewertungen
Antwort auf eine Rezension