Line Break chart generator
- Indikatoren
- Artur Zas
- Version: 1.0
- Aktivierungen: 5
The professional line break chart generator is used to create live line break charts (i.e. 3 line break). The chart is plotted using MT4's offline charging facility thus making it possible to trade* directly from the chart as well as attach any of the standard or custom indicators to perform technical analysis.
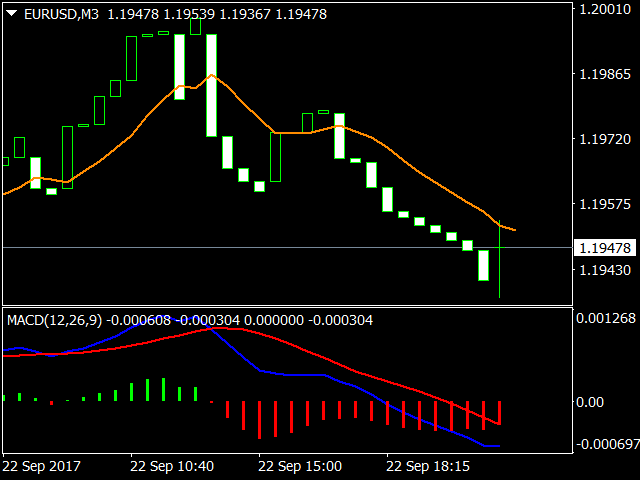
The line break chart can be displayed as the most widely used 3 line break chart or a custom variation such as 2 or 5 line break chart.
Wicks can be displayed or hidden on the chart - they give a lot of additional information regarding the underlying price action.
The indicator's settings include:
- Line break number - determines the number of lines (or previous candle lows/highs) that need to be broken in order to display a reversal line.
- Show wicks (true/false)
- Show history for number of days
- Display on offline chart (M2 / M3 / M4 / M6 / M7 / M8 / M9 / M10)
- Recalculate on history updates (true/false)
- Minimum chart update interval (milliseconds)
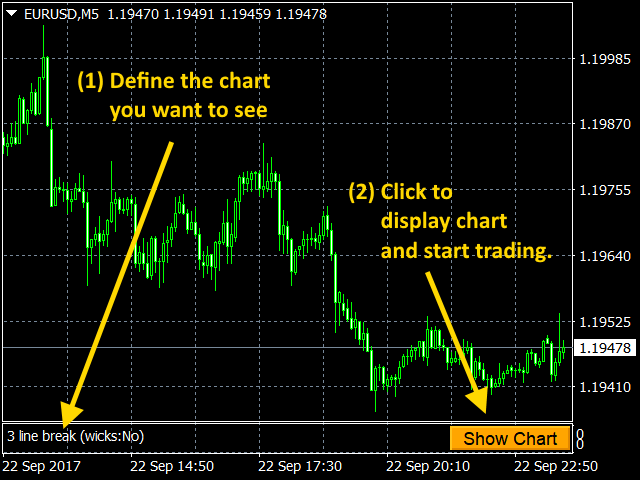
To start using the chart, first you need to select the instrument and time frame (M1, M5, H1, D1, etc) you want to use as the source for line break calculations and open this chart. Next, attach the line break chart generator indicator onto this chart and set your desired inputs (as described above).
You will see a [Show Chart] button in the lower right corner of the chart. When you click it an offline chart will be opened and it will display the line break chart you selected. Please note that you need to keep the base chart open as the line break chart generator will feed live quotes to the offline chart thus making it live for trading.
* )EAs can be used directly on the offline chart, however, a small tweak is required, so you need to have access to your EA source code. Below is an EA skeleton example that is capable of running directly on any offline chart:
#property strict
//+------------------------------------------------------------------+
//| Expert initialization function                                   |
//+------------------------------------------------------------------+
int OnInit()
{
   // You need to initialize a time to call the OnTimer event.
   // It is used to call OnTick whenever the Bid price changes.
   // The check is made every 250 ms, which should be sufficient.

   EventSetMillisecondTimer(250);

   //---

   return(INIT_SUCCEEDED);
}
//+------------------------------------------------------------------+
//| Expert deinitialization function                                 |
//+------------------------------------------------------------------+
void OnDeinit(const int reason)
{
   // Remember to destroy timer in the OnDeinit event.

   EventKillTimer();

   //---
}
//+------------------------------------------------------------------+
//| Expert tick function                                             |
//+------------------------------------------------------------------+
void OnTick()
{
   //
   // This is where all of your EA trading logic resides.
   // I just write to the log in this example...
   //

   Print("OnTick function call - bid = "+(string)Bid);
}
//+------------------------------------------------------------------+
//| The OnTimer function is used to call OnTick()                    |
//| whenever the Bid price changes.                                  |
//+------------------------------------------------------------------+
void OnTimer()
{
   RefreshRates();
   static double prevBid = 0;

   if(Bid != prevBid)
   {
      prevBid = Bid;
      OnTick();
   }
}
//+------------------------------------------------------------------+
Excellent indicator