Gartley Projections D
- Indikatoren
- Oleksandr Medviediev
- Version: 3.53
- Aktualisiert: 30 August 2017
- Aktivierungen: 20
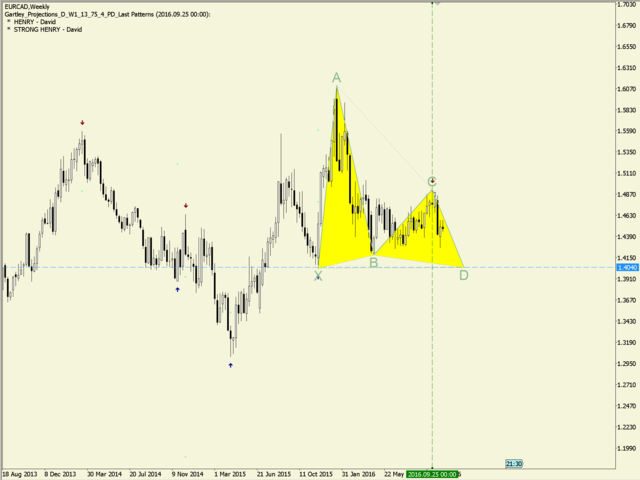
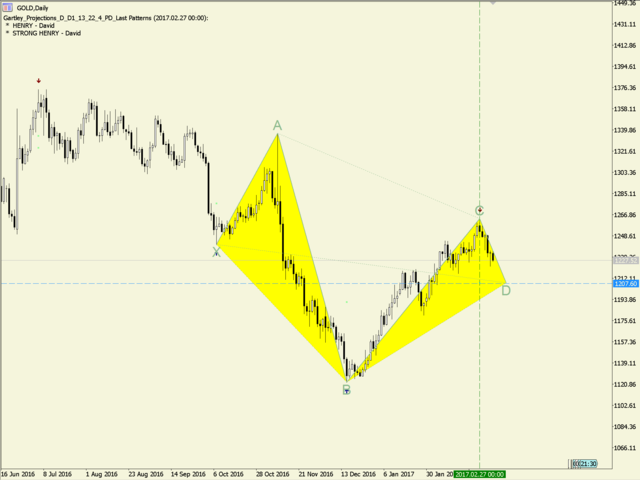
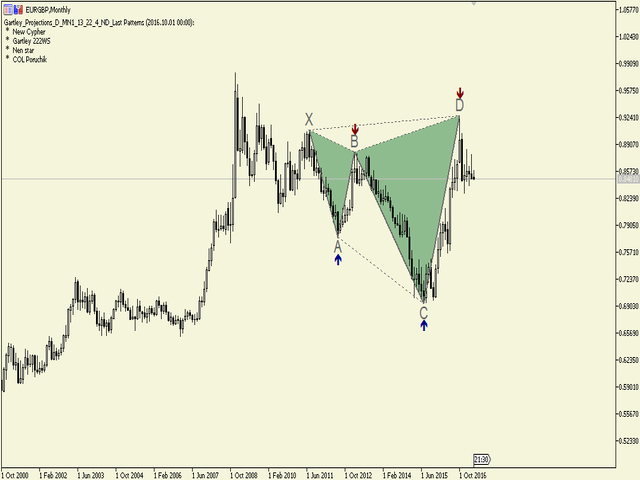
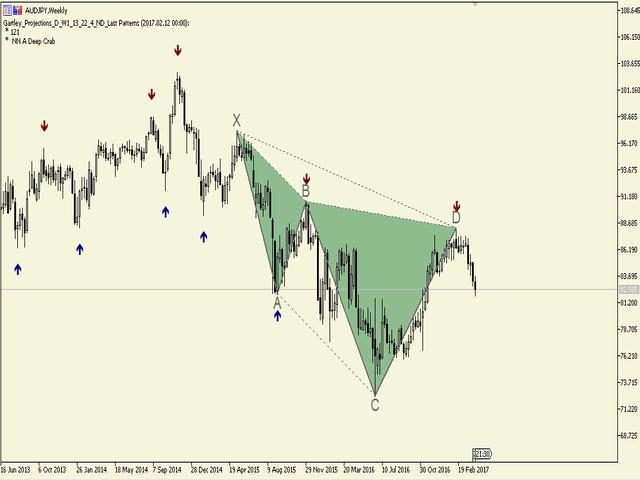
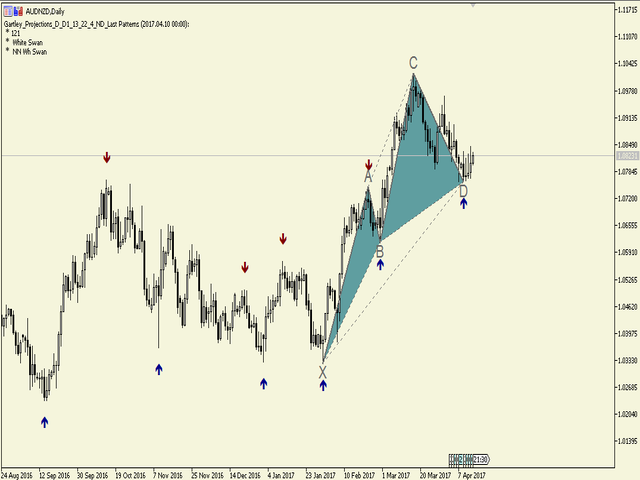
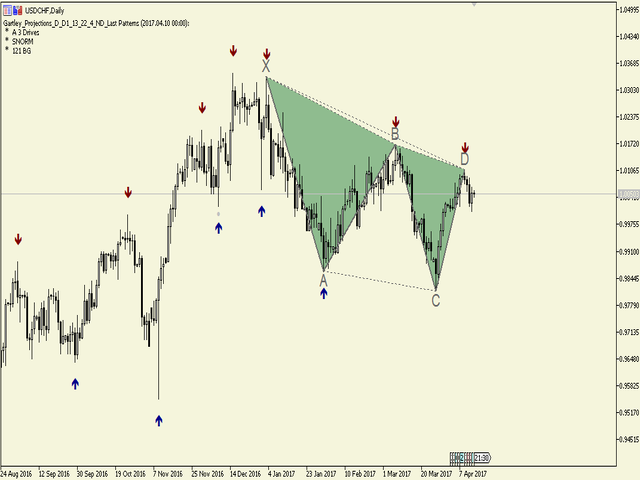
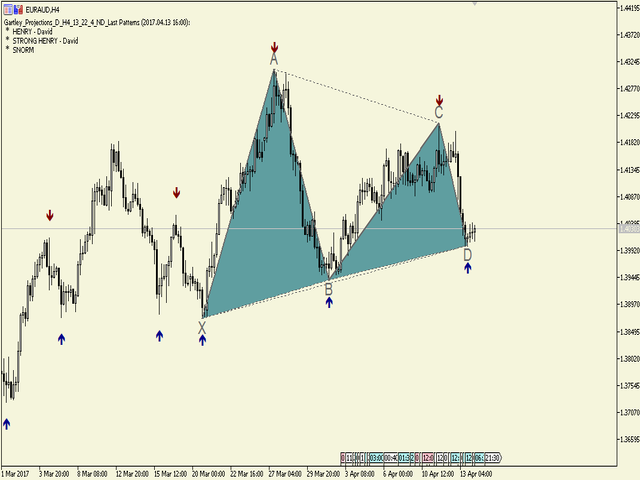
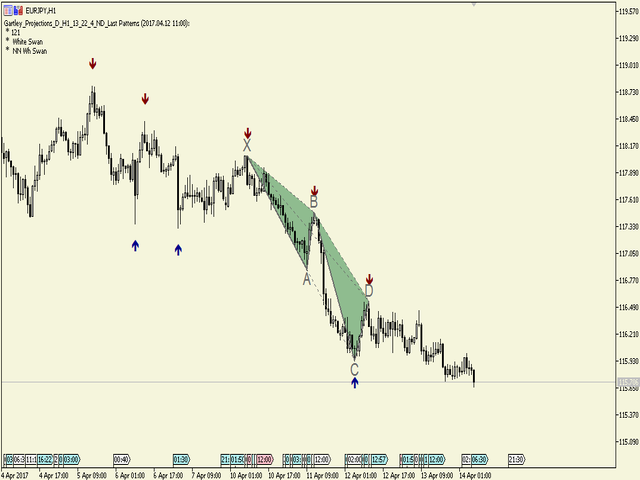
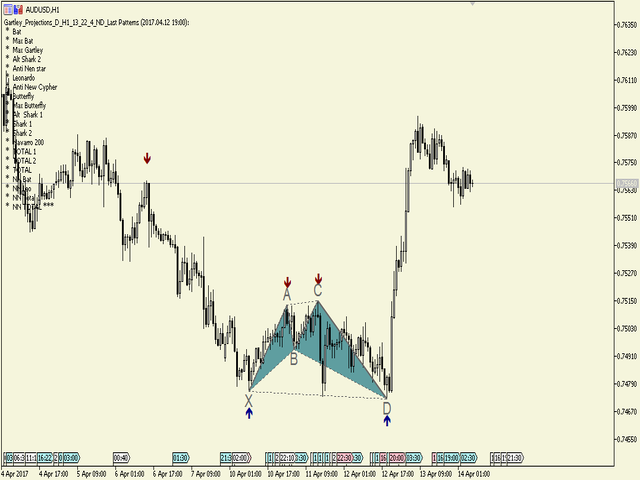
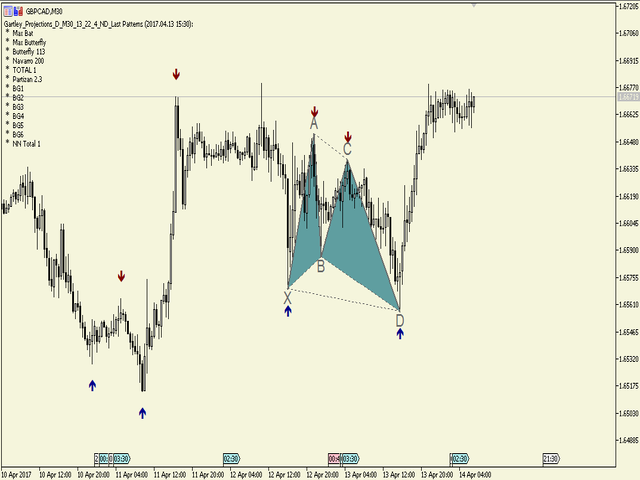
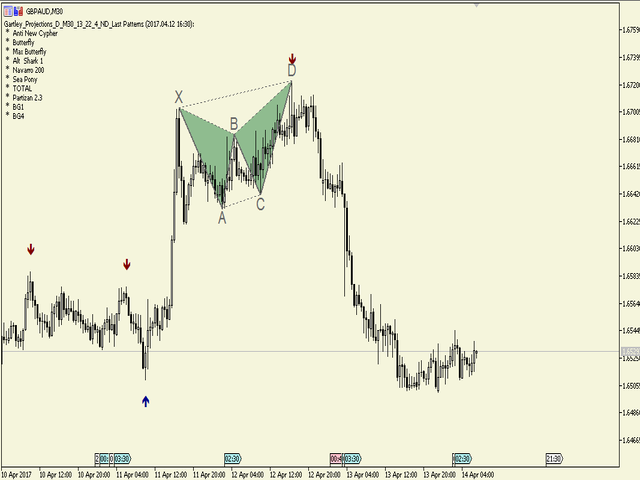
Der Indikator identifiziert die harmonischen Muster (XABCD) gemäß den Entwicklungen von H.M. Gartley („Profits in the Stock Market“, 1935г).
Der D-Punkt wird als Punkt in der perspektivischen Projektion projiziert (geben Sie in den Einstellungen ProjectionD_Mode = true an).
Wird nicht neu gezeichnet. Wenn ein Balken des Arbeitszeitraums schließt und sich der identifizierte Musterpunkt während der Balken von Patterns_Fractal_Bars nicht bewegt hat, erscheint ein Pfeil auf dem Diagramm (in Richtung der erwarteten Preisbewegung). Von diesem Moment an bleibt der Pfeil dauerhaft auf dem Diagramm.
2-3 und mehr Pfeile hintereinander – dies verändert die Marktbedingungen, NICHT neu streichen/neu zeichnen (Zeitrahmen dürfen nicht hin- und herwechseln).
HINWEIS: 2-3 oder mehr Pfeile hintereinander – dies verändert die Marktbedingungen, NICHT eine Neuzeichnung.
Die Gesamtzahl der Muster beträgt 85 (einschließlich Gartley-222 und Gartley-222WS; die vollständige Liste ist im Abschnitt „Kommentare“ verfügbar). Von allen identifizierten Mustern wird nur das zuletzt identifizierte Muster mit einer Volltonfarbe gefüllt.
Parameter
DrawPatterns (true/false) – Zeichne ein Muster mit einer Volltonfarbe
ProjectionD_Mode (true/false) – Modus zum Definieren des D-Punkts als perspektivische Projektion
Patterns_Fractal_Bars – die Anzahl der Arbeitszeitrahmen-Balken, während derer der zuletzt identifizierte Musterpunkt fixiert bleiben muss, damit er als gebildetes Fraktal betrachtet wird (auf dem Diagramm erscheint ein Pfeil)
Patterns_Deviation – zulässige prozentuale Abweichung von den Referenzwerten der Seitenproportionen in einem Muster (erlaubter Wertebereich)
Patterns_XA_MinLength_Bars – die minimal zulässige Anzahl von Balken im Anfangssegment XA
Patterns_XA_MinHeight_Points – die minimal zulässige Größe des Anfangssegments XA in Punkten
ZigZag_Depth – Parameter des ZigZag-Indikators
ZigZag_Deviation – Parameter des ZigZag-Indikators
ZigZag_Backstep – Parameter des ZigZag-Indikators
ShowInfo (true/false) – zeigt die Liste der identifizierten Muster auf der linken Seite des Diagramms an
PrintInfo (true/false) – Informationen im Protokoll ausdrucken


Also a verry good indicator