Fibo Candle Previous for MT5
- Indikatoren
- Taras Slobodyanik
- Version: 3.70
- Aktualisiert: 7 Juni 2024
- Aktivierungen: 10
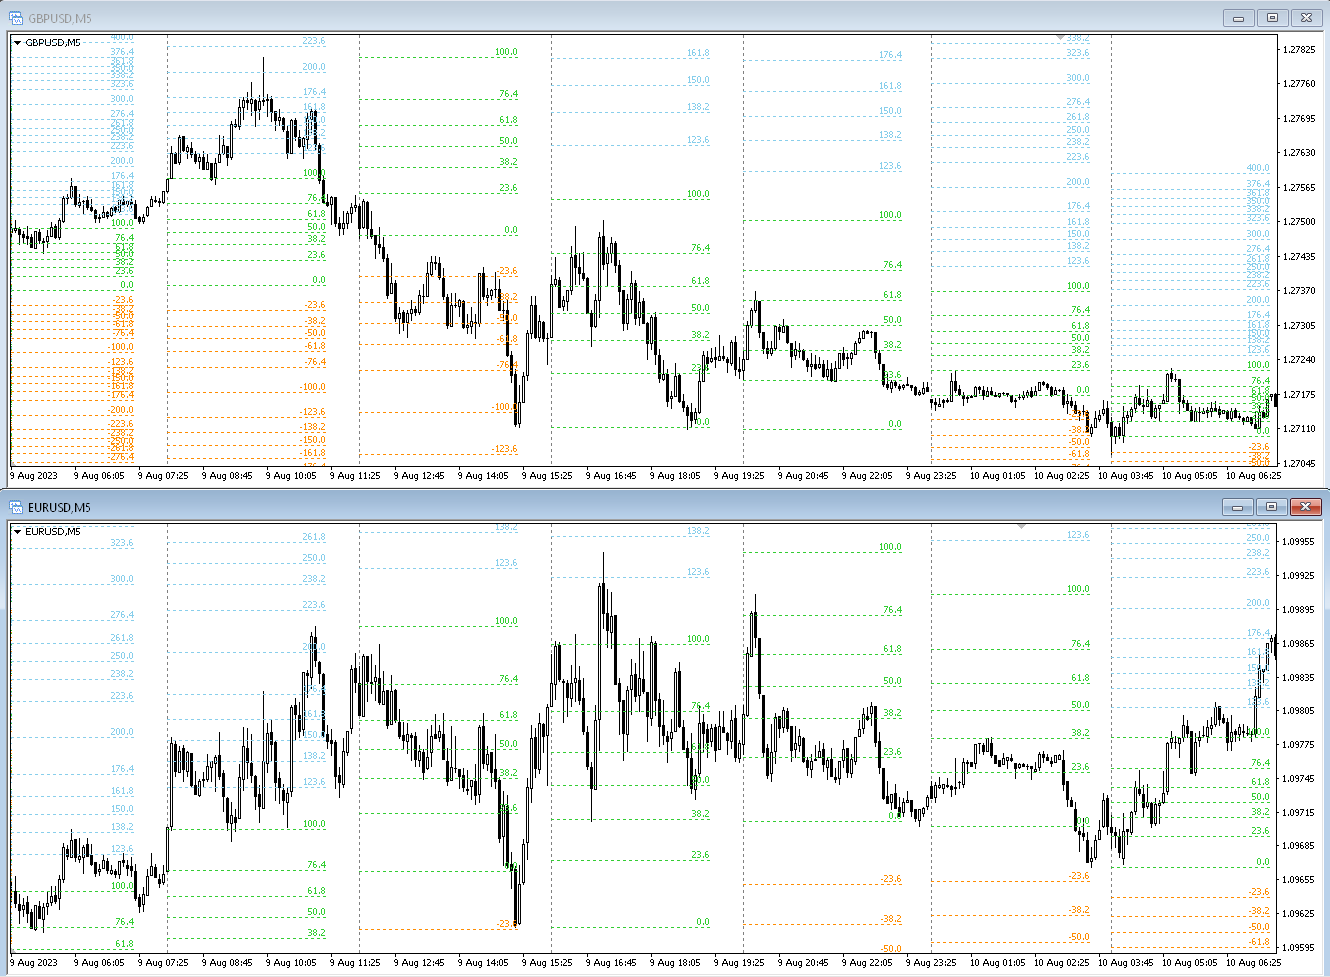
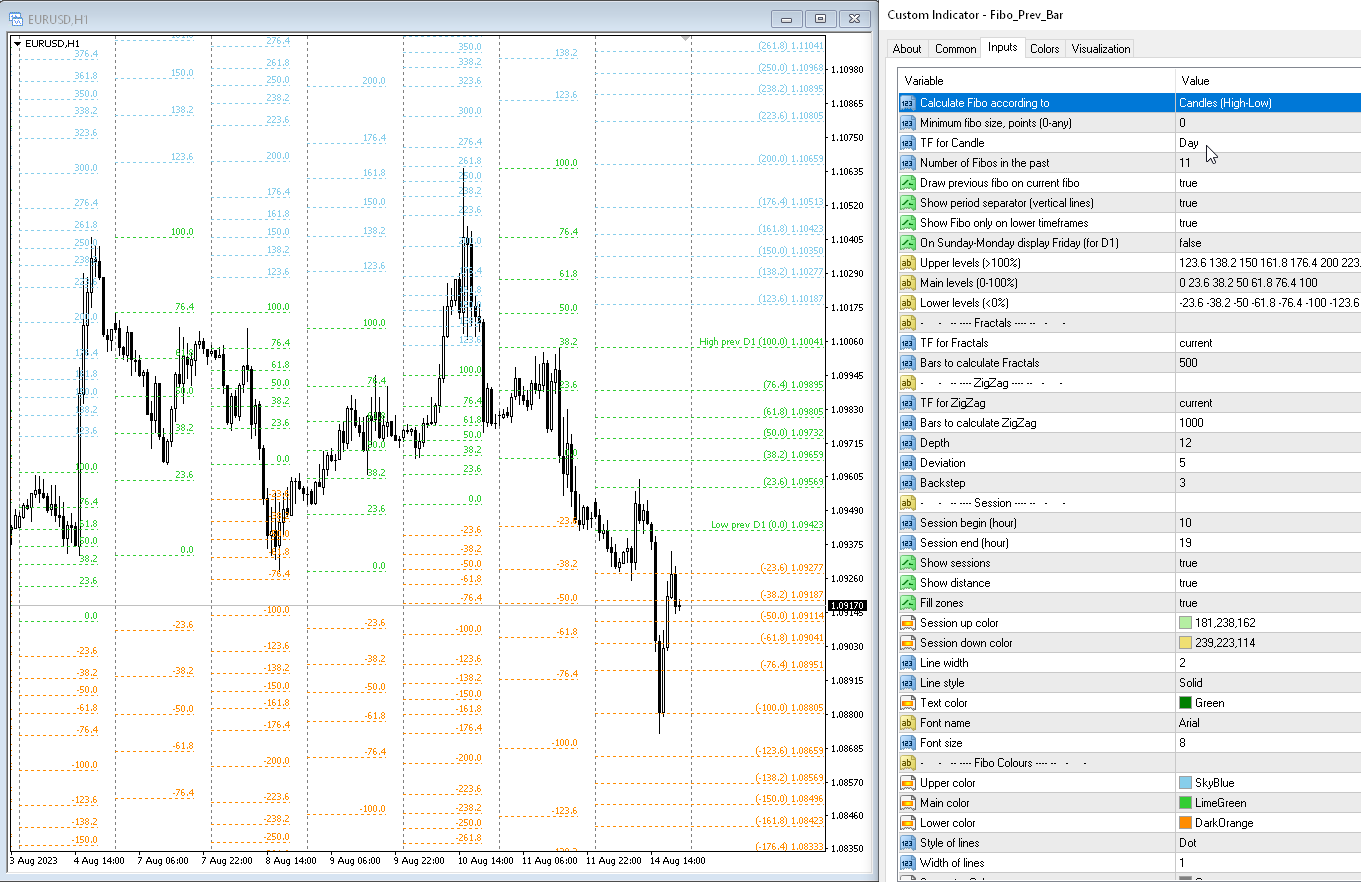
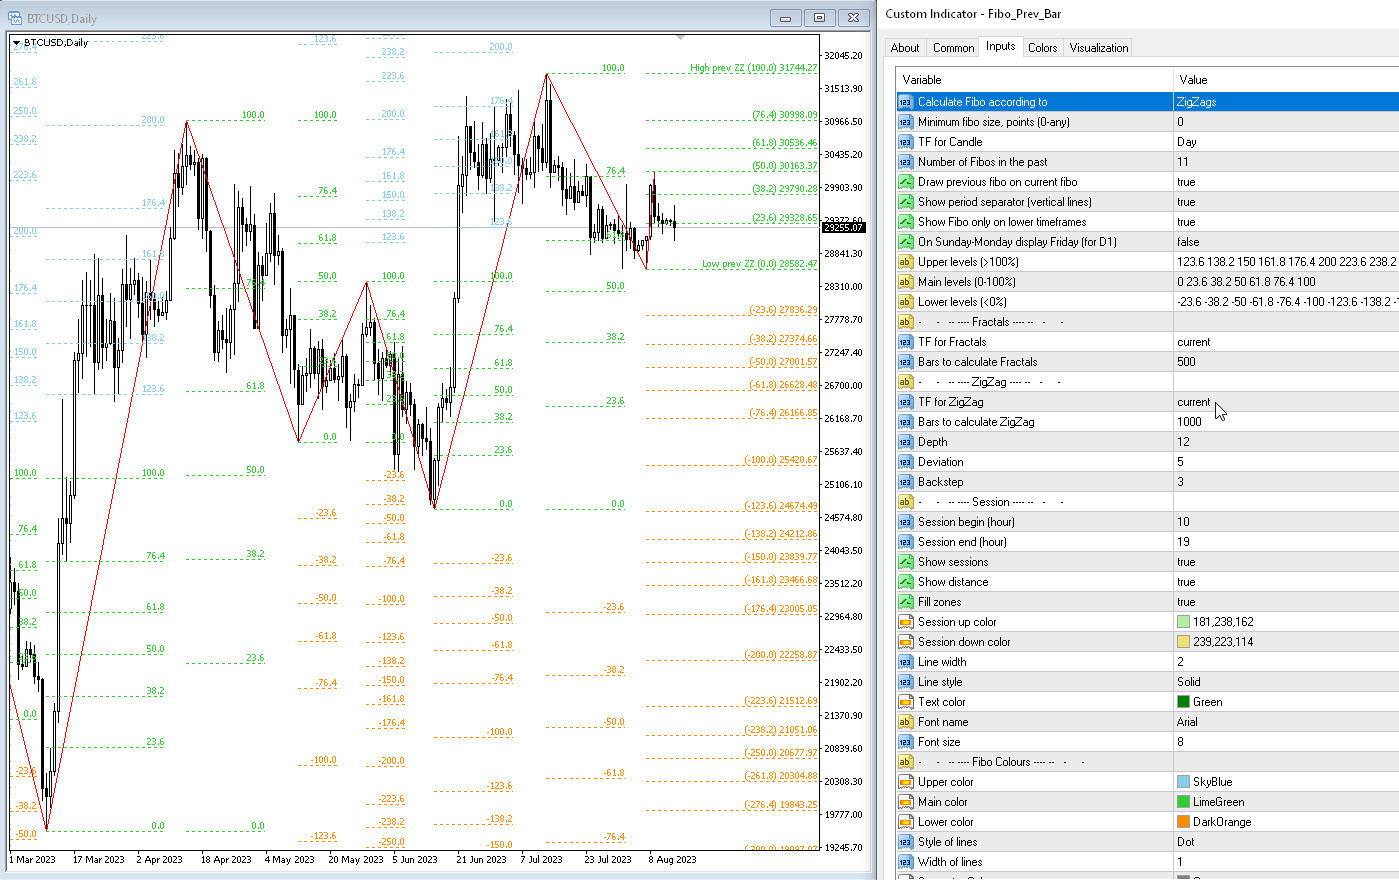
Der Indikator zeichnet automatisch die Fibonacci-Niveaus basierend auf dem ZigZag-Indikator, Handelssitzungen, Fraktalen oder Kerzen (einschließlich nicht standardmäßiger Zeitrahmen: Jahr, 6 Monate, 4 Monate, 3 Monate, 2 Monate) (Auto-Fibo-Retracement). Sie können einen beliebigen höheren Zeitrahmen für die Fibonachi-Berechnung wählen.
Die Level werden jedes Mal neu gezeichnet, wenn der aktuelle Balken schließt. Es ist möglich, Warnungen beim Überschreiten der angegebenen Ebenen zu aktivieren.
Sie können auch Ebenen im Verlauf analysieren. Dazu ist es notwendig, im Parameter „Anzahl der Fibo in der Vergangenheit“ die Anzahl der Fibo-Stufen anzugeben.
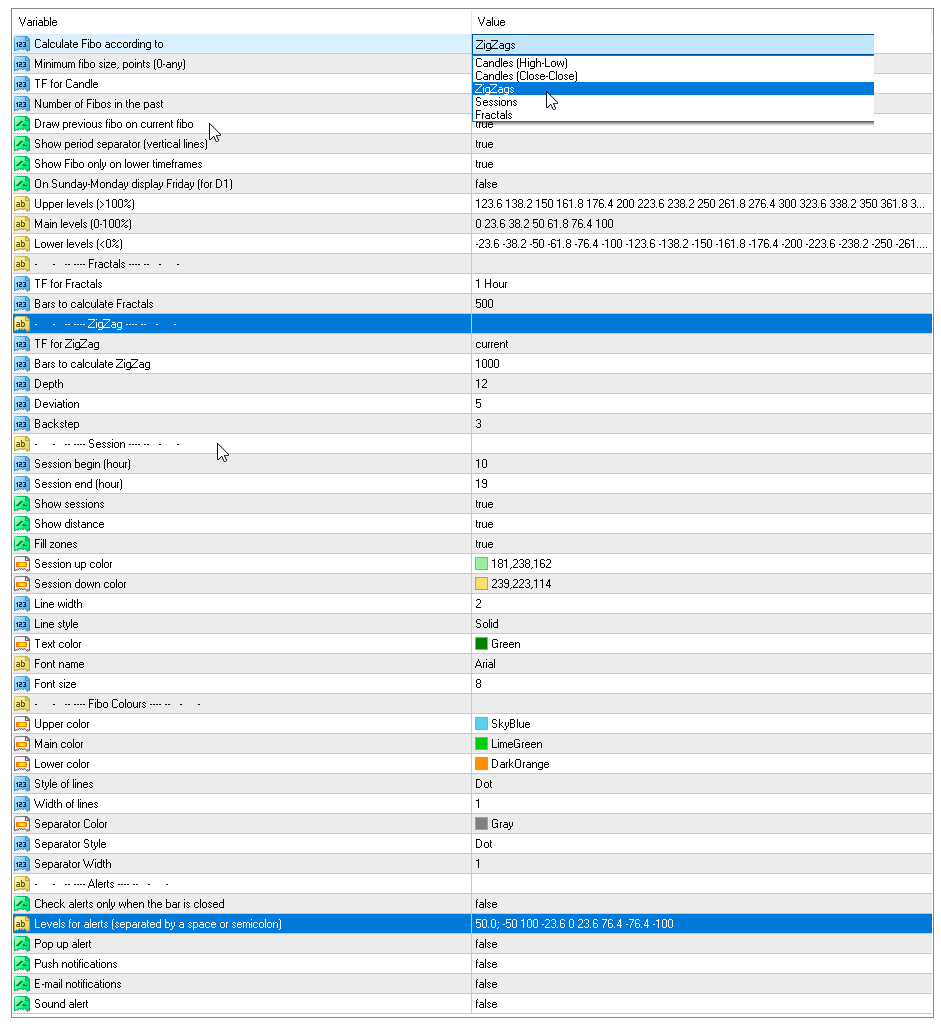
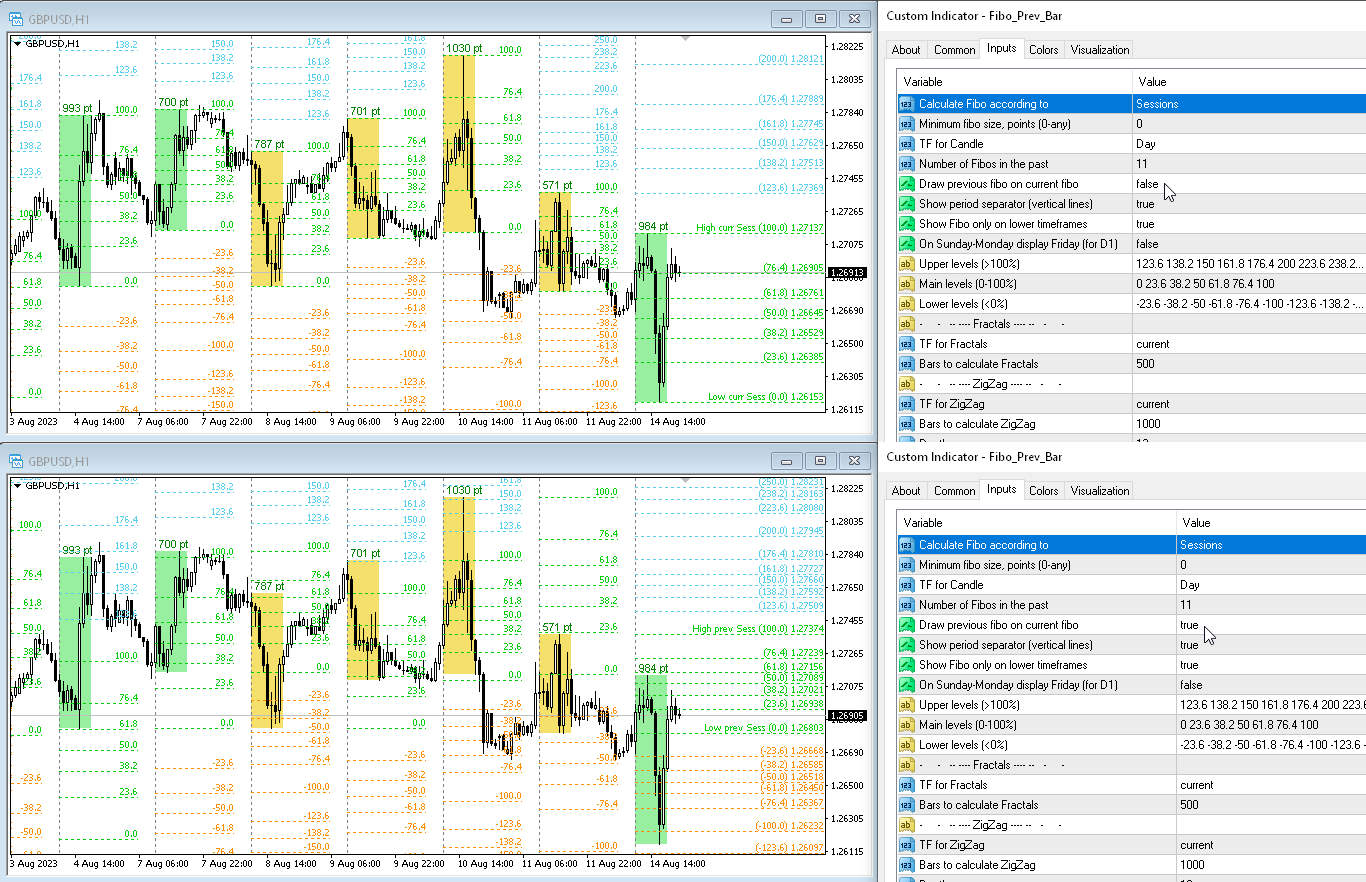
Parameter
Calculate Fibo according to — Berechnen Sie Fibo gemäß den Fibo-Suchmodi:
- Candles (High-Low) — Erstellen Sie ein Fibo basierend auf dem Hoch-Tief;
- Candles (Close-Close) — Erstellen Sie ein Fibo basierend auf dem Close-Close;
- ZigZags — Fibo aus ZigZag-Punkten aufbauen;
- Sessions — Fibo durch Handelssitzungen aufbauen;
- Fractals — Erstellen Sie Fibonacci anhand von Fraktalpunkten.
Minimum fibo size, points (0-any) — die minimale Fibo-Größe in Punkten. Wenn die Fibo kleiner als diese Größe ist, wird sie ignoriert.
TF for Candle — Zeitrahmen von Kerzen zum Aufbau von Fibo-Levels;
Number of Fibo in the past — die Anzahl der Fibo-Stufen, die im Verlauf dargestellt werden sollen;
Upper levels (>100%) — obere Ebenen, die Werte müssen größer als 100 sein (getrennt durch Leerzeichen oder Semikolon);
Main levels (0-100%) — mittlere Ebenen, die Werte müssen zwischen 0 und 100 liegen (durch Leerzeichen oder Semikolon getrennt);
Lower levels (<0%) — untere Ebenen, die Werte müssen kleiner als 100 sein (getrennt durch Leerzeichen oder Semikolon);
Draw previous fibo on current fibo — Zeichne das vorherige Fibo anstelle des aktuellen Fibo. Wenn Sie diesen Parameter deaktivieren, werden Fibos auf den Ebenen gezeichnet, auf denen sie berechnet wurden.
On Sunday-Monday display Friday (for D1) — wenn es am Samstag-Sonntag Notierungen gibt, dann zeichnen Sie eine Freitags-Fibo. Nur für Periode D1;
Show period separator (vertical lines) — Zeigt das Periodentrennzeichen an. Wird als vertikale Linien im Diagramm angezeigt;
Show Fibo only on lower timeframes — Fibo nur in kürzeren Zeiträumen anzeigen;
Upper color — Farbe der oberen Linien;
Main color — Farbe der Mittellinien;
Lower color — Farbe der unteren Linien;
Style of lines — Linienstil;
Width of lines — Linienbreite;
Min pause between signals (sec) — Pause zwischen Alarmen in Sekunden;
Levels for alerts (separated by a space or semicolon) — Ebenen für Warnungen, getrennt durch Leerzeichen oder Semikolon;
Alerts — Popup-Benachrichtigungen aktivieren;
Push notification — Push-Benachrichtigungen aktivieren;
Send e-mail — E-Mails senden.


This is one of the main indicators for my reviews, excellent the attentiveness of the developer to implement suggestions for improvements, great job!