MTF macd for MT5
- Indikatoren
- Version: 1.40
- Aktualisiert: 1 April 2025
- Aktivierungen: 10

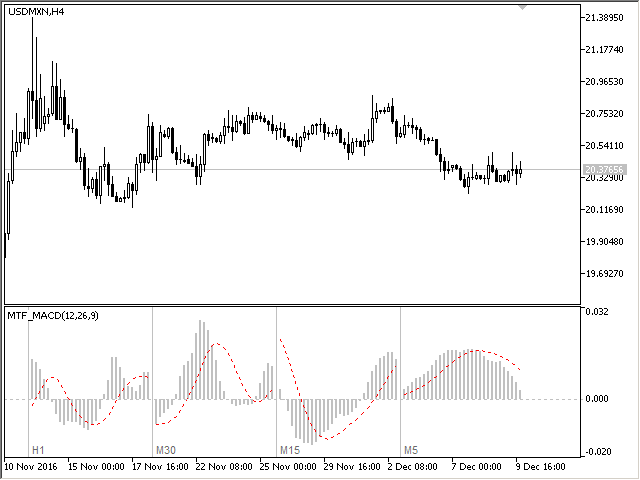
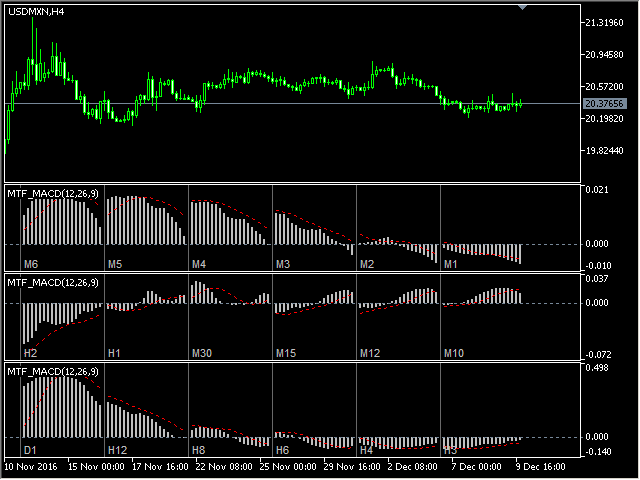
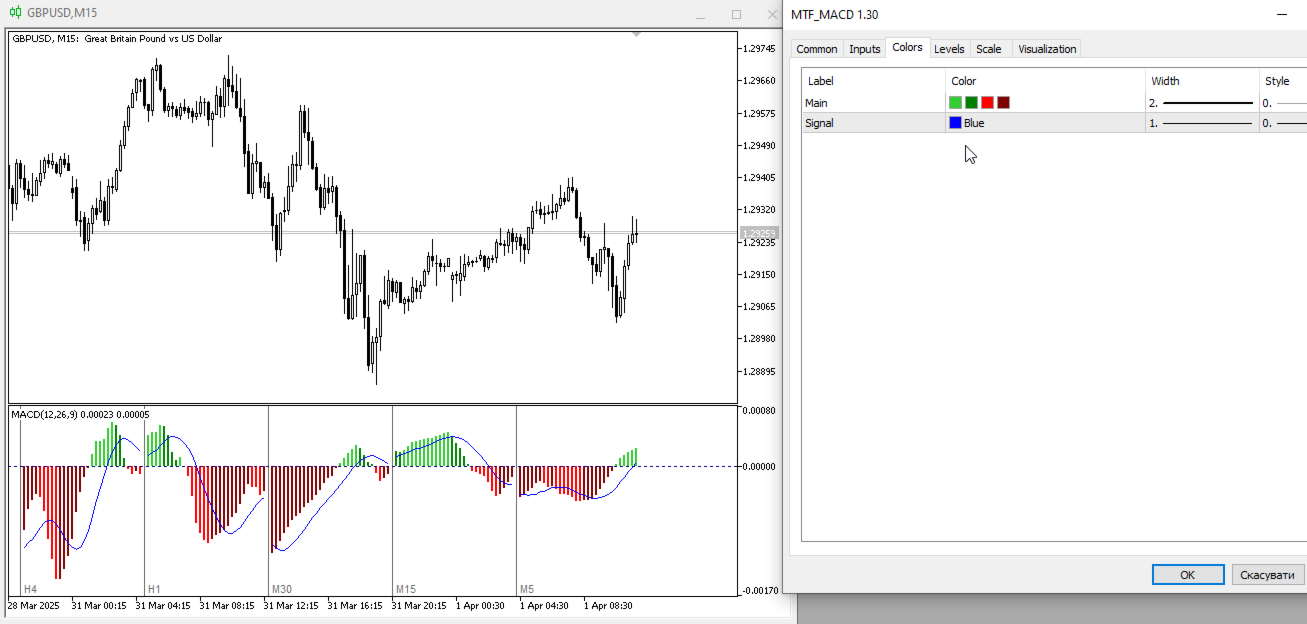
Der Indikator Gleitende Durchschnitte Konvergenz/Divergenz zeigt Informationen aus verschiedenen Perioden gleichzeitig in einem Teilfenster des Charts an.
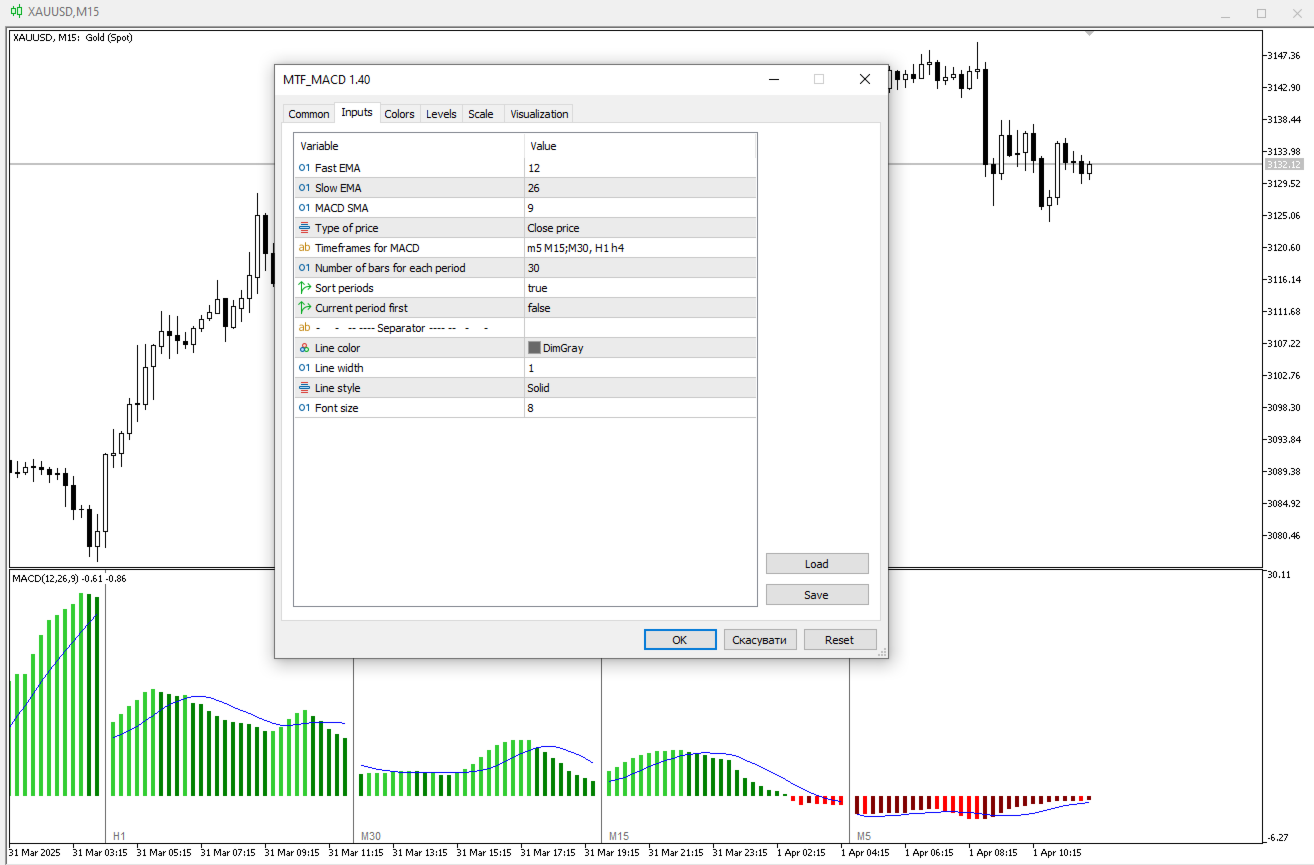
Parameter
- Fast EMA - Periode für die Berechnung des schnellen Durchschnitts.
- Slow EMA - Periode für die Berechnung des langsamen Durchschnitts.
- MACD SMA - Zeitraum für die Berechnung des Mittelwerts aus der Differenz.
- Preistyp - verwendeter Preis.
- Zeitrahmen für MACD - Liste der Perioden, getrennt durch ein Leerzeichen, Komma oder Semikolon.
- Anzahl der Balken für jede Periode - die Anzahl der Balken, die für jede Periode angezeigt werden.
- Zeiträume sortieren - sortiert die Zeiträume, wenn sie in keiner bestimmten Reihenfolge aufgelistet sind.
- Aktuelle Periode zuerst - zeigt die aktuelle Periode zuerst an.