Extremum catcher
- Indikatoren
- Yurij Izyumov
- Version: 1.4
- Aktualisiert: 26 November 2021
- Aktivierungen: 20
The Extremum catcher indicator analyzes the price action after breaking the local Highs and Lows, generates price reversal signals with the ability to plot the Price Channel. If you need the version for MetaTrader 5, see Extremum catcher MT5.
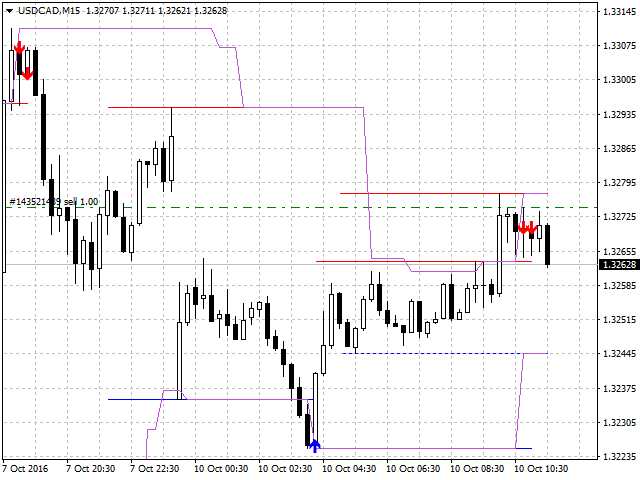
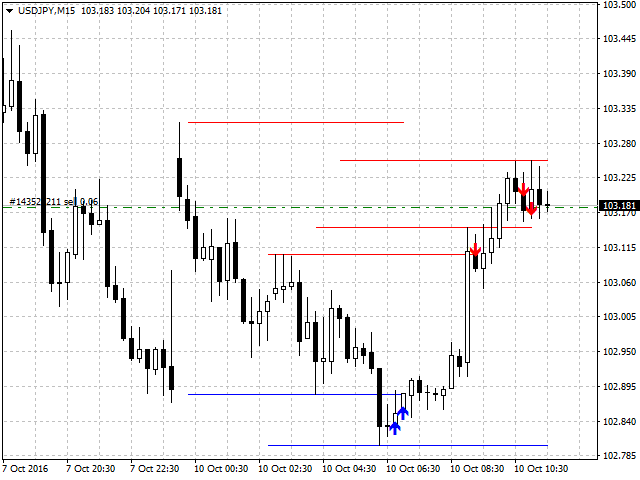
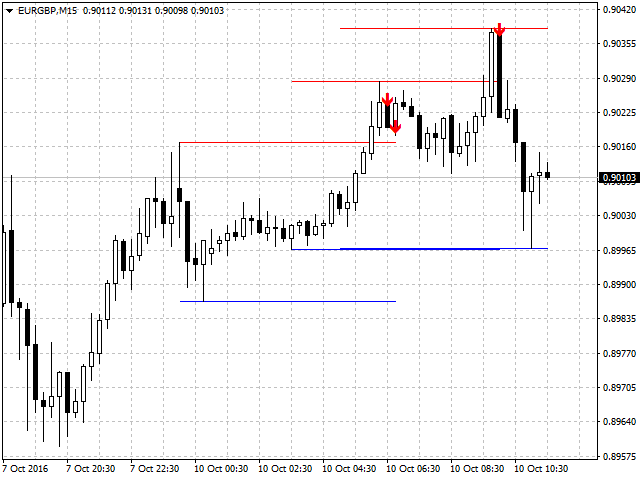
The indicator takes the High and Low of the price over the specified period - 24 bars by default (can be changed). Then, if on the previous candle the price broke the High or Low level and the new candle opened higher than the extremums, then a signal will be generated on the zero candle an arrow for entering a deal (reversal) will be drawn, and the extremum levels will be marked with lines on the chart.
It is possible to filter the Highs as confirmed (Extremum) or unconfirmed (Maximum), this option can be enabled in the settings.
Settings
- barPeriod - the number of candles to search for local extremums.
- Alert - enable sound notification about signal appearance.
- Send notifications - allow sending push notifications to your mobile terminal.
- Type search by - type of entry searching, based on formed extremums - Extremum, or based on maximums - Maximum.
- Show Local Extremum and Maximum - enable/disable display of the local levels;
- Show all Extremum and Maximum - enable/disable display of all used levels;
- Show Price Channel - display the Price Channel indicator on the chart;
- Arrow indentation - offset for arrows. If the arrows on the chart get in your way (they are placed at candle Open), this option allows to move them away from the candles;
- Color Sell - color of the Sell arrow;
- Color Buy - color of the Buy arrow;
- Color Price Channel - color of the Price Channel (if it is enabled).
Indicator buffers
- 0 - Upper border of the Price Channel;
- 1 - Lower border of the Price Channel;
- 2 - Buy signals, if there is no signal = EMPTY_VALUE;
- 3 - Sell signals, if there is no signal = EMPTY_VALUE.
















Another useless indicator. Dont waste your time and money.
The indicator plots arrows against the mommentum, this shows, that many coders don´t have a clue how to code inicators tons of false signals against the trend.