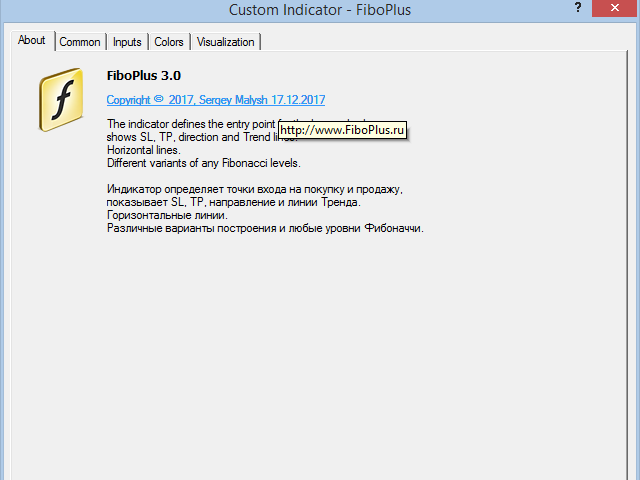
FiboPlus
- Indikatoren
- Sergey Malysh
- Version: 3.1
- Aktualisiert: 28 April 2020
- Aktivierungen: 5
Ein vorgefertigtes Handelssystem, das auf der automatischen Konstruktion und Wartung von Fibonacci-Levels für den Verkauf und Kauf auf jedem Instrument (Symbol) und auf jeder beliebigen Periode des Charts basiert. Bestimmung der Richtung des Trends (14 Indikatoren). Konstruktion von horizontalen Ebenen, Unterstützungs- und Widerstandslinien, Kanälen. Auswahl einer Variante zur Berechnung von Fibonacci-Stufen (6 verschiedene Methoden). Benachrichtigungssystem (auf dem Bildschirm, E-Mail, Push-Benachrichtigungen).
Tasten
Ändern Sie den Stil der Farbumgebung
"Pfeile". Übertragen Sie das Menü an einen zufälligen Ort
Trend direction. Berechnung der Trendrichtung nach jedem Timeframe
Support & Resistance
- Horizontal line Gebäude horizontale Ebenen
- Trend line Konstruktion von Trendlinien
- SUP Unterstützung
- RES Widerstand
- Chanel Channeling
- SUP Unterstützung
- RES Widerstand
- Сhange Fibonacci Wahl der Option, die Fibonacci-Niveaus für Verkauf und Kauf für 6 verschiedene Berechnungen zu berechnen
- Auto durch berechneten Trend
- Flat Käufe und Verkäufe
- Up nur Einkäufe
- Down nur Verkauf
- Ansicht der Algorithmen, die von einem Algorithmus (Change Fibonacci) anderer Varianten erstellt wurden:
- |< der erste
- < vorheriges
- > der nächste
- >| das letzte
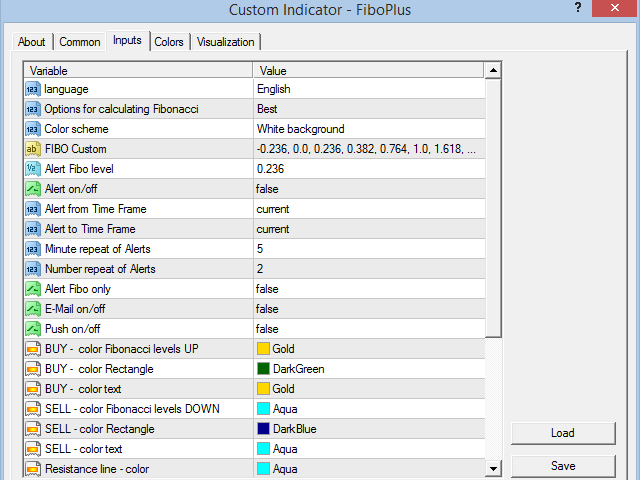
Parameter
Language (Russian, English, Deutsch, Espanol, Portugues)
Fibo level options Fibonacci-Retracement-Optionen:
- Best Kerzen der gleichen Farbe zu der ersten Kerze der entgegengesetzten Farbe
- Standard Standardkonstruktion
- debt of flow Der Schuldenstreit des Market Makers bei starken Marktverwerfungen
- Impulse basierend auf dem Indikator Awesome Oscillator
- Zig_Zag basierend auf dem Indikator Zig_Zag
- RSI basierend auf dem Indikator Relative Strength Index
- White background für weißen Hintergrund
- Black background für schwarzen Hintergrund
- Custom background benutzerdefinierte Einstellungen für alle Farben
User Fibo level Alert benutzerdefinierte Fibonacci-Ebene für Warnungen
Alert on/off Warnungen (aktivieren / deaktivieren)
Alert from Time Frame, Alert to Time Frame - Zeitrahmen für den Betrieb von Warnungen
Minute repeat of Alerts wiederhole es nach ein paar Minuten
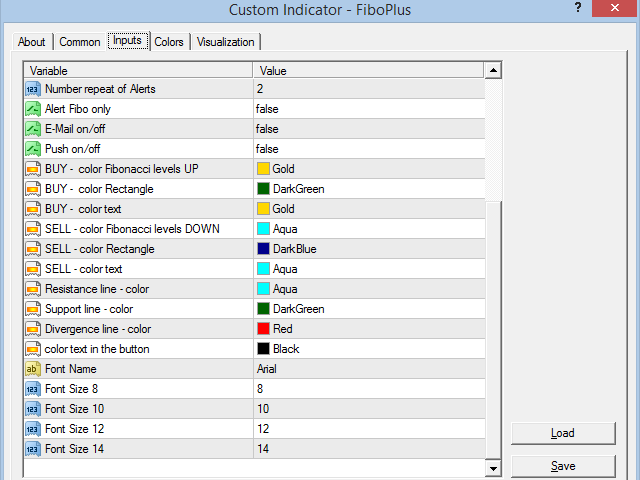
Number repeat of Alerts Anzahl der Wiederholungen von Warnungen
Alert Fibo only Warnt nur auf Fibonacci-Levels
E-Mail on/off E-Mail-Benachrichtigungen senden
Push on/off Senden Sie Benachrichtigungen per Push-Benachrichtigungen
benutzerdefinierte Farbeinstellungen
- BUY - color Fibonacci levels UP, BUY - сolor Rectangle, BUY - сolor text
- SELL - color Fibonacci levels DOWN, SELL - сolor Rectangle, SELL - color text
- Resistance line - color, Support line - color
- Divergence line - color, color text in the button
- Font Name - Schriftartname
- Font Size 8, 10, 12, 14 - Schriftgröße
Handelssystem basierend auf dem Indikator
Verkauf. Die Kerze schloss unter dem 100. Level, der Stop-Loss über dem Level von 76.4, nehmen Gewinn mindestens 161.8, nehmen Gewinn 1 (261.8), nehmen Gewinn 2 (423.6)
Kaufen. Die Kerze schloss über der 100. Ebene, der Stop-Loss unter der Marke von 76,4, Gewinn mindestens 161,8, Gewinn 1 (261,8), Gewinn 2 (423,6)
Kauf / Verkauf in einem rechteckigen Bereich von 0 bis 100. Handel von einer Ebene zur anderen (es gibt keinen Trend)
Früherer Eintritt in den Markt. Melden Sie sich bei der nächsten Kerze an, nach der Bildung eines neuen Fibonacci-Retracement-Stop-Losses von -23,6 (minus 23,6)
Option "debt of flow". FiboPlus bildet die Ebenen der "debt of flow" des Market Makers, der Preis wird wahrscheinlich auf diese Niveaus zurückkehren. Handeln von Level 100 zu Gewinn 1 - 50, nehmen Sie Gewinn 2 - 33. Die zweite Variante der Arbeit, die Einstellung von schwebenden Limit Orders auf den Ebenen von 50% und 33% in der Tendenz.


Renting for a month to see how I like it.