TrendColorBars
- Indikatoren
- Roberto Jacobs
- Version: 3.0
- Aktualisiert: 21 Juni 2023
- Aktivierungen: 5
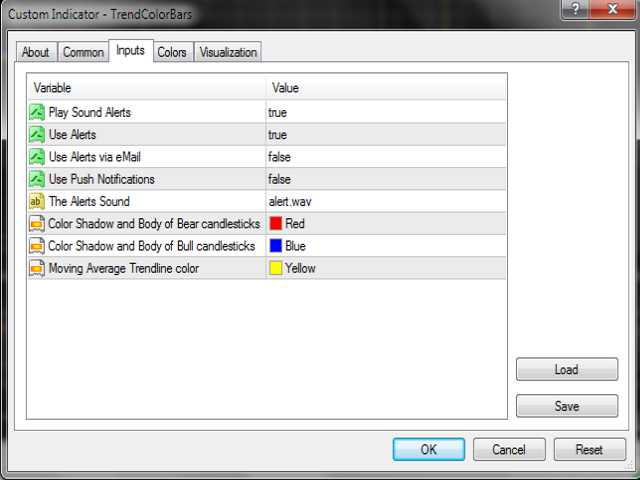
Parameters
- SoundAlerts = true – play sound alerts, true or false (yes or not)
- UseAlerts = true – use alerts, true or false (yes or not)
- eMailAlerts = false – use alerts via email, true or false (yes or not)
- PushNotifications = false – use push notifications, true or false (yes or not)
- SoundAlertFile = "alert.wav" – name of alerts sound file
- ColorBarsDown = clrRed – color body of bearish candlesticks (default – red)
- ColorBarsUps = clrBlue – color body of bullish candlesticks (default – blue)
- ColorTrendLine = clrYellow – Moving Average trendline color (default – yellow)
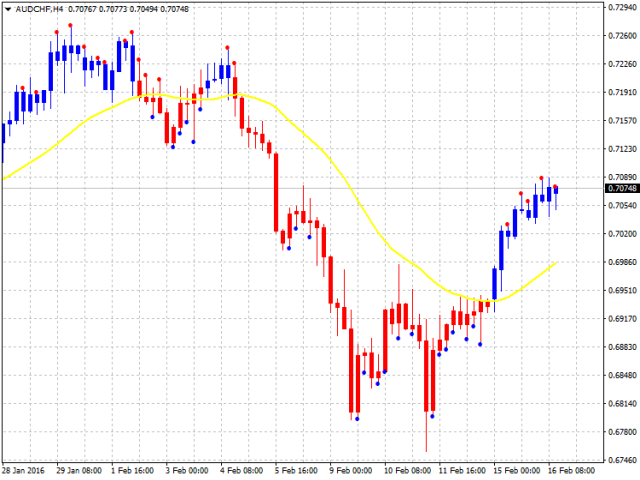
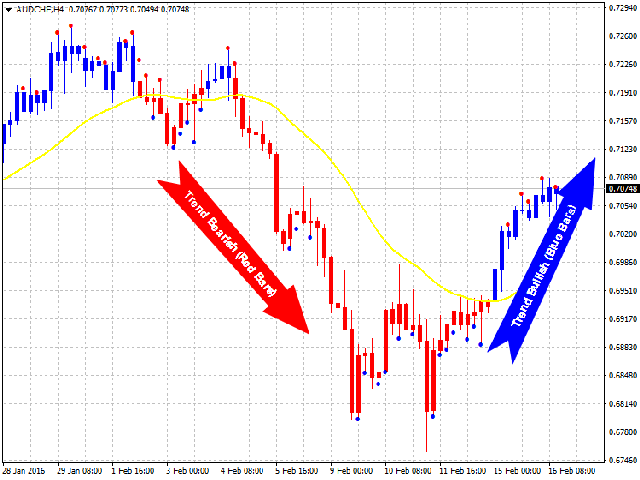
TrendColorBars is the indicator for MT4 which will change the color of bars when the trend changes direction.
In the default setting, if the trend is bullish, the candlesticks bars will be blue, whereas if the bearish trend, the bars will be red candlesticks.
A BLUE candlestick bar above the yellow trend line indicates the bullish trend. The RED candlestick bar (below the yellow trend line) indicates the bearish trend.
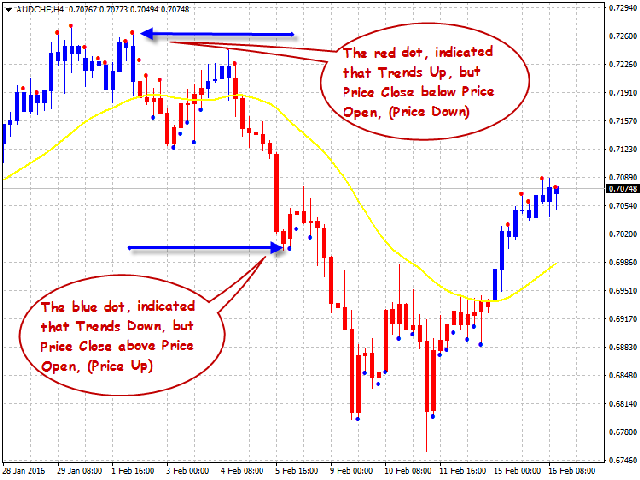
A BLUE candlestick bar with red dots above the yellow trend line indicates that the trend is bullish but Price Close is below Price Open (the price is down). Vice versa, a RED candlestick bar with blue dots below the yellow trend line indicates that the trend is bearish but Price Close is above Price Open (the price is up).
You can change the color of the bar and trendline according to your wishes in the settings.
TrendColorBars indicator can be used on any timeframe from M1 to MN.
The indicator does not repaint and is very easy to use. Simply attach it to a chart and follow the trendline and candlestick bar colors.
TrendColorBars also features pop-up, sound, and email alerts, as well as push notifications. For example: alerts will sound if the trend changes.For more details, see the screenshots.