• Übersicht
  • Bewertungen
  • Diskussion

Intraday Momentum Index IMI

Indicador IMI (Intraday Momentum Index)

Descrição

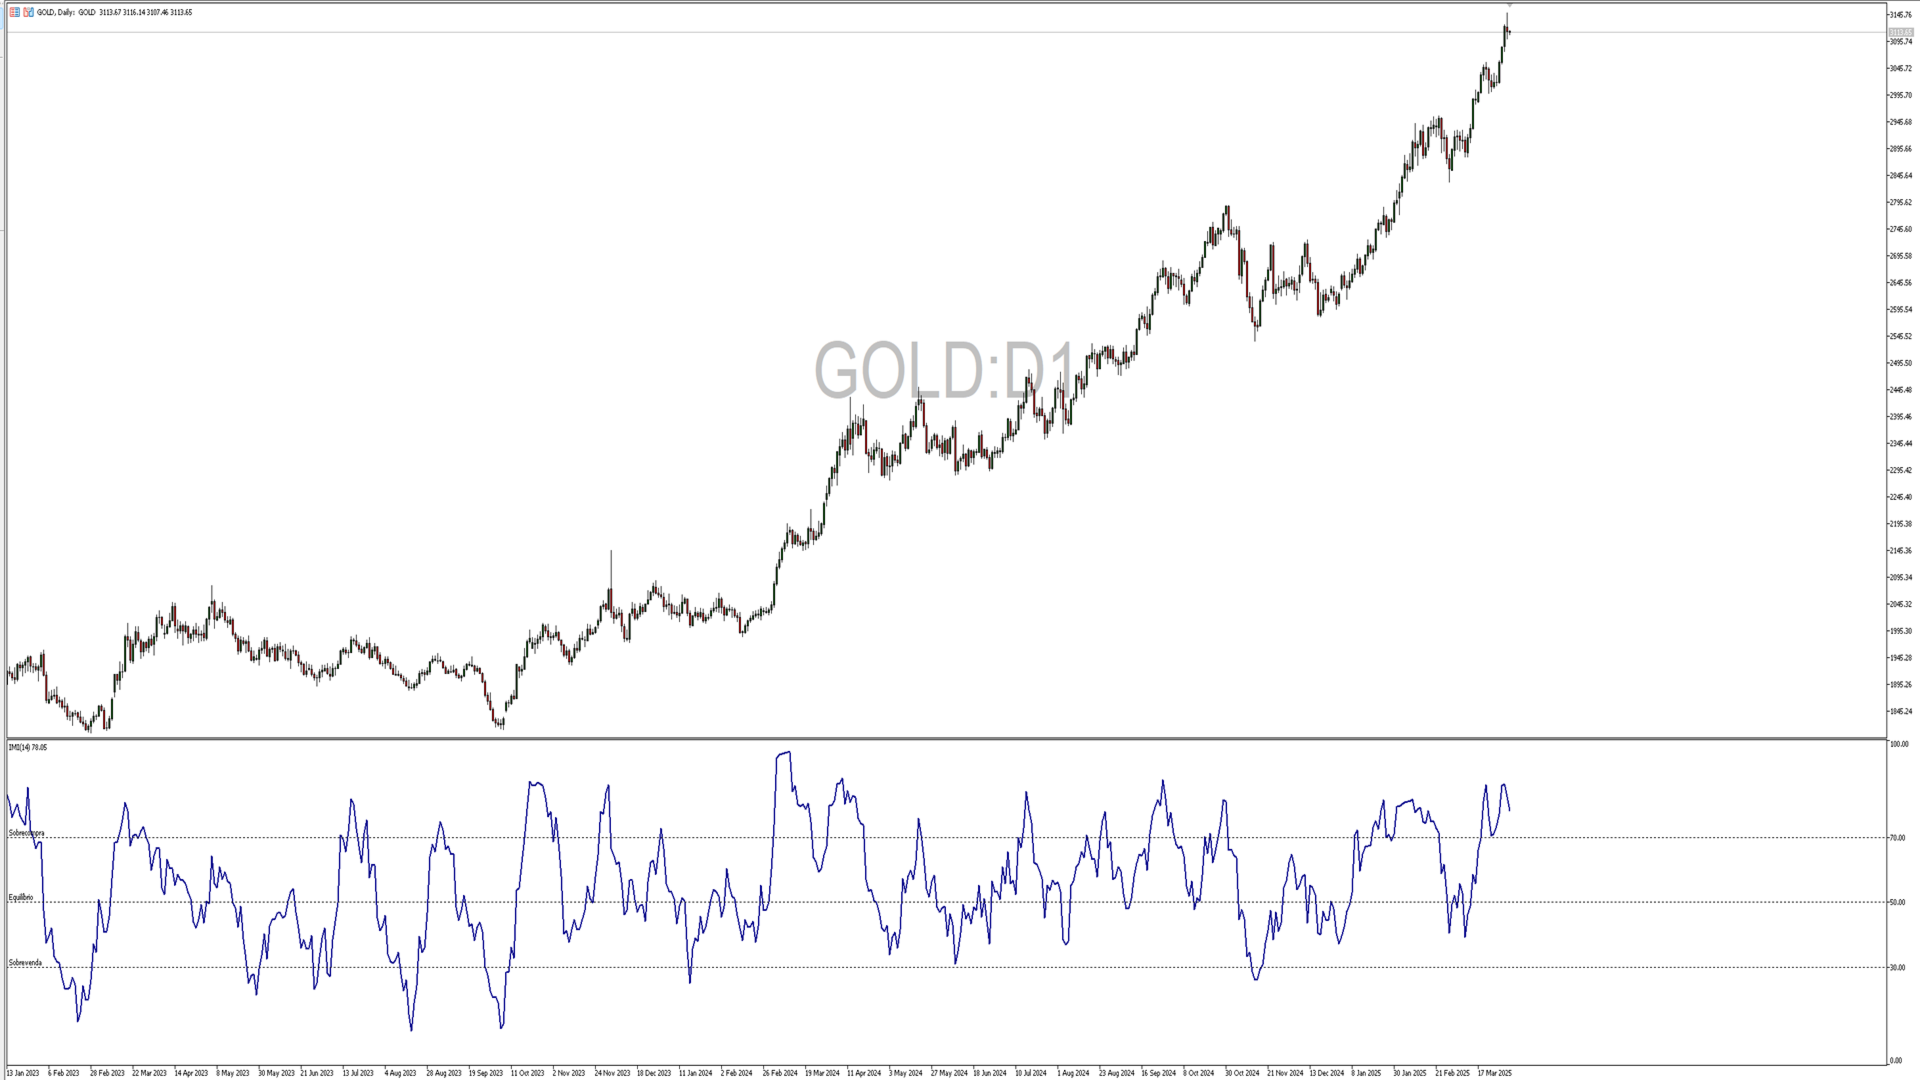
O Indicador IMI (Intraday Momentum Index) é uma poderosa ferramenta de análise técnica desenvolvida para identificar a força do momentum e potenciais reversões no mercado. Este indicador quantifica a relação entre ganhos e perdas durante um período específico, ajudando traders a avaliar a dinâmica atual do mercado.

Características

  • Oscila entre 0 e 100, facilitando a interpretação das condições de mercado
  • Identifica com precisão áreas de sobrecompra (acima de 70) e sobrevenda (abaixo de 30)
  • Inclui uma linha de equilíbrio em 50 que serve como referência para mudanças de tendência
  • Personalizável através de parâmetros intuitivos para se adaptar a diferentes estratégias e timeframes
  • Interface visual otimizada com linhas de níveis claramente identificadas

Como Utilizar

O IMI é versátil e pode ser utilizado de diversas maneiras:

  1. Identificação de sobrecompra/sobrevenda: Valores acima de 70 indicam condições de sobrecompra potencial, enquanto valores abaixo de 30 sugerem condições de sobrevenda.
  2. Divergências: Compare os picos e vales do preço com os do IMI para identificar possíveis divergências, que podem sinalizar reversões iminentes.
  3. Cruzamentos da linha de equilíbrio: O cruzamento do IMI pela linha de 50 pode indicar uma mudança na dinâmica do mercado e potencialmente no sentido da tendência.
  4. Confirmação de tendências: Use o IMI em conjunto com outros indicadores para confirmar a força e a direção da tendência atual.

Parâmetros Personalizáveis

  • Período do IMI: Ajuste o número de barras utilizadas no cálculo (padrão: 14)
  • Tipo de preço: Selecione qual tipo de preço utilizar nos cálculos (padrão: preço de fechamento)
  • Níveis personalizáveis: Ajuste os níveis de equilíbrio, sobrevenda e sobrecompra conforme sua estratégia
  • Cor dos níveis: Personalize a aparência visual do indicador

Instalação

  1. Baixe o arquivo do indicador
  2. Coloque-o na pasta MQL5/Indicators de sua instalação MetaTrader 5
  3. Reinicie o MetaTrader 5 ou atualize a lista de indicadores
  4. Aplique o indicador em qualquer gráfico através da lista de indicadores personalizados

Recomendações

Para melhores resultados, recomenda-se usar o IMI em conjunto com análise de padrões de preço, suportes e resistências, e outros indicadores de confirmação. O indicador funciona bem em diversos timeframes, mas pode ser especialmente eficaz em gráficos de 15 minutos a diários.


Empfohlene Produkte
Follow The Line MT5
Oliver Gideon Amofa Appiah
4.52 (29)
This indicator obeys the popular maxim that: "THE TREND IS YOUR FRIEND" It paints a GREEN line for BUY and also paints a RED line for SELL. (you can change the colors). It gives alarms and alerts of all kinds. IT DOES NOT REPAINT and can be used for all currency pairs and timeframes. Yes, as easy and simple as that. Even a newbie can use it to make great and reliable trades. NB: For best results, get my other premium indicators for more powerful and reliable signals. Get them here: https://www.m
FREE
Bollinger Bands B
Flavio Javier Jarabeck
4.5 (2)
John Bollinger created this indicator in 2010 as a way to read the original indicator (Bollinger Bands) in a more "technical" way, shown as an oscillator. The typical range of the Bollinger Bands %B is 0 - 0.5 - 1.0, where "0" represents the lower band, the "0.5" the middle band, and "1" the upper band. The line on the indicator represents the Closing prices. As simple as that. SETTINGS Bollinger Bands period of analysis Standard Deviation multiplier Shift Price type to be analyzed If you like
FREE
LT Donchian Channel
Thiago Duarte
4.83 (6)
Donchian Channel is an indicator created by Richard Donchian. It is formed by taking the highest high and the lowest low of the last specified period in candles. The area between high and low is the channel for the chosen period. Its configuration is simple. It is possible to have the average between the upper and lower lines, plus you have alerts when price hits one side. If you have any questions or find any bugs, please contact me. Enjoy!
FREE
Free automatic Fibonacci is an indicator that automatically plots a Fibonacci retracement based on the number of bars you select on the BarsToScan setting in the indicator. The Fibonacci is automatically updated in real time as new highest and lowest values appears amongst the selected bars. You can select which level values to be displayed in the indicator settings. You can also select the color of the levels thus enabling the trader to be able to attach the indicator several times with differe
FREE
RSI abcd
Francisco Gomes Da Silva
RSI ABCD-Musterfinder: Technische Strategie 1. Funktionsweise des Indikators Kombiniert den klassischen RSI mit automatischer Erkennung von ABCD-Harmonie-Mustern . Hauptkomponenten Standard-RSI (einstellbare Periode) Hoch- und Tiefpunkte-Markierungen (Pfeile) ABCD-Muster (grüne/rote Linien) Überkauft (70) und Überverkauft (30) Filter 2. MT5-Einstellungen period = 14 ; // RSI-Periode size = 4 ; // Maximale Muster-Größe OverBought = 70 ; // Überkauft-Level OverSold = 30 ; // Überverkauft-Level Fil
FREE
Mitimom
Danil Poletavkin
The indicator is based on Robert Miner's methodology described in his book "High probability trading strategies" and displays signals along with momentum of 2 timeframes. A Stochastic oscillator is used as a momentum indicator. The settings speak for themselves period_1 is the current timeframe, 'current' period_2 is indicated - the senior timeframe is 4 or 5 times larger than the current one. For example, if the current one is 5 minutes, then the older one will be 20 minutes The rest of the s
FREE
High Low Open Close
Alexandre Borela
4.98 (43)
Wenn Sie dieses Projekt mögen, hinterlassen Sie eine 5-Sterne-Bewertung. Dieser Indikator zieht die offenen, hohen, niedrigen und schließenden Preise für die angegebenen und kann für eine bestimmte Zeitzone eingestellt werden. Dies sind wichtige Ebenen, die von vielen institutionellen und professionellen Händler und kann nützlich sein, um die Orte, wo sie vielleicht mehr aktiv. Die verfügbaren Zeiträume sind: Vorheriger Tag. Vorherige Woche. Vorheriger Monat. Vorheriges Viertel. Vorheriges Jahr
FREE
Dual RSI
Paul Conrad Carlson
3 (1)
Indicator alerts for Dual Relative strength index rsi. Large rsi preset at 14 is below 30 small rsi preset at 4 is below 10 for buy bullish signals . Large rsi preset are 14 is above 70 small rsi preset at 4 is above 90 for sell bearish signals . Includes mobile and terminal alerts. draws lines when alerts. This indicator can help identify extremes and then the tops or bottoms of those extremes .
FREE
The indicator highlights the points that a professional trader sees in ordinary indicators. VisualVol visually displays different volatility indicators on a single scale and a common align. Highlights the excess of volume indicators in color. At the same time, Tick and Real Volume, Actual range, ATR, candle size and return (open-close difference) can be displayed. Thanks to VisualVol, you will see the market periods and the right time for different trading operations. This version is intended f
FREE
Are you tired of drawing trendlines every time you're analyzing charts? Or perhaps you would like more consistency in your technical analysis. Then this is for you. This indicator will draw trend lines automatically when dropped on a chart. How it works Works similar to standard deviation channel found on mt4 and mt5. It has 2 parameters: 1. Starting Bar 2. Number of bars for calculation The   starting bar   is the bar which drawing of the trend lines will begin, while the   number of bars for c
FREE
MIDAS Super VWAP
Flavio Javier Jarabeck
4.44 (9)
Imagine VWAP, MVWAP and MIDAS in one place... Well, you found it! Now you can track the movement of Big Players in various ways, as they in general pursue the benchmarks related to this measuring, gauging if they had good execution or poor execution on their orders. Traders and analysts use the VWAP to eliminate the noise that occurs throughout the day, so they can measure what prices buyers and sellers are really trading. VWAP gives traders insight into how a stock trades for that day and deter
FREE
Value Chart Candlesticks
Flavio Javier Jarabeck
4.73 (11)
The idea of a Value Chart indicator was presented in the very good book I read back in 2020 , " Dynamic Trading Indicators: Winning with Value Charts and Price Action Profile ", from the authors Mark Helweg and David Stendahl. The idea is simple and the result is pure genius: Present candlestick Price analysis in a detrended way! HOW TO READ THIS INDICATOR Look for Overbought and Oversold levels. Of course, you will need to test the settings a lot to find the "correct" one for your approach. It
FREE
Moving line
Jun Chao Jiang
The one minute chart has a bug, but the one-day chart can still be used after deleting the bug and reloading the indicators, This indicator can be used to determine how far the indicator goes up to place an order to buy, how far it goes down to place an order to sell, and not placing an order until it reaches this distance, which is considered oscillation, open an account gift index
FREE
Reversal Composite Candles
MetaQuotes Ltd.
3.57 (14)
The idea of the system is to indentify the reversal patterns using the calculation of the composite candle. The reversal patterns is similar to the "Hammer" and "Hanging Man" patterns in Japanese candlestick analysis. But it uses the composite candle instead the single candle and doesn't need the small body of the composite candle to confirm the reversal. Input parameters: Range - maximal number of bars, used in the calculation of the composite candle. Minimum - minimal size of the composite can
FREE
Donchian Pro
Paulo Henrique Faquineli Garcia
5 (3)
The Donchian Channel Channels are among the most popular tools of technical analysis, as they visually convey to the analyst the limits within which most price movement tends to occur. Channel users know that valuable information can be obtained at any time, whether prices are in the central region of a band or close to one of the border lines. One of the best known techniques to explore these concepts is Bollinger Bands. However, John Bollinger was not the only one to research the application
FREE
Introduction This indicator detects volume spread patterns for buy and sell opportunity. The patterns include demand and supply patterns. You might use each pattern for trading. However, these patterns are best used to detect the demand zone (=accumulation area) and supply zone (=distribution area). Demand pattern indicates generally potential buying opportunity. Supply pattern indicates generally potential selling opportunity. These are the underlying patterns rather than direct price action. T
FREE
Weis Waves
Flavio Javier Jarabeck
2.83 (18)
The original author is David Weis, an expert in the Wyckoff Method. The Weis Wave is a modern adaptation of the 1930's Wyckoff Method, another expert in Tape Reading techniques and Chart Analysis. Weis Waves takes market volume and stacks it into waves according to price conditions giving the trader valuable insights about the market conditions. If you want to learn more about this subject you can find tons of videos in YouTube. Just look for "The Wickoff Method", "Weis Wave" and "Volume Spread
FREE
Supports And Resistances Lines
Francisco Gomes Da Silva
4.76 (38)
Indikator für Unterstützungs- und Widerstandszonen MT5 Dieser Indikator kann Hochs und Tiefs automatisch erkennen. Dieser Unterstützungs- und Widerstandsindikator erstellt Unterstützungslinien und Widerstandslinien basierend auf Hochs und Tiefs. wie man Unterstützungs- und Widerstandslinien erstellt. Dies ist ein Indikator, um automatische Unterstützungs- und Widerstandslinien zu erstellen. wie man das Unterstützungsniveau mit dem Indikator findet. Dieser Indikator findet automatisch Hochs und T
FREE
ViX 75 BOT FushionEA
Theodorus Bernadu Kleynhans
This EA runs on Volatility 75 index (M12 Timeframe). EA is fully dynamic (dynamic lot size, dynamic SL, dynamic TP, and dynamic trailing SL). Recommended account $200. Please note, Volatility 75 Index is available on Deriv Broker (make sure to use on Volatility 75 Index, 12M timeframe) Please join discord for any and all questions. For Volatility indexes use Deriv (broker) https://deriv.com/markets/derived-indices/synthetic-indices Direct purchases will only be in discord. Assorted bots avail
FREE
Bar Color Trend
Germano Chagas
4.38 (8)
Combining the best of Price Action , Directional Movement , and Divergence/Convergence analysis, Candle Color Trend is a easy and reliable way to identify trend direction. The indicator automatically paints the candles according to the assumption that an uptrend is defined by prices that form a series of higher highs and higher lows. In contrast, a downtrend is defined by prices that form a series of lower highs and lower lows. Additionally, ADX Wilder indicator is used to measure trend weakness
FREE
Important Lines
Terence Gronowski
4.86 (21)
Important Lines Indikator (M1 - M15) Dieser Indikator zeigt Pivot-Lines, vortages Hoch und Tief, vortages Close und das Minimum und Maximum der vorherigen Stunde an. Sie müssen nur diesen einzelnen Indikator in das Diagramm ziehen, um alle diese wichtigen Linien zu haben. Sie können sich das Laden vieler einzelnen Indikatoren ersparen. Warum sind bestimmte Linien beim Traden so wichtig? Vortageshoch und -tief: Diese werden von Händlern beobachtet, die in einer Tages-Chart handeln. Sehr oft, w
FREE
Der Indikator   "Haven Key Levels PDH PDL"   hilft Tradern dabei, wichtige Schlüssellevels im Chart zu visualisieren. Er markiert automatisch die folgenden Levels: DO (Daily Open)   — Eröffnungslevel des Tages. NYM (New York Midnight)   — Mitternachtslevel von New York. PDH (Previous Day High)   — Höchststand des Vortages. PDL (Previous Day Low)   — Tiefststand des Vortages. WO (Weekly Open)   — Eröffnungslevel der Woche. MO (Monthly Open)   — Eröffnungslevel des Monats. PWH (Previous Week High
FREE
Pivot MT5
Dmitrij Isaenko
Der Indikator zeichnet die täglichen Unterstützungs- und Widerstandslinien auf dem Chart sowie die Pivot-Ebene (Pivot-Ebene). Angepasst an MT5 zu arbeiten Indikatorparameter: DayBack - die Anzahl der Tage zum Markieren von Linien; PPcolor - Linienfarbe Pivot; PPbreite - Liniendicke Pivot; PPstyle - Linienstil Pivot; Supp - Farbe der Hilfslinien; Sstyle - Unterstützungslinienstil; Breite - Dicke der Stützlinien; Resist - Farbe der Widerstandslinien; Rstyle - Widerstandslinienstil; Rwidth - Dic
FREE
Daily High Low Danilo Monteiro
Danilo Hudson Couto Monteiro
# Indicador Daily High - Danilo Monteiro - MT5 ## Descrição O Daily High/Low Labels é um indicador personalizado para MetaTrader 5 que exibe automaticamente as máximas e mínimas diárias no gráfico, facilitando a identificação rápida dos níveis importantes de preço. O indicador marca os preços com etiquetas e linhas horizontais, permitindo uma visualização clara dos níveis críticos do dia atual e anterior. ## Principais Características ### 1. Marcação Automática - Exibe automaticamente as máxi
FREE
Super Trend eu
Emin Ulucanli
4.75 (4)
SUPERTREND; Es ist ein Trendfolgeindikator, der auf dem von Olivier Seban erstellten SuperTrend ATR basiert. Es kann verwendet werden, um Änderungen in der Trendrichtung zu erkennen und Stopps zu lokalisieren. Wenn der Preis unter die Indikatorkurve fällt, wird er rot und zeigt einen Abwärtstrend an. Wenn sich der Preis dagegen über die Kurve bewegt, wird der Indikator grün und zeigt einen Aufwärtstrend an. Wie andere Indikatoren funktioniert es gut auf SuperTrend, wenn es in Verbindung mit ande
FREE
Cybertrade Keltner Channels
Emanuel Andriato
4.75 (4)
Cybertrade Keltner Channels - MT5 Created by Chester Keltner, this is a volatility indicator used by technical analysis. It is possible to follow the trend of financial asset prices and generate support and resistance patterns. In addition, envelopes are a way of tracking volatility in order to identify opportunities to buy and sell these assets. It works on periods longer than the period visible on the chart. All values ​​are available in the form of buffers to simplify possible automations.
FREE
Necessary for traders: tools and indicators Waves automatically calculate indicators, channel trend trading Perfect trend-wave automatic calculation channel calculation , MT4 Perfect trend-wave automatic calculation channel calculation , MT5 Local Trading copying Easy And Fast Copy , MT4 Easy And Fast Copy , MT5 Local Trading copying For DEMO Easy And Fast Copy , MT4 DEMO Easy And Fast Copy , MT5 DEMO The homeopathic indicator is also called the CCI indicator. The CCI indicator was proposed
FREE
Easy GOLD MT5
Franck Martin
3.97 (32)
Easy Gold is the latest addition to the BotGPT family. It is surprising and very powerful. It is ideal for beginners due to its simplicity.  There is absolutely nothing to do, it's 100% automated, simply indicate the percentage of risk you want to take per trade and the EA is ready. Whatever your capital, the EA takes care of everything. Optimized on (XAUUSD).  Unleash all the power with the professional version (AGI Gold) and its connection to the neural network, available in my store. My othe
FREE
Haven FVG Indicator
Maksim Tarutin
5 (1)
Der Indikator   Haven FVG   ist ein Tool zur Marktanalyse, das es ermöglicht, Ineffizienzbereiche (Fair Value Gaps, FVG) im Chart zu identifizieren und Händlern wichtige Preisniveaus für die Analyse und Handelsentscheidungen zur Verfügung stellt. Weitere Produkte ->  HIER Hauptmerkmale: Individuelle Farbeinstellungen: Farbe für bullisches FVG   (Bullish FVG Color). Farbe für bärisches FVG   (Bearish FVG Color). Flexible FVG-Visualisierung: Maximale Anzahl von Kerzen zur FVG-Suche. Zusätzliche V
FREE
All Harmonics 26 demo
Alexey Isavnin
4.25 (4)
This is the demo version of "All Harmonics 26" indicator . "All Harmonics 26" searches for 26 types of harmonic patterns and outputs them in a convenient way. You can check out the documentation here . This demo version has the following limitations: The indicator searches only for one type of harmonic patterns out of 26:- Gartley. The indicator outputs new patterns with a lag of 10 bars.
FREE
Käufer dieses Produkts erwarben auch
Trend Screener Pro MT5
STE S.S.COMPANY
4.85 (82)
Nutzen Sie die Macht des Trendhandels mit Trend Screener Indicator: Ihrer ultimativen Trendhandelslösung, die auf Fuzzy-Logik und einem System mit mehreren Währungen basiert! Steigern Sie Ihren Trendhandel mit Trend Screener, dem revolutionären Trendindikator mit Fuzzy-Logik. Es handelt sich um einen leistungsstarken Trendfolgeindikator, der über 13 Premium-Tools und -Funktionen sowie 3 Handelsstrategien kombiniert und ihn zu einer vielseitigen Wahl macht, um Ihren Metatrader in einen Trendanaly
Divergence Bomber
Ihor Otkydach
5 (5)
Jeder Käufer dieses Indikators erhält zusätzlich kostenlos: Das exklusive Tool „Bomber Utility“, das jede Handelsposition automatisch begleitet, Stop-Loss- und Take-Profit-Niveaus setzt und Trades gemäß den Regeln der Strategie schließt Set-Dateien zur Konfiguration des Indikators für verschiedene Handelsinstrumente Set-Dateien zur Konfiguration des Bomber Utility in den Modi: „Minimales Risiko“, „Ausgewogenes Risiko“ und „Abwartende Strategie“ Ein Schritt-für-Schritt-Videohandbuch, das Ihnen hi
Golden Trend Indicator MT5
Noha Mohamed Fathy Younes Badr
4.89 (18)
Golden Trend indicator  is The best indicator for predicting trend movement this indicator never lags and never repaints and never back paints    and give  arrow buy and sell    before the candle appear  and it will help you and  will make your trading decisions clearer its work on all currencies and  gold and crypto and all time frame This unique  indicator uses very secret algorithms to catch the  trends, so you can trade using this indicator and see the trend clear on charts  manual guide and
Algo Pumping
Ihor Otkydach
5 (11)
PUMPING STATION – Ihre persönliche „All-inclusive“-Strategie Wir präsentieren Ihnen PUMPING STATION – einen revolutionären Forex-Indikator, der Ihr Trading in eine spannende und effektive Erfahrung verwandeln wird. Es handelt sich nicht nur um ein Hilfsmittel, sondern um ein vollwertiges Handelssystem mit leistungsstarken Algorithmen, die Ihnen helfen, stabiler zu traden. Beim Kauf dieses Produkts erhalten Sie KOSTENLOS: Exklusive Set-Dateien: Für automatische Einrichtung und maximale Leistung.
Gold Stuff mt5
Vasiliy Strukov
4.93 (179)
Gold Stuff mt5-Ein Trendindikator, der speziell für Gold entwickelt wurde, kann auch auf allen Finanzinstrumenten verwendet werden. Der Indikator wird nicht neu gezeichnet und verzögert sich nicht. Empfohlener Zeitrahmen H1. WICHTIG! Kontaktieren Sie mich sofort nach dem Kauf, um Anweisungen und Bonus zu erhalten!     Sie können eine kostenlose Kopie unseres Strong Support- und Trendscanner-Indikators erhalten, bitte senden Sie uns eine persönliche Nachricht. Mich! DATEN Draw Arrow - inkl.a
TPSproTREND PrO MT5
Roman Podpora
4.72 (18)
VERSION MT4        —        ИНСТРУКЦИЯ RUS           —        INSTRUCTIONS  ENG Hauptfunktionen: Präzise Eingangssignale OHNE RENDERING! Wenn ein Signal erscheint, bleibt es relevant! Dies ist ein wichtiger Unterschied zu Redraw-Indikatoren, die ein Signal liefern und es dann ändern können, was zu einem Verlust des eingezahlten Geldes führen kann. Jetzt können Sie mit größerer Wahrscheinlichkeit und Genauigkeit in den Markt eintreten. Es gibt auch eine Funktion zum Einfärben der Kerzen nach dem
Quantum TrendPulse
Bogdan Ion Puscasu
5 (13)
Wir stellen   Quantum TrendPulse   vor, das ultimative Handelstool, das die Leistung von   SuperTrend   ,   RSI   und   Stochastic   in einem umfassenden Indikator vereint, um Ihr Handelspotenzial zu maximieren. Dieser Indikator wurde für Händler entwickelt, die Präzision und Effizienz suchen, und hilft Ihnen dabei, Markttrends, Momentumverschiebungen und optimale Ein- und Ausstiegspunkte sicher zu erkennen. Hauptmerkmale: SuperTrend-Integration:   Folgen Sie problemlos dem vorherrschenden Markt
TPSpro RFI Levels MT5
Roman Podpora
4.55 (20)
Umkehrzonen / Spitzenvolumina / Aktive Zonen eines Hauptakteurs = TS TPSPROSYSTEM ANLEITUNG RUS    /    ANWEISUNGEN     ENG          /          Version MT4      Jeder Käufer dieses Indikators erhält zusätzlich KOSTENLOS: 6 Monate Zugriff auf Handelssignale vom Dienst RFI SIGNALS – vorgefertigte Einstiegspunkte gemäß dem TPSproSYSTEM-Algorithmus. Schulungsmaterialien mit regelmäßigen Updates – tauchen Sie in die Strategie ein und steigern Sie Ihr berufliches Niveau. 24/5-Support an Wochentagen u
Support And Resistance Screener ist ein Level-Indikator für MetaTrader, der mehrere Tools innerhalb eines Indikators bietet. Die verfügbaren Werkzeuge sind: 1. Marktstruktur-Screener. 2. Bullische Pullback-Zone. 3. Bärische Pullback-Zone. 4. Tägliche Pivot-Punkte 5. wöchentliche Pivots-Punkte 6. monatliche Pivots-Punkte 7. Starke Unterstützung und Widerstand basierend auf harmonischem Muster und Volumen. 8. Zonen auf Bankebene. ZEITLICH BEGRENZTES ANGEBOT: HV Support and Resistance Indicator ist
RelicusRoad Pro MT5
Relicus LLC
4.79 (19)
Jetzt 147 US -Dollar (nach ein paar Aktualisierungen auf 499 US -Dollar) - Unbegrenzte Konten (PCs oder MACs) RelicusRoad Benutzerhandbuch + Schulungsvideos + Zugang zur privaten Discord-Gruppe + VIP-Status EINE NEUE ART, DEN MARKT ZU BETRACHTEN RelicusRoad ist der weltweit leistungsstärkste Handelsindikator für Forex, Futures, Kryptowährungen, Aktien und Indizes und gibt Händlern alle Informationen und Tools, die sie benötigen, um profitabel zu bleiben. Wir bieten technische Analysen und Ha
*** Entry In The Zone und SMC Multi Timeframe ist ein Echtzeit-Marktanalyse-Tool, das auf dem Smart Money Concept (SMC) basiert. Es integriert effektiv Umkehrsignale und identifiziert automatisch wichtige Umkehrzonen durch Multi-Timeframe-Strukturerkennung sowie die Identifizierung von Points of Interest (POI). Dieses Tool wurde entwickelt, um Händlern zu helfen, mit mehr Vertrauen und einem strukturierten Ansatz zu planen und Entscheidungen zu treffen. *** Funktionen: - Automatische Markstruktu
FX Volume MT5
Daniel Stein
4.82 (17)
FX Volume: Erleben Sie den echten Marktüberblick aus der Sicht eines Brokers Kurzüberblick Möchten Sie Ihre Handelsstrategie auf das nächste Level bringen? FX Volume liefert Ihnen Echtzeit-Einblicke in die Positionierung von Retail-Tradern und Brokern — lange bevor verzögerte Berichte wie der COT verfügbar sind. Ob Sie nach beständigen Gewinnen streben oder einfach einen tieferen Vorteil am Markt suchen, FX Volume hilft Ihnen, große Ungleichgewichte zu erkennen, Breakouts zu bestätigen und Ihr
Matrix Arrow Indicator MT5
Juvenille Emperor Limited
5 (13)
Matrix Arrow Indicator MT5   ist ein einzigartiger 10-in-1-Trend, der zu   100 % nicht neu gezeichnet   werden kann. Multi-Timeframe-Indikator, der für alle Symbole/Instrumente verwendet werden kann:   Forex ,   Rohstoffe ,   Kryptowährungen ,   Indizes ,   Aktien .  Der  Matrix Arrow Indicator MT5  wird den aktuellen Trend in seinen frühen Stadien bestimmen und Informationen und Daten von bis zu 10 Standardindikatoren sammeln, die sind: Durchschnittlicher Richtungsbewegungsindex (ADX) Rohstoff
FourAverageMT5
Mikhail Sergeev
5 (2)
FourAverage ist ein neues Wort bei der Trenderkennung. Mit der Entwicklung der Informationstechnologie und einer großen Anzahl von Teilnehmern sind die Finanzmärkte zunehmend weniger anfällig für die Analyse veralteter Indikatoren. Herkömmliche technische Analysetools wie der gleitende Durchschnitt oder der Stochastik sind nicht in der Lage, die Richtung eines Trends oder seine Umkehrung in seiner reinen Form zu bestimmen. Kann ein Indikator die richtige Richtung des zukünftigen Preises anzeigen
FX Levels MT5
Daniel Stein
5 (4)
FX Levels: Außerordentlich präzise Unterstützungs- und Widerstandszonen für alle Märkte Kurzüberblick Suchen Sie eine verlässliche Methode, um Support- und Resistance-Level in jedem Markt zu identifizieren—egal ob Währungspaare, Indizes, Aktien oder Rohstoffe? FX Levels vereint die traditionelle „Lighthouse“-Methode mit einem modernen dynamischen Ansatz und bietet nahezu universelle Genauigkeit. Durch unsere Erfahrung mit echten Brokern sowie automatischen täglichen und Echtzeit-Updates hilft
FX Power MT5 NG
Daniel Stein
5 (15)
FX Power: Analysieren Sie die Stärke von Währungen für intelligentere Handelsentscheidungen Übersicht FX Power ist Ihr unverzichtbares Werkzeug, um die tatsächliche Stärke von Währungen und Gold unter allen Marktbedingungen zu verstehen. Indem Sie starke Währungen kaufen und schwache verkaufen, vereinfacht FX Power Ihre Handelsentscheidungen und deckt Chancen mit hoher Wahrscheinlichkeit auf. Ob Sie Trends folgen oder extreme Delta-Werte nutzen, um Umkehrungen zu prognostizieren, dieses Tool p
MetaBands M5
Vahidreza Heidar Gholami
4.5 (2)
MetaBands verwendet leistungsstarke und einzigartige Algorithmen, um Kanäle zu zeichnen und Trends zu erkennen, sodass es Tradern potenzielle Punkte für den Einstieg und Ausstieg aus Trades bieten kann. Es ist ein Kanalindikator sowie ein leistungsstarker Trendindikator. Es umfasst verschiedene Arten von Kanälen, die einfach durch Verwendung der Eingabeparameter zusammengeführt werden können. MetaBands verwendet alle Arten von Warnmeldungen, um Benutzer über Marktereignisse zu informieren. Funkt
MonetTrend — Премиум-индикатор для торговли по тренду (M30, H1, H4) MonetTrend — это мощный и визуально понятный трендовый индикатор, созданный для торговли на таймфреймах M30, H1 и H4. Он идеально подходит для работы с волатильными инструментами, такими как: • Золото (XAUUSD) • Криптовалюты (BTCUSD) • Валютные пары (EURUSD, USDJPY и др.) Ключевые особенности MonetTrend: • Автоматическое отображение Take Profit 1 (TP1) и Stop Loss (SL): После появления сигнала индикатор сразу показывает: • TP
Zunächst einmal ist es wichtig zu betonen, dass dieses Handelstool ein Nicht-Repaint-, Nicht-Redraw- und Nicht-Verzögerungsindikator ist, was es ideal für professionelles Trading macht. Online-Kurs, Benutzerhandbuch und Demo. Der Smart Price Action Concepts Indikator ist ein sehr leistungsstarkes Werkzeug sowohl für neue als auch erfahrene Händler. Er vereint mehr als 20 nützliche Indikatoren in einem und kombiniert fortgeschrittene Handelsideen wie die Analyse des Inner Circle Traders und Str
Dies ist wahrscheinlich der vollständigste Indikator für die automatische Erkennung der harmonischen Preisbildung, den Sie für die MetaTrader-Plattform finden können. Es erkennt 19 verschiedene Muster, nimmt Fibonacci-Projektionen genauso ernst wie Sie, zeigt die potenzielle Umkehrzone (PRZ) an und findet geeignete Stop-Loss- und Take-Profit-Werte. [ Installationsanleitung | Update-Anleitung | Fehlerbehebung | FAQ | Alle Produkte ] Es erkennt 19 verschiedene harmonische Preisbildungen Darges
Atomic Analyst MT5
Issam Kassas
4.32 (19)
Zunächst einmal ist es erwähnenswert, dass dieser Handelsindikator nicht neu malt, nicht neu zeichnet und keine Verzögerung aufweist, was ihn sowohl für manuellen als auch für Roboterhandel ideal macht. Benutzerhandbuch: Einstellungen, Eingaben und Strategie. Der Atom-Analyst ist ein PA-Preisaktionsindikator, der die Stärke und das Momentum des Preises nutzt, um einen besseren Vorteil auf dem Markt zu finden. Ausgestattet mit fortschrittlichen Filtern, die helfen, Rauschen und falsche Signale z
Black Dragon indicator mt5
Ramil Minniakhmetov
4.84 (61)
Der Trenderkennungsindikator ergänzt jede Strategie und kann auch als unabhängiges Werkzeug verwendet werden. Vorteile Einfach zu bedienen, überfrachtet das Diagramm nicht mit unnötigen Informationen; Kann als Filter für jede Strategie verwendet werden; Verfügt über eingebaute dynamische Unterstützungs- und Widerstandsebenen, die sowohl zur Gewinnmitnahme als auch zum Setzen von Stop-Loss verwendet werden können; Der Indikator ändert seine Farbe nicht, nachdem die Kerze geschlossen wurde;  F
ICT, SMC, SMART MONEY CONCEPTS, SMART MONEY, Smart Money Concept, Support and Resistance, Trend Analysis, Price Action, Market Structure, Order Blocks, BOS/CHoCH,   Breaker Blocks ,  Momentum Shift,   Supply&Demand Zone/Order Blocks , Strong Imbalance,   HH/LL/HL/LH,    Fair Value Gap, FVG,  Premium  &   Discount   Zones, Fibonacci Retracement, OTE, Buy Side Liquidity, Sell Side Liquidity, BSL/SSL Taken, Equal Highs & Lows, MTF Dashboard, Multiple Time Frame, BigBar, HTF OB, HTF Market Structure
IX Power MT5
Daniel Stein
4.86 (7)
IX Power: Markteinblicke für Indizes, Rohstoffe, Kryptowährungen und Forex Überblick IX Power ist ein vielseitiges Tool zur Analyse der Stärke von Indizes, Rohstoffen, Kryptowährungen und Forex-Symbolen. Während FX Power die höchste Präzision für Währungspaare bietet, indem es alle verfügbaren Paardaten einbezieht, konzentriert sich IX Power ausschließlich auf die Marktdaten des zugrunde liegenden Symbols. Dies macht IX Power zu einer hervorragenden Wahl für Nicht-Forex-Märkte und zu einem zuv
- Real price is 80$ - 50% Discount (It is 39$ now) Contact me for instruction, any questions! - Lifetime update free - Non-repaint - I just sell my products in Elif Kaya Profile, any other websites are stolen old versions, So no any new updates or support. Advantages of  M1 Scalper Pro  Profitability: M1 Scalper Pro is highly profitable with a strict exit strategy. Frequent Opportunities: M1 Scalper Pro  takes advantage of numerous small price changes. Minimal Market Risk: Limited exposure redu
Special offer : ALL TOOLS , just $35 each! New tools   will be   $30   for the   first week   or the   first 3 purchases !  Trading Tools Channel on MQL5 : Join my MQL5 channel to update the latest news from me Entfesseln Sie die Kraft des Inversion Fair Value Gap (IFVG) -Konzepts von ICT mit dem Inversion Fair Value Gaps Indicator ! Dieses hochmoderne Tool hebt Fair Value Gaps (FVGs) auf die nächste Ebene, indem es umgekehrte FVG-Zonen identifiziert und anzeigt – wichtige Unterstützungs- und W
MONEYTRON – ТВОЙ ЛИЧНЫЙ СИГНАЛ НА УСПЕХ! XAUUSD | AUDUSD | USDJPY | BTCUSD Поддержка таймфреймов: M5, M15, M30, H1 Почему трейдеры выбирают Moneytron? 82% успешных сделок — это не просто цифры, это результат продуманной логики, точного алгоритма и настоящей силы анализа. Автоматические сигналы на вход — не нужно гадать: когда покупать, когда продавать. 3 уровня Take Profit — ты сам выбираешь свой уровень прибыли: безопасный, уверенный или максимум. Четкий Stop Loss — контролируешь риск
Blahtech Supply Demand MT5
Blahtech Limited
4.54 (13)
Was: $299  Now: $149  Supply Demand uses previous price action to identify potential imbalances between buyers and sellers. The key is to identify the better odds zones, not just the untouched ones. Blahtech Supply Demand indicator delivers functionality previously unavailable on any trading platform. This 4-in-1 indicator not only highlights the higher probability zones using a multi-criteria strength engine, but also combines it with multi-timeframe trend analysis, previously confirmed swings
Zunächst einmal ist es wichtig zu betonen, dass dieses Handelssystem ein Nicht-Repainting-, Nicht-Redrawing- und Nicht-Verzögerungsindikator ist, was es sowohl für manuelles als auch für automatisches Trading ideal macht. Online-Kurs, Handbuch und Vorlagen herunterladen. Das "Smart Trend Trading System MT5" ist eine umfassende Handelslösung, die für neue und erfahrene Trader maßgeschneidert ist. Es kombiniert über 10 Premium-Indikatoren und bietet mehr als 7 robuste Handelsstrategien, was es zu
FX Dynamic: Volatilität und Trends mit anpassbarer ATR-Analyse im Blick Übersicht FX Dynamic ist ein leistungsstarkes Tool, das die Berechnungen des Average True Range (ATR) nutzt, um Tradern unübertroffene Einblicke in die tägliche und intraday-Volatilität zu geben. Durch das Festlegen klarer Volatilitätsschwellen — beispielsweise 80%, 100% und 130% — kannst du schnell potenzielle Gewinnchancen erkennen oder Warnungen erhalten, wenn der Markt seine üblichen Spannen überschreitet. FX Dynamic p
Weitere Produkte dieses Autors
Daily High Low Danilo Monteiro
Danilo Hudson Couto Monteiro
# Indicador Daily High - Danilo Monteiro - MT5 ## Descrição O Daily High/Low Labels é um indicador personalizado para MetaTrader 5 que exibe automaticamente as máximas e mínimas diárias no gráfico, facilitando a identificação rápida dos níveis importantes de preço. O indicador marca os preços com etiquetas e linhas horizontais, permitindo uma visualização clara dos níveis críticos do dia atual e anterior. ## Principais Características ### 1. Marcação Automática - Exibe automaticamente as máxi
FREE
MACD Linhas Danilo Monteiro
Danilo Hudson Couto Monteiro
5 (2)
MACD Lines - Indicador MACD com Visualização em Linhas Descrição Este é um indicador MACD (Moving Average Convergence Divergence) modificado que apresenta uma visualização mais limpa e elegante em comparação com o MACD padrão do MT5. A principal diferença é que ele remove o histograma tradicional e mantém apenas as linhas MACD e Signal, permitindo uma melhor visualização dos cruzamentos e tendências. Características Principais Linha MACD em azul escuro com espessura 2 Linha Signal em vermelho co
FREE
Auswahl:
Keine Bewertungen
Antwort auf eine Rezension