• Übersicht
  • Bewertungen
  • Diskussion
  • Neue Funktionen

Reversal Up Down Arrows

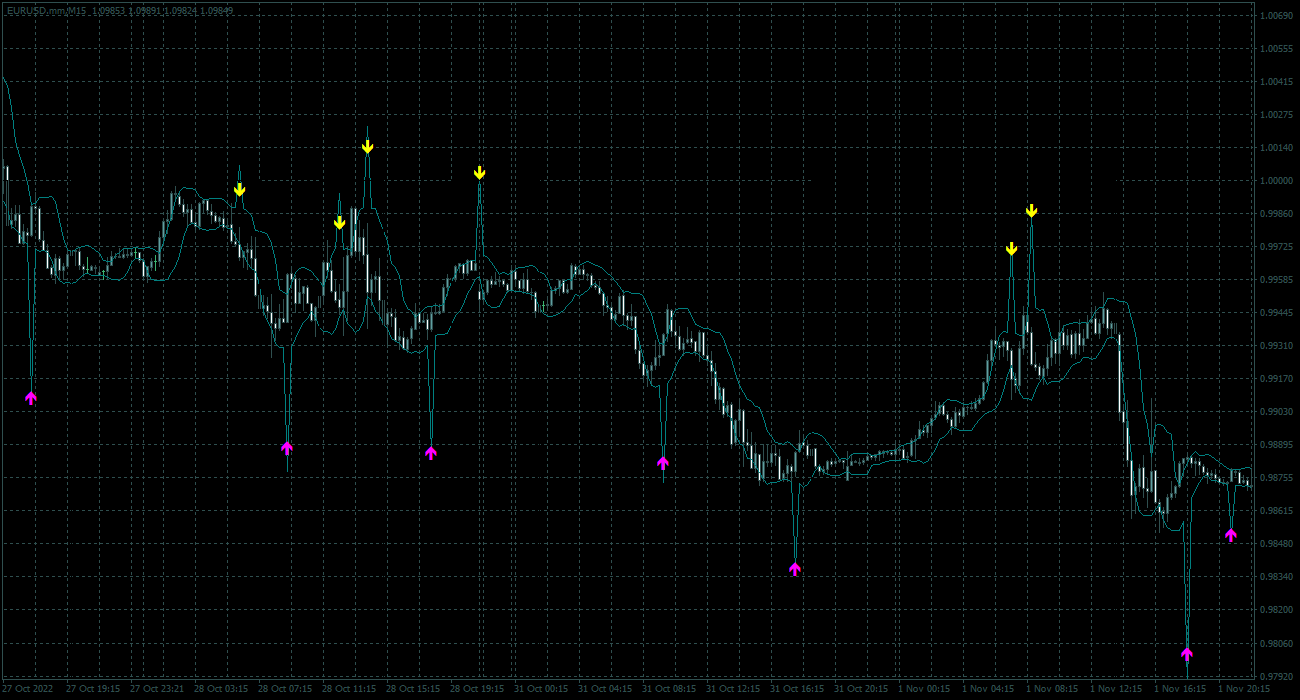
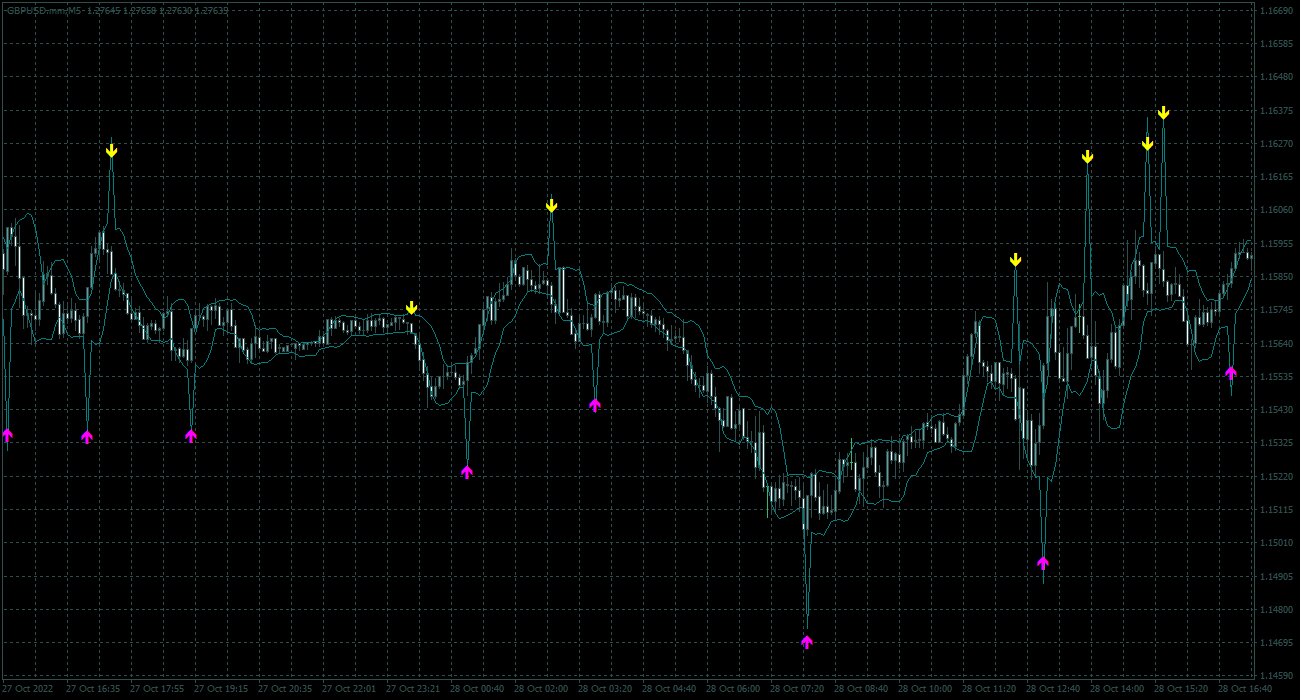
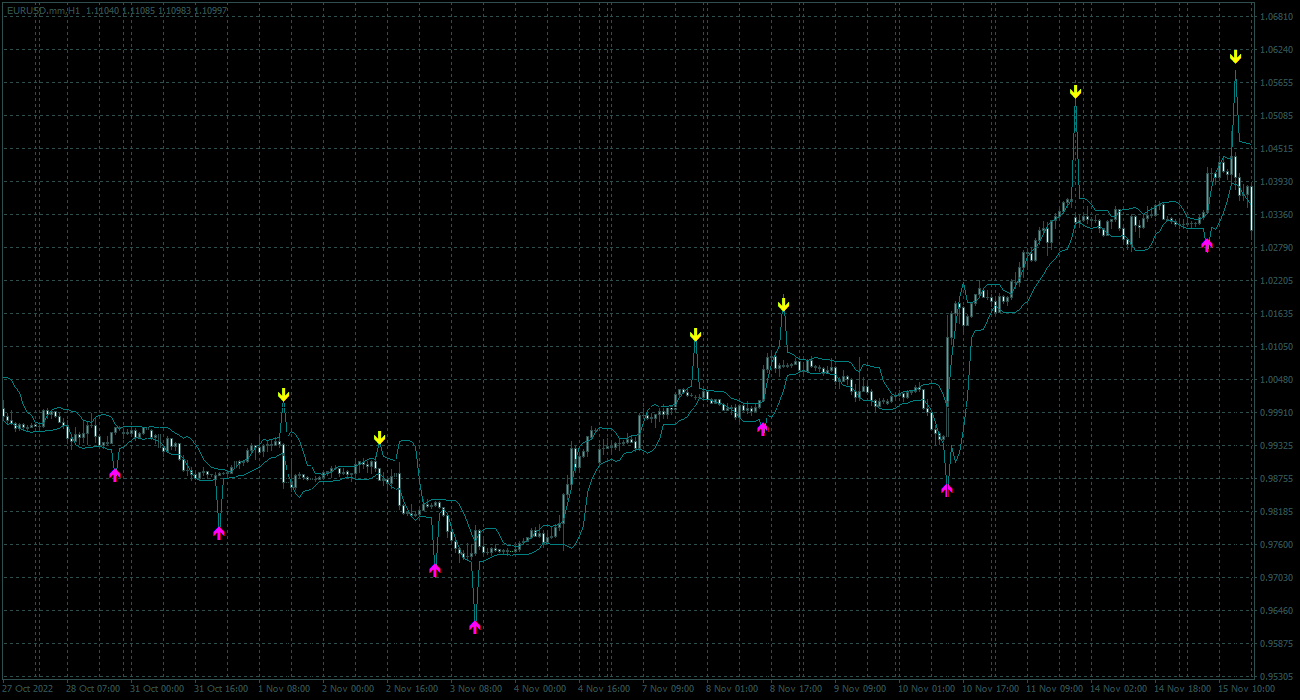
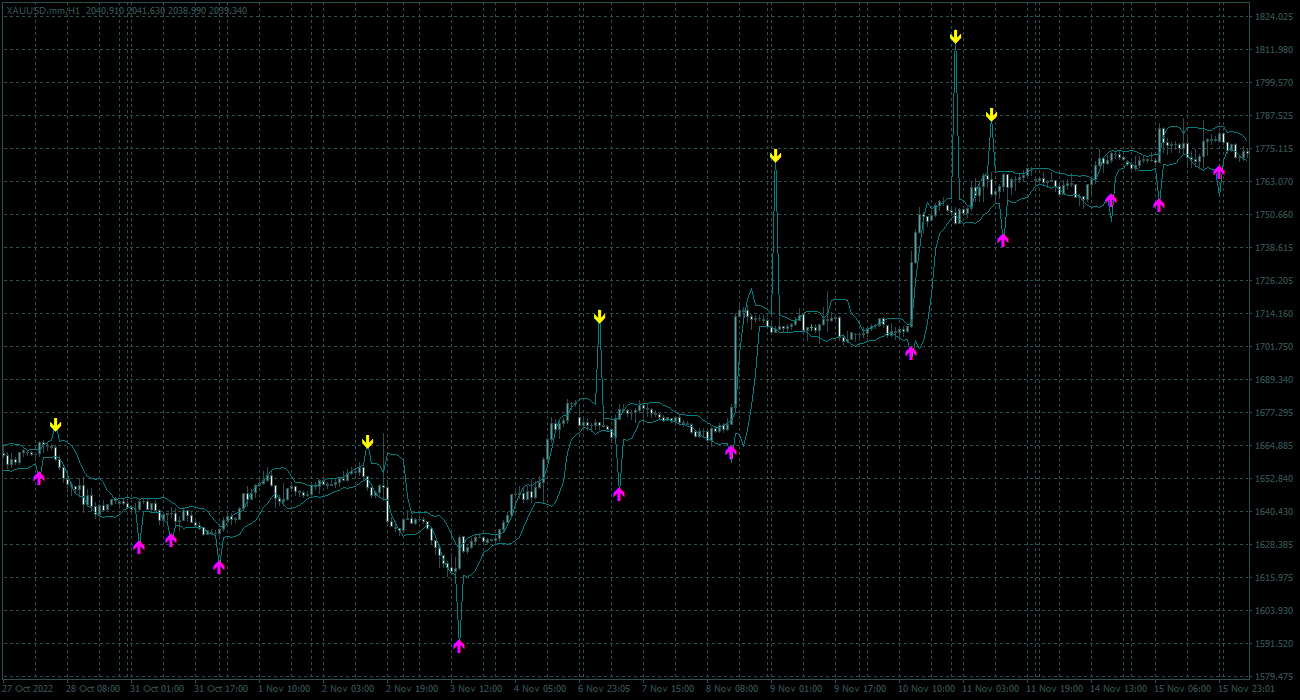
Eine Reihe von Indikatoren, die Wendepunkte erkennen. Erkennt Höchst- und Tiefststände von Candlestick-Kombinationen, nachdem sie von zwei MAs abgezogen wurden. Gilt für Handelssysteme bei Verwendung von Early Entrys. Kann entlang des Trends für Scalping und Intraday-Handel sowie zur frühzeitigen Erkennung von Trendumkehrungen verwendet werden.


Möglichkeiten
  1. Die Parameter bieten flexible Einstellungen für beliebige Zeitrahmen und Handelsinstrumente.
  2. Es gibt verschiedene Arten von Alarmen für Signale.
  3. Gelber Pfeil – Sell signal , Rosa Pfeil – Buy signal .
  4. Die optimierte Berechnung des Indikators ermöglicht es Ihnen, ihn auf mehreren Charts zu öffnen, ohne den Prozessor zu beanspruchen.
  5. Der Indikator wird nie neu gezeichnet, alle Signale erfolgen nur, wenn die Kerze schließt.

Eingabeparameter

  • First Line – Erste MA-Periode zur Berechnung der Signale
  • Second Line – Die Periode des zweiten MA zur Berechnung der Signale (es wird empfohlen, sie 2-4 Mal länger als die Periode des ersten MA einzustellen)
  • Show line MA - Zeigt die Berechnungszeile an
  • Play Sound / Display Pop -up Message / Send Push Notification / Send Email – Verwenden von Benachrichtigungen, wenn Signalpfeile und Stopps angezeigt werden.
  • Sound for Signals - Sounddatei für Signale.
Empfohlene Produkte
Implement
Vitalii Zakharuk
5 (1)
Implement analyzes market dynamics for pivot points. If you want to learn how to spot the correct reversals for consistently likely profitable trading, buy this indicator. Shows favorable moments of entering the market in stripes. Ready-made trading system. The principle of operation of the indicator is to automatically determine the current state of the market when placed on a chart, analyze historical data based on historical data and display instructions for further actions on the trader's
Bei diesem Indikator handelt es sich um einen Indikator für die automatische Wellenanalyse, der sich perfekt für den praktischen Handel eignet! Fall... Hinweis:   Ich bin es nicht gewohnt, westliche Namen für die Welleneinstufung zu verwenden. Aufgrund des Einflusses der Namenskonvention von Tang Lun (Tang Zhong Shuo Zen) habe ich die Grundwelle als   Stift   und das sekundäre Wellenband als   Segment   bezeichnet Gleichzeitig hat das Segment die   Trendrichtung   benannt (diese Benennungsmeth
No Repaint Bext ist ein vollständiges Handelssystem. Es zeigt an, wann eine Position geöffnet oder geschlossen werden soll und in welche Richtung gehandelt werden muss. Jedes Mal, wenn ein grüner Pfeil erscheint, sollte eine Kaufposition eröffnet werden. Alle Kaufpositionen werden geschlossen, sobald ein roter Pfeil erscheint. Umgekehrt wird bei einem roten Pfeil eine Verkaufsposition eröffnet, die geschlossen wird, sobald ein grüner Pfeil erscheint. Der Handel erfolgt auf dem M5-Zeitrahmen und
Drawing Pack
John Louis Fernando Diamante
4 (1)
This indicator provides several drawing tools to assist in various methods of chart analysis. The drawings will keep their proportions (according to their handle trendline) across different chart scales, update in real time, and multiple drawings are supported. # Drawing Option Description  1 Grid box draggable boxed grid, user defines rows x colums, diagonal ray option  2 Grid partial or fullscreen grid, sized by handle line  3 Grid flex a diagonal grid, sized and sloped by handle line  4 Cyc
A useful scanner/dashboard that shows the RSI values for multiple symbols and time-frames. It can be easily hidden/displayed with a simple click on the scanner man top left of the dashboard. You can input upper and lower RSI values and the colours can be set to show when above/below these values. The default values are 70 and 30. There are also input colours for when the RSI is above or below 50 (but not exceeding the upper/lower levels Symbols and time-frames are input separated by commas.
Note : The slow loading of the indicator issue has been addressed . This new version loads fast and does not slow the platform. Version 1.3 : We have updated the indicator to include an historical bar scanning option . So instead of scanning all bars in the history (which can make the indicator slow sometimes ) , you can select the maximum number of bars it can scan which can increase the performance and make the indicator faster. This indicator scans the 1-3 Trendline pattern . The indicato
Valentines
Victor Golovkov
Valentines trend is an easy-to-use indicator that hides a powerful calculation math-system "under the hood". Attach the indicator to the chart and set the parameters. Period - period for tracking changes in quotes Amount of Bars - number of last bars to track You do not need to select any numerical parameters. The indicator will do everything for you automatically . Each signal is generated on the current bar, and in order not to miss it, use the built-in alerts and notifications system . The in
To access the TD sequential Scanner for MT5, please check https://www.mql5.com/en/market/product/123369?source=Site +Market+My+Products+Page. One of the MT5 versions includes additional timeframes such as M1, M2, M3,H2,H6,H8 and so on.( https://www.mql5.com/en/market/product/123367?source=Site +Market+My+Products+Page) TD Sequential Scanner: An Overview The TD Sequential scanner is a powerful technical analysis tool designed to identify potential price exhaustion points and trend reversals in fi
TMoney OrderblockDay
Moises Orlando Urbina Sojo
The indicator is triggered at the start of each trading day and detects both bullish and bearish ORDERBLOCK potentials. These levels are of high operational probability, being able to use a minimum ratio of 3 to 1 to maximize profits. It is recommended to use TimeFrame M5 to M30 for a proper display and consider pending orders at the OB levels of the chart and place the SL up to a maximum of 20 pips from the entry price. Submit the indicator to Backtesting to become familiar with its performan
The indicator sends messages to e-mail and mobile terminal when the price approaches the horizontal levels and trend lines that are drawn using the handy panel! The levels and trend lines are deleted and placed to the chart using one click on the panel, and they can be dragged on the chart by mouse! It is possible to set the interval between messages in the settings, the interval is applied to each object separately! Indicator Settings ===*** Main settings ***=== - below is the list of the main
Smart trends view
Maria Cristina Sabatini
Clear trend filter   This is a filter-trend indicator.  From the settings you can select to use more filter or less. The very interesting part of the indicator comes out using with all the filter. In this way you can follow the trend easily even when the market is without a strong trend, but is instead more flat. I personally use it on 1 minutue timeframe with  MORE FILTER (you can select it from the input setting) in order to have an overlook of trend in the market.   Added: - Sound Notificatio
NIGHTCrusher Lite FREE
Christian Opperskalski
4.5 (2)
NIGHTCRUSHER is a fully automated expert advisor, designed for scalping on quite market situation. The Lite - Version is limited to minimal Lot per Pair and dont has lot mulitplier and dynamic function you can also run different strategies like swing trading or grid different Trade Entry Signals different Exit Strategies included (MA Cut / Signal Change / Trailing TP) clever Risk & Money management - Balance based - Longrun trades tracking You can also use a Grid function or Lot multipier, if ne
FREE
This product works by detecting trend opportunities. So as shown in the screenshot when The indicator shows an upward arrow it shows the market is on an uptrend and when the indicator Shows a downward arrow it shows the market is on a downward direction. What makes this indicator Special is that it has additional signals just below the arrow signals. It is up to the trader to be  Creative and combine these signals with the arrow signal to get accurate forecasts.
Fibonacci colores
Carlos Augusto Cedeno Rocha
Fibonacci por color en niveles para aplicar estrategia profesional inicialmente se coloca en el punto mas alto del dia y mas bajo con esto es para ubicar operaciones a una distancia exacta con lo cual se busca generar ganancias residuales internas en el mismo dia con esto las lineas fusias es para colocar las entrdas sell y las lineas verdes amarillas van los buy
ROC acceleration-deceleration is the manual system for medium-term scalping. Indicator based on custom ROC system which defines bullish/bearish market and especially  acceleration-deceleration of tendention in the market's main direction. Buy arrow is plotted during bearish market when current trend decelerates and sell  arrow is plotted during bullish market when current trend decelerates. Main Indicator's Features Signals are not repaint,non-late or disappear(exept cases when system recalculat
XOATRHIST
Ainur Sharipov
4.83 (6)
This is one of my first indicators. Slightly improved. The indicator is based on point and figure chart, but their period is equal to ATR indicator values. Parameters: ATRPeriod - ATR period for calculation of steps. XOPips - manual pararmetr, ATR ignoring. Note: The indicator uses closes price, thus it is recommended to consider completed bars. There is a more visual, with the display of lines on the chart and alerts, paid version of XOatrline
FREE
Rira VWAP Bands
Vitor Palmeira Abbehusen
VWAP Bands gives you the regular Volume-Weighted Average Price and also the deviation bands. Use this indicator to see the possible amount of market movement, find support and resistance lines, find good spots for entry and exit,  and the most important feature is to find possible pivot points. This indicator has been mathematically improved by Rira team. The calculation begins at the start of each trading day
This indicator is meant for Harmonic Traders, it helps them in identifying the formed patterns by analyzing the market past data, looking for Harmonic Patterns. The Patterns that this indicator can detect are: AB=CD Butterfly Gartely Crab Bat The indicator shows the following: The completed pattern, with the critical zone highlighted in Gray box The suggested 3 take profit levels (in green) The Suggested Stop Loss level (in Red) The formed pattern ratios can be checked by hovering the mouse on t
Dieser Expert Advisor führt keinen Handel durch, sondern scannt die gesamten Symbole in Ihrer Marktüberwachung und scannt jede Aktie einzeln in verschiedenen Zeitrahmen und zeigt Ihnen am Ende, welches Symbol in welchem Zeitrahmen eine starke Engulfing-Kerze hat. Darüber hinaus können Sie einen MA-Zeitraum und ein oberes und unteres RSI-Limit definieren und es zeigt Ihnen, welche Symbole in welchem Zeitrahmen den angepassten gleitenden Durchschnitt kreuzen werden und welches Symbol in welchem
FREE
Super trend is one of the best trend indicators in metatrader 4 (MT4). Triple SuperTrend indicator is an indicator that consist of three super trend indicator that can be aranged. This indicator is built by mql4 language and doesn't provided by MT4 platform. Highly recommended using EMA SuperTrend Strategy Indicator if you want to get better result in here: https://www.mql5.com/en/market/product/91664 This indicator is easy to use, power full and has many benefits, there are: Using three indic
FREE
Market Profile
Artem Titarenko
5 (1)
The "Market Profile" indicator displays the profiles and volumes of periods – weekly, daily, session (8-hour), 4-hour, hour, summary. The VAH/VAL price area is automatically highlighted by a dotted line for each profile (except for the summary). The indicator includes chroma Delta, which colors the profile areas. The areas of prevailing Buys is colored in green, that of Sells - in red. The intensity histogram features blue/red respectively. In the filter mode, the indicator displays the volume a
Dynamic SR Trend Channel Dynamic SR Trend Channel is a simple indicator for trend detection as well as resistance/support levels on the current timeframe. It shows you areas where to expect possible change in trend direction and trend continuation. It works with any trading system (both price action and other trading system that use indicators) and is also very good for renko charting system as well. In an uptrend, the red line (main line) serves as the support and the blue line serves as the r
REMINDER: Early buyers hot price discount: Price subject to rise after first 20 copies. Starting price $65 and final price will be $1275. Secure your discounted copy Now! Smart Money Analyser Indicator User Manual 1. Introduction Welcome to the   Smart Money Analyser Indicator This powerful tool provides traders with comprehensive market analysis by combining various technical indicators to generate actionable trading signals. Designed to be user-friendly, this indicator helps traders of all
Fluctuation Bands
Francisco De A Vilar Enriquez
Shows the price fluctuation bands associated with a moving average. It is extremely accurate, and it's a wonderful visual guide. The indicator consists of 4 bands . The two bands closest to the price form the fluctuation channel , they mark the maximum calculated deviation of the price from the moving average. The outer bands mark the maximum overdeviation of the price with respect to the fluctuation channel, they are overbought or oversold areas. Features.  -The change of periods of the MA is d
The indicator shows the Buy/Sell direction. The calculations use the opening prices and their rate of change for the billing period - "Calculation period" MTF indicator - "Calculation timeframe", no repaint - NRP. Two display types: "Chart default" или "Chart color" For "Chart color" color customization available : "Bar color" Two types stop levels: "Simple stop level" or "Dynamic stop level " Color settings: "Stop level color" Alerts available: "Chart message", "Push message", "Email message" F
Crypto_Forex-Indikator HTF OsMA Oszillator für MT4. - HTF OsMA ist einer der besten Trendindikatoren auf dem Markt. HTF steht für „Higher Time Frame“. - Dieser Indikator eignet sich hervorragend für Multi-Time-Frame-Handelssysteme mit Price-Action-Einträgen oder in Kombination mit anderen Indikatoren. - Mit dem HTF OsMA-Indikator können Sie OsMA aus einem höheren Zeitrahmen an Ihr aktuelles Diagramm anhängen --> dies ist ein professioneller Handelsansatz. // Weitere großartige Expert Advisors
Adaptive SSA
Jean Francois Le Bas
SSA stands for ' Singular Spectrum Analysis '. It combines elements of classical time series decomposition, statistics, multivariate geometry, dynamical systems and signal processing. SSA decomposes time series into a sum of components (ETs), with each component representing a lower smoothing, using several SVD ( Singular Value Decompositions ). It is a powerful filtering process used in many fields of research (climatology, biomedical, aerospace, etc), where high quality forecasting and smoot
Color Trend FX
Alexey Minkov
4 (4)
!SPECIAL SALE!  The indicator shows on the chart the accurate market entry points, accurate exit points, maximum possible profit of a deal (for those who take profit according to their own system for exiting deals), points for trailing the open positions, as well as detailed statistics. Statistics allows to choose the most profitable trading instruments, and also to determine the potential profits. The indicator does not redraw its signals! The indicator is simple to set up and manage, and is su
Alert Up Down MT4
William Oswaldo Mayorga Urduy
ALARM UP - DOWN FÜR METATRADER 5 Dieser Indikator generiert eine Warnung, wenn der Preis die Zone zwischen den UP- und DOWN-Linien verlässt. Sie können verschiedene Arten von Warnungen generieren, wie z. > Ton > Nachrichtenbox > Nachricht in der Expertenbox > Mail (zuvor konfiguriert) > PUSH-Benachrichtigungen (zuvor konfiguriert) Die Linien müssen über die Indikatoreigenschaften und nicht über die Linieneigenschaften konfiguriert werden, da dies die Finonacci beeinflussen kann, wenn
Breakout Box
Claus Dietrich
4.45 (22)
BREAKOUT-SESSION-BOX LONDON EU US ASIA Open watch the expectation of a volatile movement above or under the opening range We take the high of the range as Entry for a long trade and SL will be the low of the range and vice versa the low of the range as Entry for a short trade and the high for SL The size of the range is the distance to the TP (Take Profit) The range of the opening hours should not be larger than about 1/3 of the average daily range 4 breakout examples are already predefined: A
FREE
Käufer dieses Produkts erwarben auch
Gann Made Easy
Oleg Rodin
4.8 (116)
Gann Made Easy ist ein professionelles und einfach zu bedienendes Forex-Handelssystem, das auf den besten Handelsprinzipien unter Verwendung der Theorie von Mr. basiert. W.D. Gann. Der Indikator liefert genaue KAUF- und VERKAUFSsignale, einschließlich Stop-Loss- und Take-Profit-Levels. Mit PUSH-Benachrichtigungen können Sie auch unterwegs handeln. Bitte kontaktieren Sie mich nach dem Kauf! Ich werde meine Handelstipps und tolle Bonusindikatoren kostenlos mit Ihnen teilen! Wahrscheinlich haben Si
Enigmera
Ivan Stefanov
5 (7)
ENIGMERA: Der Kern des Marktes Wichtig: Die MQL5.com-Demo wird im Strategy Tester ausgeführt und spiegelt möglicherweise nicht vollständig die Funktionalität von Enigmera wider. Überprüfen Sie die Beschreibung, Screenshots und das Video für Details. Zögern Sie nicht, mir bei Fragen eine Nachricht zu senden! Der Code des Indikators wurde vollständig neu geschrieben. Version 3.0 fügt neue Funktionen hinzu und behebt Fehler, die seit der Einführung des Indikators aufgetreten sind. Einführung Dies
Scalper Inside PRO
Alexey Minkov
4.76 (63)
!SPECIAL SALE! An exclusive indicator that utilizes an innovative algorithm to swiftly and accurately determine the market trend. The indicator automatically calculates opening, closing, and profit levels, providing detailed trading statistics. With these features, you can choose the most appropriate trading instrument for the current market conditions. Additionally, you can easily integrate your own arrow indicators into Scalper Inside Pro to quickly evaluate their statistics and profitability
Dynamic Forex28 Navigator
Bernhard Schweigert
5 (5)
Dynamic Forex28 Navigator – Das Forex-Handelstool der nächsten Generation AKTUELL 49 % RABATT. Dynamic Forex28 Navigator ist die Weiterentwicklung unserer seit langem beliebten Indikatoren und vereint die Leistung von drei in einem: Advanced Currency Strength28 Indicator (695 Bewertungen) + Advanced Currency IMPULSE mit ALERT (520 Bewertungen) + CS28 Combo Signals (Bonus) Details zum Indikator https://www.mql5.com/en/blogs/post/758844 Was bietet der Strength Indicator der nächsten Generation?
Ich präsentiere Ihnen den hervorragenden technischen Indikator Grabber, der als eine vollständig einsatzbereite „All-Inclusive“-Handelsstrategie funktioniert. In einem einzigen Code sind leistungsstarke Werkzeuge zur technischen Marktanalyse, Handelssignale (Pfeile), Alarmfunktionen und Push-Benachrichtigungen integriert. Jeder Käufer dieses Indikators erhält zusätzlich kostenlos: Grabber Utility: ein Tool zur automatischen Verwaltung offener Orders Schritt-für-Schritt-Videoanleitung: wie man de
FX Volume
Daniel Stein
4.59 (34)
FX Volume: Erleben Sie den echten Marktüberblick aus der Sicht eines Brokers Kurzüberblick Möchten Sie Ihre Handelsstrategie auf das nächste Level bringen? FX Volume liefert Ihnen Echtzeit-Einblicke in die Positionierung von Retail-Tradern und Brokern — lange bevor verzögerte Berichte wie der COT verfügbar sind. Ob Sie nach beständigen Gewinnen streben oder einfach einen tieferen Vorteil am Markt suchen, FX Volume hilft Ihnen, große Ungleichgewichte zu erkennen, Breakouts zu bestätigen und Ihr
Scalper Vault
Oleg Rodin
5 (29)
Scalper Vault ist ein professionelles Scalping-System, das Ihnen alles bietet, was Sie für erfolgreiches Scalping benötigen. Dieser Indikator ist ein komplettes Handelssystem, das von Forex- und Binäroptionshändlern verwendet werden kann. Der empfohlene Zeitrahmen ist M5. Das System liefert Ihnen genaue Pfeilsignale in Richtung des Trends. Es liefert Ihnen auch Top- und Bottom-Signale und Gann-Marktniveaus. Die Indikatoren bieten alle Arten von Warnungen, einschließlich PUSH-Benachrichtigungen.
FX Power MT4 NG
Daniel Stein
4.94 (18)
FX Power: Analysieren Sie die Stärke von Währungen für intelligentere Handelsentscheidungen Übersicht FX Power ist Ihr unverzichtbares Werkzeug, um die tatsächliche Stärke von Währungen und Gold unter allen Marktbedingungen zu verstehen. Indem Sie starke Währungen kaufen und schwache verkaufen, vereinfacht FX Power Ihre Handelsentscheidungen und deckt Chancen mit hoher Wahrscheinlichkeit auf. Ob Sie Trends folgen oder extreme Delta-Werte nutzen, um Umkehrungen zu prognostizieren, dieses Tool p
Golden Trend Indicator
Noha Mohamed Fathy Younes Badr
4.9 (10)
Golden Trend indicator  is The best indicator for predicting trend movement this indicator never lags and never repaints and never back paints    and give  arrow buy and sell    before the candle appear  and it will help you and  will make your trading decisions clearer its work on all currencies and  gold and crypto and all time frame This unique  indicator uses very secret algorithms to catch the  trends, so you can trade using this indicator and see the trend clear on charts  manual guide and
- Lifetime update free Contact me for instruction, add group and any questions! Related Products:  Bitcoin Expert , Gold Expert - Non-repaint - I just sell my products in Elif Kaya profile, any other websites are stolen old versions, So no any new updates or support. Introduction The breakout and retest strategy is traded support and resistance levels. it involves price breaking through a previous level.  The break and retest strategy is designed to help traders do two main things, the first is
Easy Breakout
Mohamed Hassan
5 (10)
After your purchase, feel free to contact me for more details on how to receive a bonus indicator called VFI, which pairs perfectly with Easy Breakout for enhanced confluence!   Easy Breakout is a powerful price action trading system built on one of the most popular and widely trusted strategies among traders: the Breakout strategy ! This indicator delivers crystal-clear Buy and Sell signals based on breakouts from key support and resistance zones. Unlike typical breakout indicators, it levera
Algo Pumping MT4
Ihor Otkydach
5 (2)
PUMPING STATION – Ihre persönliche „All-inclusive“-Strategie Wir präsentieren Ihnen PUMPING STATION – einen revolutionären Forex-Indikator, der Ihr Trading in eine spannende und effektive Erfahrung verwandeln wird. Es handelt sich nicht nur um ein Hilfsmittel, sondern um ein vollwertiges Handelssystem mit leistungsstarken Algorithmen, die Ihnen helfen, stabiler zu traden. Beim Kauf dieses Produkts erhalten Sie KOSTENLOS: Exklusive Set-Dateien: Für automatische Einrichtung und maximale Leistung.
TPSproTREND PrO
Roman Podpora
4.68 (25)
VERSION MT5        —        ИНСТРУКЦИЯ RUS           —        INSTRUCTIONS  ENG Hauptfunktionen: Präzise Eingangssignale OHNE RENDERING! Wenn ein Signal erscheint, bleibt es relevant! Dies ist ein wichtiger Unterschied zu Redraw-Indikatoren, die ein Signal liefern und es dann ändern können, was zu einem Verlust des eingezahlten Geldes führen kann. Jetzt können Sie mit größerer Wahrscheinlichkeit und Genauigkeit in den Markt eintreten. Es gibt auch eine Funktion zum Einfärben der Kerzen nach de
Lux Trend
Mohamed Hassan
5 (3)
After purchase, please contact me to get your trading tips + more information for a great bonus!   Lux Trend is a professional strategy based on using Higher Highs and Lower Highs to identify and draw Trendline Breakouts! Lux Trend  utilizes two Moving Averages to confirm the overall trend direction before scanning the market for high-quality breakout opportunities, ensuring more accurate and reliable trade signals. This is a proven trading system used by real traders worldwide, demonstrating
Gold Venamax MT4
Sergei Linskii
5 (1)
Gold Venamax   – das ist der beste technische Indikator für Aktien. Der Indikatoralgorithmus analysiert die Preisbewegung eines Vermögenswerts und spiegelt die Volatilität und potenzielle Einstiegszonen wider. Indikatorfunktionen: Dies ist ein Super-Indikator mit Magic und zwei Blöcken von Trendpfeilen für komfortables und profitables Trading. Auf dem Diagramm wird eine rote Schaltfläche zum Wechseln von Blöcken angezeigt. Magic ist in den Indikatoreinstellungen eingestellt, sodass Sie den Indi
Derzeit 20% Rabatt! Die beste Lösung für jeden Neueinsteiger oder Expert Händler! Dieses Dashboard arbeitet mit 28 Währungspaaren. Es basiert auf 2 unserer Hauptindikatoren (Advanced Currency Strength 28 und Advanced Currency Impulse). Es bietet einen hervorragenden Überblick über den gesamten Forex-Markt. Es zeigt die Werte der Advanced Currency Strength, die Veränderungsrate der Währungen und die Signale für 28 Devisenpaare in allen (9) Zeitrahmen. Stellen Sie sich vor, wie sich Ihr Handel
TPSpro RFI Levels
Roman Podpora
4.85 (27)
ANWEISUNGEN    Russland -    ENG    Die Empfehlung basiert auf dem Indikator -   TPSpro   TREND PRO -   Version MT5 Die wichtigsten Elemente in der Branche sind entweder in Zonen oder in der Fabrik enthalten, oder sie führen zu einer Lösung bei einem Kauf oder dem Verkauf eines anderen Instruments. Wenn viele Menschen ihre Rechte nicht auf dem Händlerkonto verschlüsseln, werden die Folgen nicht schnell genug sein. Ich habe es damit abgeschlossen, dass ich diese Folgen nun noch interpretieren un
Currency Strength Wizard ist ein sehr leistungsstarker Indikator, der Ihnen eine Komplettlösung für erfolgreichen Handel bietet. Der Indikator berechnet die Stärke dieses oder jenes Forex-Paares anhand der Daten aller Währungen in mehreren Zeitrahmen. Diese Daten werden in Form von benutzerfreundlichen Währungsindizes und Währungsstärkelinien dargestellt, anhand derer Sie die Stärke dieser oder jener Währung erkennen können. Sie müssen lediglich den Indikator an das Diagramm anhängen, mit dem Si
Volatility Trend System – ein Handelssystem, das Signale für Einstiege gibt. Das Volatilitätssystem liefert lineare und punktuelle Signale in Richtung des Trends sowie Signale zum Verlassen des Trends, ohne Neuzeichnung und Verzögerungen. Der Trendindikator überwacht die Richtung des mittelfristigen Trends, zeigt die Richtung und deren Änderung an. Der Signalindikator basiert auf Änderungen der Volatilität und zeigt Markteintritte an. Der Indikator ist mit mehreren Arten von Warnungen ausgestat
DERZEIT 26% RABATT Die beste Lösung für jeden Newbie oder Expert Trader! Dieser Indikator ist ein einzigartiges, qualitativ hochwertiges und erschwingliches Trading-Tool, da wir eine Reihe von proprietären Funktionen und eine neue Formel integriert haben. Mit nur EINEM Chart können Sie die Währungsstärke für 28 Forex-Paare ablesen! Stellen Sie sich vor, wie sich Ihr Handel verbessern wird, weil Sie in der Lage sind, den genauen Auslösungspunkt eines neuen Trends oder einer Scalping-Gelegenhei
Introduction to X3 Chart Pattern Scanner X3 Cherart Pattern Scanner is the non-repainting and non-lagging indicator detecting X3 chart patterns including Harmonic pattern, Elliott Wave pattern, X3 patterns, and Japanese Candlestick patterns. Historical patterns match with signal patterns. Hence, you can readily develop the solid trading strategy in your chart. More importantly, this superb pattern scanner can detect the optimal pattern of its kind. In addition, you can switch on and off individu
KT Renko Patterns MT4
KEENBASE SOFTWARE SOLUTIONS
2.33 (3)
KT Renko Patterns analysiert das Renko-Diagramm Stein für Stein, um bekannte Chartmuster zu finden, die häufig von Händlern an verschiedenen Finanzmärkten verwendet werden. Im Vergleich zu zeitbasierten Charts ist das Handeln mit Mustern auf Renko-Charts einfacher und deutlicher, da sie weniger überladen wirken. KT Renko Patterns enthält mehrere Renko-Muster, von denen viele ausführlich im Buch "Profitable Trading with Renko Charts" von Prashant Shah erklärt werden. Ein vollständig automatisie
DERZEIT 31% RABATT! Die beste Lösung für jeden Newbie oder Expert Trader! Dieser Indikator ist ein einzigartiges, qualitativ hochwertiges und erschwingliches Handelsinstrument, da wir eine Reihe von proprietären Funktionen und eine geheime Formel eingebaut haben. Mit nur EINEM Chart liefert er Alerts für alle 28 Währungspaare. Stellen Sie sich vor, wie sich Ihr Handel verbessern wird, weil Sie in der Lage sind, den genauen Auslösepunkt eines neuen Trends oder einer Scalping-Gelegenheit zu erk
Daily Candle Predictor ist ein Indikator, der den Schlusskurs einer Kerze vorhersagt. Der Indikator ist in erster Linie für die Verwendung in D1-Charts gedacht. Dieser Indikator eignet sich sowohl für den traditionellen Devisenhandel als auch für den Handel mit binären Optionen. Der Indikator kann als eigenständiges Handelssystem oder als Ergänzung zu Ihrem bestehenden Handelssystem verwendet werden. Dieser Indikator analysiert die aktuelle Kerze und berechnet bestimmte Stärkefaktoren innerhalb
FX Levels MT4
Daniel Stein
5 (2)
FX Levels: Außerordentlich präzise Unterstützungs- und Widerstandszonen für alle Märkte Kurzüberblick Suchen Sie eine verlässliche Methode, um Support- und Resistance-Level in jedem Markt zu identifizieren—egal ob Währungspaare, Indizes, Aktien oder Rohstoffe? FX Levels vereint die traditionelle „Lighthouse“-Methode mit einem modernen dynamischen Ansatz und bietet nahezu universelle Genauigkeit. Durch unsere Erfahrung mit echten Brokern sowie automatischen täglichen und Echtzeit-Updates hilft
Trend-Oszillator: Sanfte und Zuverlässige Marktrendenerkennung Der Trend-Oszillator ist ein fortschrittlicher Indikator für MT4, der Tradern dabei hilft, die Trendrichtung und potenzielle Umkehrpunkte präzise zu identifizieren. Mit einer intuitiven visuellen Darstellung zeigt dieser Indikator deutlich an, ob der Markt in einem Aufwärts- oder Abwärtstrend ist, vereinfacht die Analyse und verbessert die Lesbarkeit des Charts. Er ist für eine Vielzahl von Märkten und Zeitrahmen geeignet und bietet
Linear Trend Predictor – Ein Trendindikator, der Einstiegspunkte und Richtungsunterstützungslinien kombiniert. Funktioniert nach dem Prinzip des Durchbrechens des Hoch-/Tiefpreiskanals. Der Indikatoralgorithmus filtert Marktrauschen und berücksichtigt Volatilität und Marktdynamik. Indikatorfunktionen  Mithilfe von Glättungsmethoden zeigt es den Markttrend und Einstiegspunkte zum Öffnen von Kauf- oder Verkaufsaufträgen an.  Geeignet zum Bestimmen kurzfristiger und langfristiger Marktbewegungen
Best Currency Strength Indicator
Tumelo Patrick Rakotsoane
4.5 (46)
Advanced Currency Strength Indicator The Advanced Divergence Currency Strength Indicator. Not only it breaks down all 28 forex currency pairs and calculates the strength of individual currencies across all timeframes , but, You'll be analyzing the WHOLE forex market in 1 window (In just 1 minute) . This indicator is very powerful because it reveals the true movements of the market.  It is highly recommended to  analyze charts knowing the performance of individual currencies or the countries eco
Probieren Sie "Chart Patterns All in One" im Demo-Modus aus und erhalten Sie einen Bonus. Senden Sie mir eine Nachricht, nachdem Sie es im Demo-Modus getestet haben, um Ihren Bonus zu erhalten. Hinterlassen Sie nach dem Kauf einen Kommentar, um 8 hochwertige Indikatoren als Bonus zu erhalten. Der Chart Patterns All-in-One Indikator hilft Tradern, verschiedene Chartmuster, die häufig in der technischen Analyse verwendet werden, zu visualisieren. Dieser Indikator unterstützt die Identifizierung m
Top Bottom Tracker ist ein auf hochentwickelten Algorithmen basierender Indikator, der den Markttrend analysiert und die Hochs und Tiefs des Trends erkennen kann / MT5 Version . Der Preis wird schrittweise steigen, bis er 500$ erreicht. Nächster Preis --> $99 Eigenschaften Kein Repainting Dieser Indikator ändert seine Werte nicht, wenn neue Daten eintreffen Handelspaare Alle Forex-Paare Zeitrahmen Alle Zeitrahmen Parameter ==== Indikator-Konfiguration ==== Konfigurationsparameter //
Weitere Produkte dieses Autors
Volatility Trend System – ein Handelssystem, das Signale für Einstiege gibt. Das Volatilitätssystem liefert lineare und punktuelle Signale in Richtung des Trends sowie Signale zum Verlassen des Trends, ohne Neuzeichnung und Verzögerungen. Der Trendindikator überwacht die Richtung des mittelfristigen Trends, zeigt die Richtung und deren Änderung an. Der Signalindikator basiert auf Änderungen der Volatilität und zeigt Markteintritte an. Der Indikator ist mit mehreren Arten von Warnungen ausgestat
Trendindikatoren sind einer der Bereiche der technischen Analyse und werden im Handel an Finanzmärkten eingesetzt. Angular Trend Lines -Indikator – bestimmt umfassend die Trendrichtung und generiert Einstiegssignale. Neben der Glättung der durchschnittlichen Richtung der Kerzen Dabei wird auch der Neigungswinkel von Trendlinien genutzt. Für den Neigungswinkel wurde das Prinzip der Konstruktion von Gann-Winkeln zugrunde gelegt. Der Indikator für die technische Analyse kombiniert Candlestick-Glätt
Zyklischer Indikator für den Handel und die Prognose der Marktrichtung. Zeigt das zyklische Verhalten des Preises in Form eines Oszillators. Gibt Signale für die Eröffnung von Trades aus, wenn es eine Erholung von der Ober- und Untergrenze des Oszillators gibt. In Form eines Histogramms zeigt es die geglättete Stärke des Trends.  Ergänzt jede Handelsstrategie, vom Scalping bis zum Intraday.  Der Indikator wird nicht neu gezeichnet.  Geeignet für den Einsatz auf allen Symbolen/Instrumenten.  Gee
Indikator für manuellen Handel und technische Analyse für Forex. Es besteht aus einem Trendindikator mit dem Eröffnungsniveau des Handelstages und einem Pfeilindikator zur Bestimmung von Einstiegspunkten. Der Indikator ändert seine Farbe nicht; er funktioniert, wenn die Kerze schließt. Enthält verschiedene Arten von Warnungen für Signalpfeile. Kann für die Arbeit mit jedem Diagramm, Handelsinstrument oder Zeitrahmen konfiguriert werden. Die Arbeitsstrategie basiert auf der Suche nach Preisbewe
Ein technischer Indikator, der Diagramme strukturiert und zyklische Preisbewegungen identifiziert. Kann mit allen Diagrammen funktionieren. Mehrere Arten von Benachrichtigungen. Auf dem Diagramm selbst befinden sich zusätzliche Pfeile. Ohne erneutes Zeichnen der Historie wird beim Schließen der Kerze gearbeitet. Empfohlener TF ab M5. Einfach zu verwenden und Parameter zu konfigurieren. Wenn Sie 2 Indikatoren mit unterschiedlichen Parametern verwenden, können Sie diese ohne andere Indikatoren ve
Point Trend Indicator – Ein Indikator für das obere und untere Niveau des Trends, der die Trendrichtung bestimmen und seine Verstärkung anzeigen kann. Die Trendrichtung wird durch runde Punkte bestimmt; liegen die Punkte über der Nulllinie, ist der Trend bullisch, liegen sie darunter, ist der Trend bärisch. Die Zunahme der Richtungsbewegung wird durch Pfeile angezeigt. Es gibt den einzigen Parameter zur manuellen Anpassung – die Dauer der Trendrichtung.   Möglichkeiten Funktioniert in allen Zei
Indicator Waiting Volatility – ein Indikator zur Bestimmung von Volatilitätszonen und flachen Bedingungen. Im Laufe der Zeit weist der Preis im Diagramm unterschiedliche Trends auf, sinkt, steigt oder bleibt gleich. Der Indikator hilft dem Händler zu bestimmen, in welchem ​​Trend sich der Preis befindet. Bei seiner Arbeit nutzt er mehrere Werkzeuge zur technischen Analyse: Zunächst wird die Richtung des Trends bestimmt, dann überwacht der Indikator in dieser Richtung Änderungen der Volatilität.
An indicator that determines the point levels of price resistance. The arrows indicate price bounces in the indicated directions. Arrows are not redrawn formed on the current candle, shown on the previous candle for convenience.      It has one setting - the formation intensity: If the parameter is smaller, most of the signals are formed in a wide trend. If the parameter is larger, signals are formed in a narrower trend. Input parameters Formation Intensity - Arrow Formation Intensity Number B
Line Breakouts – System für den Trendhandel. Enthält eine Trendkennung, die mithilfe der Perioden- und Glättungsfunktion an jedes Diagramm und Handelsinstrument angepasst werden kann. Und ein bestimmender Faktor für die Unterstützungs- und Widerstandsniveaus. Wenn der Preis unter der Widerstandslinie liegt, eröffnen Sie Verkaufsgeschäfte, und wenn der Preis über der Unterstützungslinie liegt, eröffnen Sie Kaufgeschäfte. Der Stop-Loss sollte einige Punkte von den Linien entfernt platziert werden.
Arrow indicator with trend filter. Generates trend input without delays or delays - on the emerging candle. Suitable for use on any trading tools and timeframes. Easy to use, contains the direction of the trend in the form of a histogram lines and signal generator. Input parameters Period Trend Line - Period of the Histogram Line Signal Generator Period - If the period is longer, then the arrows are less Play sound Display pop-up message Send push notification Send email Sound file signal - Fi
A trend indicator showing the strength of bulls and bears in a trading range. Consists of two lines: The green line is a balanced overbought/oversold condition. The red line is the direction of trading activity. Does not redraw calculations. Can be used on all Symbols/Instruments/Time Frames. Easy to use and set up. How to use the indicator and what it determines. The basic rule is to follow the direction of the red line: if it crosses the green line from the bottom up, the market is dominat
FREE
Lines Channel Pro
Vitalyi Belyh
5 (1)
The "Lines Channel Pro" indicator determines price reversals from the High/Low channel. Contains a built-in trend finder, signal lines, entry and exit points. The recommended timeframe for M15 to work is D1. For each timeframe and trading instrument, depending on the volatility, it is necessary to select individual settings. Does not redraw calculations. Input parameters Use Channel trend filter - Turn on/off the trend filter Channel trend period - Trend filter period (from 8 and above) Line
Der Indikator „ ZigZag on Trend “ ist ein Assistent zur Bestimmung der Richtung der Preisbewegung sowie ein Balken- und Pip-Rechner. Es besteht aus einem Trendindikator, der die Richtung des Preises anhand einer Trendlinie in Form eines Zickzacks überwacht, und einem Zähler, der die Anzahl der in Trendrichtung durchlaufenen Balken und die Anzahl der Punkte auf einer vertikalen Skala berechnet. (Berechnungen werden bei der Eröffnung des Balkens durchgeführt) Der Indikator wird nicht neu gezeichne
Channel Cluster
Vitalyi Belyh
5 (1)
Cluster indicator working in the price channel. For operation, the indicator builds a channel line - (dashed line). Inside the channel, cluster sections are determined that determine the direction of the price movement - (histograms in two directions), start with large arrows. Small arrows are plotted above / below each histogram - indicator increase volatility. The indicator does not redraw the values. Works on any tools and timeframes. Entrances are made when large arrows appear, inside small
Oscillatory price direction indicator for Forex. It has 2 operating modes - trend and scalping. The trend mode of operation allows you to determine the direction of the market movement in the medium term. The scalping mode works by determining the price movement in the short term. Consists of a blue line, from which the balance between the directions of the price and signal green / red line. The green line shows the direction of the price up, and the red line shows the direction of the price dow
Zig-Zag indicator with additional signals for inputs. Visually easy to use: The red zig-zag line is an uptrend. The blue zig-zag line is a downward trend. Arrows in the form of additional signals. Works on any trading pairs. On any timeframe. Not redrawn. Input parameters Zig-Zag Period - Zig-zag period (from 5) Signal Period - period of signal arrows (from 3) Alerts for signals Play sound - Sound alert Display pop-up message - Notification by message on the screen Send push notification
Signal indicator that displays price reversals from the upper and lower corners of the chart. It is adjusted for different volatility and timeframes by one parameter - Gradation . Works on any trading pairs. The recommended timeframe for use is from M15 and higher. Not redrawn. If necessary, I will help you choose the optimal setting. Input parameters Gradation - from 0 and higher. If the parameter is larger, arrows are displayed at shorter price intervals. Alerts for signals Play sound - S
Linear indicator for trend trading together with scalping method. The yellow line is used to calculate the long-term price trend. As the yellow line moves, a scalper signal line is applied - a thin red one. A zero level is applied to confirm signals. If the yellow line crossed the zero level upwards, the trend is up. If the yellow line crossed the zero level from top to bottom, the trend is down. The signal red line works in a similar way, only its sensitivity to price movements is higher. Re
A technical indicator that calculates its readings based on trading volumes. It has an oscillatory line that follows the change in volumes. Large arrows on the line indicate reversal values. A channel is built around the line with small arrows showing the strengthening of price movement in the direction of increasing volumes. The indicator does not redraw values. Works on any instrument and timeframe. It can complement any trading strategy by finding a trend or make entries in the direction of a
This indicator is based on a trend guide line and a special oscillator, defining entry points at the moments of potential price movement. The indicator does not redraw. Works on any instrument. The most preferred time frames to use are M5, M15, M30, H1, H4. The guide trend line of the indicator gives an idea about the movement of the market. When the green line crosses the zero level from top to bottom - the market is bearish when it crosses from bottom to top - bull market. The oscillator is
Developed methods for trading collected in one indicator. In the form of arrows, it defines entries in the direction of the trend. It has 2 types of arrows - trend and signal guides, informing about the potential movement in the direction of the trend. Works without redrawing, ready for use on all symbols/tools. The most suitable time frames to use are M15, M30, H1, H4. How to use The indicator finds the direction of the trend in the form of a signal arrow, a graphic rectangle stretches along
Max Min Reversal Arrows - an arrow reversal indicator for predicting price movement. The indicator is built on the support and resistance levels at the local lows and highs of the price. Product features Arrows appear on the current candle. The indicator does not redraw. Can be used on all time frames and trading instruments. Recommended timeframes to use M30, H1, H4. The dotted lines are the support and resistance levels within the signal. Price movement from these levels means a reversal. Pr
Scalping Entry Points - ist ein manuelles Handelssystem, das sich an Preisbewegungen anpassen und Signale für offene Geschäfte ohne Neuzeichnung geben kann. Der Indikator bestimmt die Richtung des Trends anhand des zentralen Unterstützungs- und Widerstandsniveaus. Der Punktindikator liefert Signale für Ein- und Ausstiege. Geeignet für manuellen Intraday-Handel, Scalping und binäre Optionen. Funktioniert für alle Zeitrahmen und Handelsinstrumente. Der Indikator gibt verschiedene Arten von Warnung
Indikator des Preiskanals und des darin enthaltenen Breakpoint-Generators. Es gibt einen Eindruck von der Lage des Preises im Verhältnis zur Nutzungsdauer. Es enthält geglättete Trend-Absprunglinien entlang der Kanalgrenzen und Absprungpunkte, die den Ein- und Ausstiegszeitpunkt bestimmen. Funktioniert mit verschiedenen Handelsinstrumenten und Zeitrahmen. So arbeiten Sie mit dem Indikator Folgen Sie der Kanalunterbrechungslinie. Die blaue Linie zeigt die oberen Eingänge, die rosa Linie die unt
Candle Binary Scalper ist ein technisches Analyseprodukt für Devisen und binäre Optionen. Enthält mehrere technische Indikatoren, die in einem Handelssystem zusammengefasst sind. Geeignet für den manuellen Handel innerhalb eines Trends, für Scalping und binäre Optionen. Funktioniert für alle Zeitrahmen und Handelsinstrumente. Empfohlene Zeitrahmen für den Handel M15, M30, H1 und H4, M5 und M1 sollten bei hoher Volatilität verwendet werden. Es gibt verschiedene Arten von Warnungen. So verwenden
Binary Lines ist ein technischer Analyseindikator für Währungen, Rohstoffe, Kryptowährungen, Aktien, Indizes und alle Finanzinstrumente. Kann für binäre Optionen oder Forex-Scalping verwendet werden. Zeigt Ein- und Ausstiegspunkte in festen Abständen an und stellt bereit Händlern die notwendigen Informationen über die Ergebnisse möglicher Transaktionen. Einstiegspunkte werden ganz am Anfang der Kerze in Richtung der MA-Linie und der Dauer gebildet Trades in Bars können manuell angepasst und an j
Ein technischer Indikator, der seine Messwerte anhand des Handelsvolumens berechnet. In Form eines Histogramms zeigt es die Akkumulation der Stärke der Bewegung des Handelsinstruments. Es verfügt über unabhängige Berechnungssysteme für bullische und bärische Richtungen. Funktioniert mit allen Handelsinstrumenten und Zeitrahmen. Kann jedes Handelssystem ergänzen. Der Indikator zeichnet seine Werte nicht neu, die Signale erscheinen auf der aktuellen Kerze. Es ist einfach zu bedienen, lädt das Diag
Candle Power Signals ist ein Trendindikator, der eine Strategie zur Suche nach potenziell volatilen Signalen verwendet, um Handelsentscheidungen zu treffen. Durch die Analyse des Marktes identifiziert der Indikator Zonen mit erhöhter und verringerter Volatilität innerhalb der Richtungstrendbewegung. Die wichtigsten Signalerzeugungsparameter wurden bereits konfiguriert, die restlichen Einstellungen und Zeiträume sind in 2 Parametern zur manuellen Konfiguration indiziert: 1. "Candle calculation m
Scalping and Binary Signal Detector – Scalping-Indikator, der Richtungssignale für Eröffnungspositionen entlang des Trends liefert. Der Indikator ist ein vollständiges Handelssystem, das für Forex und binäre Optionen verwendet werden kann. Das Algorithmensystem ermöglicht es Ihnen, starke Preisbewegungen in mehreren aufeinanderfolgenden Balken zu erkennen. Der Indikator bietet verschiedene Arten von Warnungen für Pfeile. Funktioniert mit allen Handelsinstrumenten und Zeitrahmen (M5 oder höher em
Level Breakout Indicator ist ein technisches Analyseprodukt, das anhand oberer und unterer Grenzen arbeitet und die Richtung des Trends bestimmen kann. Funktioniert bei Kerze 0 ohne Neuzeichnen oder Verzögerungen. Bei seiner Arbeit verwendet es ein System verschiedener Indikatoren, deren Parameter bereits konfiguriert und zu einem einzigen Parameter zusammengefasst wurden – „ Scale “, der die Abstufung der Perioden vornimmt. Der Indikator ist einfach zu verwenden und erfordert keine Berechnungen
Auswahl:
Keine Bewertungen
Antwort auf eine Rezension
Version 1.20 2024.08.16
Changing Internal Settings
Version 1.10 2024.08.09
change parameters