• Übersicht
  • Bewertungen (2)
  • Diskussion

ON Trade Optuma Astro MT5

Natürlich, hier ist die Übersetzung in Deutsch:

Vorstellung des Astronomie-Indikators für  MT4 / MT5 : Dein ultimativer himmlischer Trading-Begleiter

Bist du bereit, deine Trading-Erfahrung auf himmlische Höhen zu heben? Suche nicht weiter als unseren revolutionären Astronomie-Indikator für MT4. Dieses innovative Tool übertrifft herkömmliche Trading-Indikatoren und nutzt komplexe Algorithmen, um dir unvergleichliche astronomische Einblicke und präzise Berechnungen zu bieten.

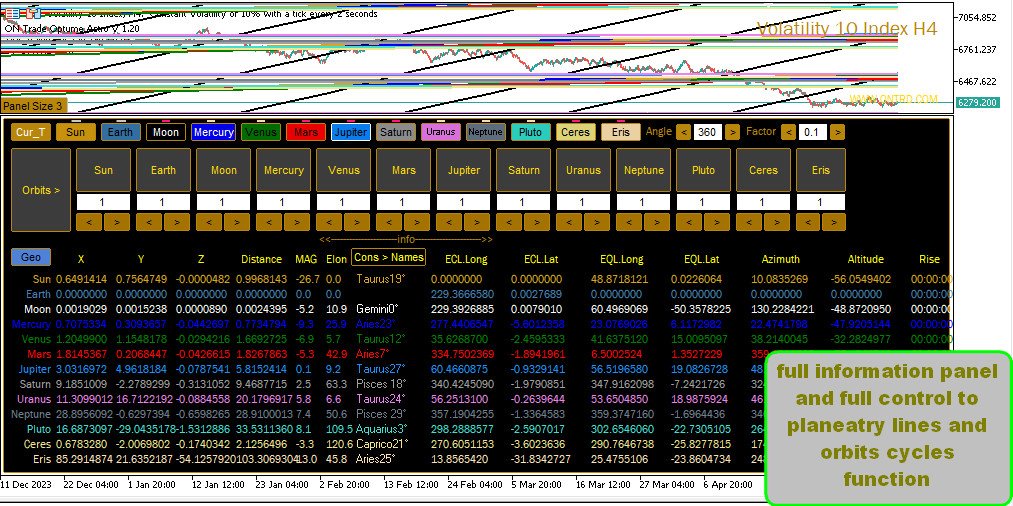
Ein Universum an Informationen zur Hand: Betrachte ein umfassendes Panel, das einen Schatz an astronomischen Daten enthüllt. Beobachte die geozentrischen/heliocentrischen Koordinaten der Planeten, den Sonne/Erde-Abstand, Größe, Ausdehnung, Sternbilder, Ekliptik- und Äquator-Koordinaten sowie sogar horizontale Koordinaten – jedes Detail sorgfältig berechnet und wunderschön präsentiert. Die durch den Indikator generierte vertikale Linie entspricht dem Zeitwert und verleiht dir eine kosmische Perspektive auf deine Trading-Reise.

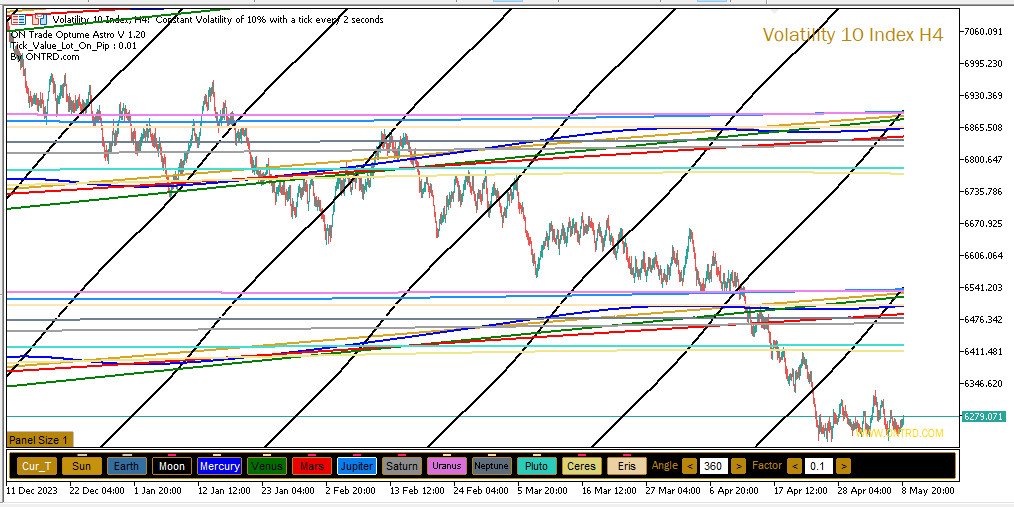
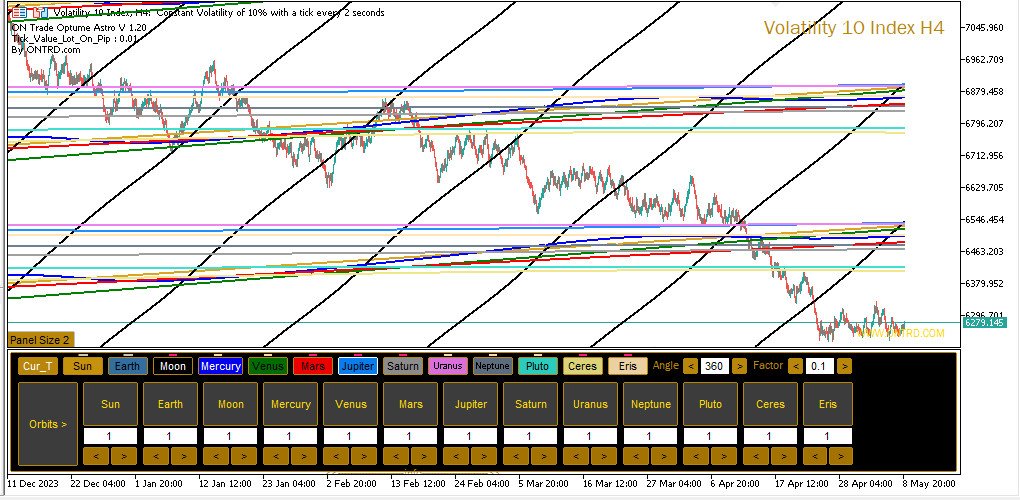
Planetare Linien und Beziehungen: Erlebe die Magie der planetaren Linien, die deine Charts zieren, mit anpassbaren Skalen und Winkeln. Die Sichtbarkeit der Linie jedes Planeten lässt sich mühelos über das intuitive Kontrollpanel umschalten. Entdecke die Kunst der planetaren Beziehungen mit Indikatoren für Konjunktionen, Sextile, Quadraturen, Trigone, Oppositionen und rückläufige Bewegungen. Erkunde diese kosmischen Konfigurationen in deinem gewählten Zeitrahmen und ermächtige dich, bedeutende Trading-Chancen zu identifizieren.

Ganns Weisheit enthüllen: Offenbare die Zukunft mit von Gann inspirierten vertikalen Quadratur-Linien, die potenzielle Umkehrzeitpunkte zeigen. Diese innovative Modifikation bringt Ganns bewährte Prinzipien zum Leben und hilft dir, Marktwenden und Trends vorauszusehen.

Lunare Führung: Navigiere mit Eleganz durch die Mondphasen, während Neumond und Vollmond deine Charts schmücken. Lunare Zyklen spielen eine wichtige Rolle im Trading, und unser Indikator stellt sicher, dass dir kein Detail entgeht.

Der Vorteil des Quadrats der Neun: Nutze das Quadrat der Neun-Panel, um deine astronomischen Analysen zu bereichern. Dieses alte Werkzeug wurde nahtlos integriert, um dir einzigartige Perspektiven auf Preis- und Zeitbeziehungen zu ermöglichen.

Zeit des planetarischen Grads: Mach dich auf eine Reise durch den Himmel mit der Funktion "Zeit des planetarischen Grads". Passe Winkel mühelos an und tauche in die kosmische Welt ein, um deine Trading-Entscheidungen mit himmlischer Weisheit in Einklang zu bringen.

Orbits und mehr: Erlebe die Orbits-Funktion, eine clevere Eigenschaft, die Orbits-Zeit-Trenner auf deine Charts zeichnet, sei es täglich oder aktuell. Das Kontoinformations-Panel des Indikators ergänzt seine Funktionen um einen leistungsstarken Losrechner und eine Alarmfunktion, um sicherzustellen, dass du immer die Kontrolle behältst.

Die Sterne ergreifen: Navigiere durch das Universum des Tradings mit einer Überlagerungsfunktion, die Klarheit und Präzision bietet. Jede Funktion ist nahtlos über das intuitive Kontrollpanel zugänglich, sodass du deine bevorzugten Einstellungen für eine personalisierte Trading-Reise speichern kannst.

Eine glänzende Zukunft erwartet dich: Dieser Astronomie-Indikator markiert den Beginn einer neuen Ära. Während du sein Potenzial nutzt, erinnere dich daran, dass dies erst der Anfang ist. Updates sind in Sicht, mit der Vision, ihn als führendes und unvergleichliches Angebot auf dem Markt zu etablieren.

Eine wichtige Anmerkung: Obwohl der Indikator keine Rücktests unterstützt, sei versichert, dass seine Funktionalität akkurat in einem beigefügten Video und Bildern erfasst wurde. Erlebe seine dynamischen Fähigkeiten in Aktion.

Deine Bewertung zählt: Während du diese kosmische Trading-Reise antrittst, teile bitte deine Erfahrungen in Bewertungen mit. Dein Feedback beflügelt unseren Streben nach Exzellenz.

Umarme die Sterne, fange die Planeten ein und navigiere mit Zuversicht durch das Universum des Tradings. Der Astronomie-Indikator für MT4 ist dein Leitstern in der Welt des Tradings, der das Tiefe mit dem Praktischen in einem harmonischen Tanz von himmlischer Präzision und finanzieller Klugheit verbindet.


Empfohlene Produkte
The best time to trade Using this Indicator is when the time reach exactly hour,half,45 minutes,15 minutes and sometimes 5 minutes.. This indicators is helpful to those who trade boom and crash indecies.How to read this indicator first you'll see Blue allow and Red allow all these allows used to indicate or to detect the spike which will happen so the allow happens soon before the spike happen.This indicator works properly only in boom and crash trading thing which you have to consider when
Candle EA MT5
Mansour Babasafary
4.36 (44)
This expert is based on patterns The main patterns of this specialist are candlestick patterns Detects trends with candlestick patterns It has a profit limit and a loss limit, so it has a low risk The best time frame to use this expert is M30 time frame The best currency pairs to use with this expert is the EURUSD, GBPUSD, AUDUSD, USDCAD currency pairs Attributes: Can be used in the EURUSD, GBPUSD, AUDUSD, USDCAD  currency pairs Can be used in M30, H1, H4 time frames Has profit limit an
Der Trendfänger: Die Strategie des Trendfängers mit Alarmindikator ist ein vielseitiges technisches Analysewerkzeug, das Händlern hilft, Markttrends und potenzielle Ein- und Ausstiegspunkte zu identifizieren. Sie verfügt über eine dynamische Trendfängerstrategie, die sich den Marktbedingungen anpasst, um eine klare visuelle Darstellung der Trendrichtung zu ermöglichen. Händler können die Parameter an ihre Vorlieben und Risikotoleranz anpassen. Der Indikator hilft bei der Trendidentifikation,
FREE
PZ Trend Trading MT5
PZ TRADING SLU
3.67 (3)
Trend Trading ist ein Indikator, der so weit wie möglich von den Markttrends profitiert, indem er Pullbacks und Breakouts zeitlich festlegt. Sie findet Handelsmöglichkeiten, indem sie analysiert, was der Preis während etablierter Trends tut. [ Installationsanleitung | Update-Anleitung | Fehlerbehebung | FAQ | Alle Produkte ] Handeln Sie mit Zuversicht und Effizienz an den Finanzmärkten Profitieren Sie von etablierten Trends, ohne ins Wanken zu geraten Profitable Pullbacks, Ausbrüche und vor
Orbit Rage Final 2
BILLY ARANDUQUE ABCEDE
Note : i only sell this EA on MQL5, any other sellers is fake. Orbit Rage Final, a cutting-edge trading strategy meticulously designed around the bull/bear candle approach and divergence analysis. This powerful tool is engineered to empower you to shape the life you desire. To embark on this transformative journey, simply download and seamlessly integrate it into your MetaTrader 4 platform by placing it in the experts advisors folder. Orbit Rage Final revolutionizes trading by offering a risk-f
Introduction to Chart Pattern MT Chart Pattern MT is a chart pattern scanner to detect the triangle pattern, falling wedge pattern, rising wedge pattern, channel pattern and so on. Chart Pattern MT uses highly sophisticated chart pattern detection algorithm. However, we have designed it in the easy to use with intuitive user interface. Chart Pattern MT will show all the patterns in your chart in the most efficient format for your trading. You do not have to do tedious manual pattern detection an
MarketMagnet
Kelly Adediran Raymond
Are you ready to take your trading journey to new heights? Look no further than MarketMagnet, this groundbreaking indicator designed to propel your trading success with excitement and accuracy. Powered by the convergence of Momentum and CCI (Commodity Channel Index), MarketMagnet equips traders with the ultimate tool to determine direction and entry prices for a wide range of recommended currency pairs and instruments. It is designed for traders seeking to scalp for a few pips on lower timeframe
Somewhere over the rainbow It is a system that tries to operate the market from the exhaustion of the trend with a correction algorithm that tries to cut losses at the cost of increasing the margin This system makes all the adjustments automatically, analyzing the pair and the market to decide which is the most efficient step to reach your destination. Somewhere over the rainbow is a multiple trade and multi lot system(The maximum batch can be up to 5 times the initial batch distributed in mul
Your Trend Friend
Luigi Nunes Labigalini
5 (1)
The trend is your friend! Look at the color of the indicator and trade on that direction. It does not  repaint. After each candle is closed, that's the color of the trend. You can focus on shorter faster trends or major trends, just test what's most suitable for the symbol and timeframe you trade. Simply change the "Length" parameter and the indicator will automatically adapt. You can also change the color, thickness and style of the lines. Download and give it a try! There are big movements
Premium-Level ist ein einzigartiger Indikator mit mehr als 80% Genauigkeit der richtigen Vorhersagen! Dieser Indikator wurde von den besten Trading-Spezialisten seit mehr als zwei Monaten getestet! Den Indikator des Autors finden Sie nirgendwo anders! Anhand der Screenshots können Sie sich von der Genauigkeit dieses Tools überzeugen! 1 ist ideal für den Handel mit binären Optionen mit einer Ablaufzeit von 1 Kerze. 2 funktioniert bei allen Währungspaaren, Aktien, Rohstoffen, Kryptowähr
Dieser Indikator zeigt Ihnen die TP- und SL-Werte (in dieser Währung), die Sie bereits für jede Order in den Charts (geschlossen zur Transaktions-/Orderzeile) festgelegt haben, was Ihnen sehr dabei helfen wird, Ihren Gewinn und Verlust für jede Order zu schätzen. Und es zeigt Ihnen auch die PIPs-Werte. das angezeigte Format ist „Währungswerte unserer Gewinn- oder Verlust-/PIPs-Werte“. Der TP-Wert wird in grüner Farbe und der SL-Wert in roter Farbe angezeigt. Bei Fragen oder weiteren Informati
Elliott Wave Trend was designed for the scientific wave counting. This tool focuses to get rid of the vagueness of the classic Elliott Wave Counting using the guideline from the template and pattern approach. In doing so, firstly Elliott Wave Trend offers the template for your wave counting. Secondly, it offers Wave Structural Score to assist to identify accurate wave formation. It offers both impulse wave Structural Score and corrective wave Structure Score. Structural Score is the rating to sh
TPO Profile MT5
Kyra Nickaline Watson-gordon
Definition : TPO is a Time Price Opportunity. Instead of using bars or candles with an Open, High, Low, and Close price, each "bar" in a Market Profile is represented by horizontal bars against the price It is called Market Profile terminology. In other words time-price-opportunity (TPO) profiles are histograms of how much time was spent at each price within the span of the profile. By using a TPO chart, you are able to analyze the amount of trading activity, based on time, for each price leve
Super Powered
Godbless C Nygu
Discover the ultimate trading companion—our exclusive robot tailored for GBPUSD and EURUSD pairs. Crafted through a synergy of diverse strategies, this innovative solution promises unparalleled results, making it the perfect starting point for your trading journey. Equipped with comprehensive account statistics, this robot offers real-time monitoring capabilities, empowering you to stay on top of your trades throughout the day. Customise lot sizes effortlessly to align with your trading goals an
How to use Pair Trading Station Pair Trading Station is recommended for H1 time frame and you can use it for any currency pairs. To generate buy and sell signal, follow few steps below to apply Pair Trading Station to your MetaTrader terminal. When you load Pair Trading Station on your chart, Pair Trading station will assess available historical data in your MetaTrader platforms for each currency pair. On your chart, the amount of historical data available will be displayed for each currency pai
Mine Farm
Maryna Kauzova
5 (1)
Mine Farm is one of the most classic and time-tested scalping strategies based on the breakdown of strong price levels. Mine Farm is the author's modification of the system for determining entry and exit points into the market... Mine Farm - is the combination of great potential with reliability and safety. Why Mine Farm?! - each order has a short dynamic Stop Loss - the advisor does not use any risky methods (averaging, martingale, grid, locking, etc.) - the advisor tries to get
Free automatic Fibonacci is an indicator that automatically plots a Fibonacci retracement based on the number of bars you select on the BarsToScan setting in the indicator. The Fibonacci is automatically updated in real time as new highest and lowest values appears amongst the selected bars. You can select which level values to be displayed in the indicator settings. You can also select the color of the levels thus enabling the trader to be able to attach the indicator several times with differe
FREE
Stormer RSI 2
Ricardo Rodrigues Lucca
This strategy was learned from Stormer to be used on B3. Basically, 15 minutes before closing the market, it will check RSI and decided if it will open an position. This strategy do not define a stop loss. If the take profit reach the entry price it will close at market the position. The same happens if the maximal number of days is reached. It is created to brazilian people, so all configuration are in portuguese. Sorry Activations allowed have been set to 50.
Introducing "X Marks the Spot" – Your Ultimate MetaTrader 5 Indicator for Perfect Trades! Are you tired of the guesswork in trading? Ready to take your MetaTrader 5 experience to a whole new level? Look no further – "X Marks the Spot" is here to revolutionize your trading strategy! What is "X Marks the Spot"? "X Marks the Spot" is not just another indicator – it's your personal trading compass that works seamlessly on all timeframes . Whether you're a beginner or an experienced trader,
Zunächst einmal ist es wichtig zu betonen, dass dieses Handelstool ein Nicht-Repaint-, Nicht-Redraw- und Nicht-Verzögerungsindikator ist, was es ideal für professionelles Trading macht. Online-Kurs, Benutzerhandbuch und Demo. Der Smart Price Action Concepts Indikator ist ein sehr leistungsstarkes Werkzeug sowohl für neue als auch erfahrene Händler. Er vereint mehr als 20 nützliche Indikatoren in einem und kombiniert fortgeschrittene Handelsideen wie die Analyse des Inner Circle Traders und S
Gyroscope        professional forex expert   (for EURUSD, GBPUSD, USDJPY, AUDUSD, USDCHF, EURGBP, EURJPY, NZDUSD, USDCAD, EURCHF, AUDJPY, CADJPY pairs)   alyzing the market using the Elliot Wave Index. Elliott wave theory is the interpretation of processes in financial markets through a system of visual models (waves) on price charts. The author of the theory, Ralph Elliott, identified eight variants of alternating waves (of which five are in the trend and three are against the trend). The mo
Noize Absorption Index - is the manual trading system that measures the difference of pressure between bears forces and bulls forces. Green line - is a noize free index that showing curent situation. Zero value of index shows totally choppy/flat market.Values above zero level shows how powerfull bullish wave is and values below zero measures bearish forces.Up arrow appears on bearish market when it's ready to reverse, dn arrow appears on weak bullish market, as a result of reverse expectation.
The Volume by Price Indicator for MetaTrader 5 features Volume Profile and Market Profile TPO (Time Price Opportunity). Volume and TPO histogram bar and line charts. Volume Footprint charts. TPO letter and block marker collapsed and split structure charts. Session filtering and grouping. Static, dynamic and flexible range segmentation and compositing methods with relative and absolute visualizations. Graphical layering, positioning and styling options to suit the user's analytic and aesthetic n
Gecko EA MT5
Profalgo Limited
5 (1)
NEW PROMO: Only a few copies copies available at 349$ Next price: 449$ Make sure to check out our " Ultimate EA combo package " in our   promo blog ! Gecko runs a simple, yet very effective, proven strategy.  It looks for important recent support and resistance levels and will trade the breakouts.  This is a "real" trading system, which means it will use a SL to protect the account.  It also means it will not use any dangerous techniques like martingale, grid or averaging down. The EA shows its
Utility for show on charts the visual informations about: - a vertical line at start of each bar of selected timeframe - a vertical line at start of each day - a vertical line at start of each week - vertical lines at start / end of trading sessions selected - bid / ask prices, spread, money value for each point (of 1 standard lot) and last tick time recived" You can enable / disable each information and set the color for each line
FREE
General Description In the simplest terms this is a contrarian intra-day scalping system. Built to try and let correct trades run as far as possible and flip the trade when indicated. The indicator looks at historical daily trading ranges to lay out levels at which it takes long and short positions based on the statistical levels. The indicator is built around index futures, mainly around S&P and the DOW but can be used an any futures contract mainly using AMP Futures to trade. The indicator is
Owl Smart Levels MT5
Sergey Ermolov
4.38 (37)
MT4-Version  |  FAQ Der Owl Smart Levels Indikator ist ein komplettes Handelssystem innerhalb eines Indikators, der so beliebte Marktanalysetools wie die fortschrittlichen Fraktale von Bill Williams , Valable ZigZag, das die richtige Wellenstruktur des Marktes aufbaut, und Fibonacci-Levels , die die genauen Einstiegslevels markieren, enthält in den Markt und Orte, um Gewinne mitzunehmen. Detaillierte Strategiebeschreibung Anleitung zur Verwendung des Indikators Berater-Assistent im Handel Owl H
MSnR Lines
Pierre Paul Amoussou
MSnR Lines ist ein benutzerdefinierter Indikator, der dazu dient, Unterstützungs- und Widerstandsebenen auf einem Chart anzuzeigen. Diese Ebenen basieren auf der malaysischen Theorie zu Unterstützung und Widerstand, die Ebenen nicht als Bereiche, sondern als spezifische Preisniveaus definiert, die aus Spitzen und Tälern von Liniendiagrammen abgeleitet sind. Eigenschaften: Drei Arten von Ebenen: A-Level, V-Level und Gap Level. Frische-Anzeige für Ebenen: Frische Ebenen sind signifikanter als unfr
PipFinite Breakout EDGE MT5
Karlo Wilson Vendiola
4.84 (114)
The Missing Edge You Need To Catch Breakouts Like A Pro. Follow a step-by-step system that detects the most powerful breakouts! Discover market patterns that generate massive rewards based on a proven and tested strategy. Unlock Your Serious Edge Important information here www.mql5.com/en/blogs/post/723208 The Reliable Expert Advisor Version Automate Breakout EDGE signals using "EA Breakout EDGE" Click Here Have access to the game changing strategy that will take your trading to the n
HMA Trend Professional MT5
Pavel Zamoshnikov
4.4 (5)
Improved version of the free HMA Trend indicator (for MetaTrader 4) with statistical analysis. HMA Trend is a trend indicator based on the Hull Moving Average (HMA) with two periods. HMA with a slow period identifies the trend, while HMA with a fast period determines the short-term movements and signals in the trend direction. The main differences from the free version: Ability to predict the probability of a trend reversal using analysis of history data. Plotting statistical charts for analyz
Käufer dieses Produkts erwarben auch
FxaccurateLS
Shiv Raj Kumawat
WHY IS OUR FXACCCURATE LS MT5 THE PROFITABLE ? PROTECT YOUR CAPITAL WITH RISK MANAGEMENT Gives entry, stop and target levels from time to time. It finds Trading opportunities by analyzing what the price is doing during established trends. POWERFUL INDICATOR FOR A RELIABLE STRATEGIES We have made these indicators with a lot of years of hard work. It is made at a very advanced level. Established trends provide dozens of trading opportunities, but most trend indicators completely ignore them!
IVISTscalp5
Vadym Zhukovskyi
5 (5)
Wir stellen Ihnen den iVISTscalp5-Indikator vor, der nicht nur einzigartig, sondern auch effektiv im Handel ist. Dieser Indikator basiert auf Zeitdaten und ist das Ergebnis jahrelanger Erfahrung und eingehender Analyse der Finanzmärkte. Der iVISTscalp5-Indikator ist ein ausgezeichnetes Werkzeug für manuellen Handel. Bequemlichkeit, Einfachheit und Visualisierung - die gesamte Komplexität ist verborgen. Wir haben die Einstellungen und Verwendung des iVISTscalp5-Indikators auf das Maximum vereinfa
Dies ist wahrscheinlich der vollständigste Indikator für die automatische Erkennung der harmonischen Preisbildung, den Sie für die MetaTrader-Plattform finden können. Es erkennt 19 verschiedene Muster, nimmt Fibonacci-Projektionen genauso ernst wie Sie, zeigt die potenzielle Umkehrzone (PRZ) an und findet geeignete Stop-Loss- und Take-Profit-Werte. [ Installationsanleitung | Update-Anleitung | Fehlerbehebung | FAQ | Alle Produkte ] Es erkennt 19 verschiedene harmonische Preisbildungen Dar
Introducing the Power Trade Plus indicator designed by a small group of traders with a few years of experience trading the market profitably.  The Power Trade Plus is derived from the Power Trade indicator,  the indicator strive in powerful sniper entries and take profit levels,  with an algorithm that's can determine the markets volatility and Provides entries based on the current market volatility. This indicator is much more effective in stock ,currencies and indices.
"Piranha" - an autonomous trading system that determines overbought and oversold levels on the chart. Red and blue zones represent overbought and oversold levels respectively. Entry points are marked with arrows: a downward arrow in the red zone for "sell" and an upward arrow in the blue zone for "buy". The Take profit level is indicated by the green moving average. Key features: Adjusting the Take profit level as the green moving average changes position. Averaging ability when a new market e
Professional Scalping Tool on Deriv Attention! The indicator will be sold in limited quantities!!! The previous 5 copies were sold for $250 The remaining 4 copies will be sold for $350 The next price is $500 Description: This trading indicator is designed for professional traders focused on scalping. Designed with the market in mind, it provides highly accurate spike trading signals. It works on the M1 timeframe and supports the following symbols: Boom 300 Index, Boom 500 Index, Boom 1000 I
TrendMaestro5
Stefano Frisetti
note: this indicator is for METATRADER4, if you want the version for METATRADER5 this is the link:  https://www.mql5.com/it/market/product/108106 TRENDMAESTRO ver 2.4 TRENDMAESTRO recognizes a new TREND in the bud, he never makes mistakes. The certainty of identifying a new TREND is priceless. DESCRIPTION TRENDMAESTRO identifies a new TREND in the bud, this indicator examines the volatility, volumes and momentum to identify the moment in which there is an explosion of one or more of these data a
VTrende Pro
Andrii Diachenko
5 (1)
VTrende Pro - MTF indicator for trend trading with a display panel for MT5 *** Videos can be translated into any language using subtitles (video language - Russian) Although the signals of the VTrende Pro indicator can be used as signals of a full-fledged trading system, it is recommended to use them in conjunction with the Bill Williams TS. VTrende Pro is an extended version of the VTrende indicator. Difference between Pro version and VTrende: - Time zones - Signal V - signal 1-2 waves
SMCpro
Arief
5 (1)
Currently Price  20% OFF  ( for unlimited use ) Indicator   USER MANUAL , trade setups, solving issues, etc :  Direct Download Here     (  for users only  ) Hello World! Introducing.. SMCpro tool and Indicator for  MetaTrader 5 , a cutting-edge feature designed to revolutionize your trading experience. With innovative ICT Smart Money Concept, you gain unparalleled insight into market dynamics, empowering you to make informed trading decisions like never before. SMC Indicator built on th
Fibonacci Suavizado
Cesar Juan Flores Navarro
Indicador en MQL5, que obtiene el promedio de 10 EMAS, que son alineadas según Fibonacci, obteniendo un promedio, que sera suavizado.  Se puede ingresar un numero desde 2 a N, que multiplica a los EMA-Fibonacci. Funciona en cualquier criptomoneda, etc. etc... pudiendo calcular el futuro segun la tendencia de las EMAS. Funciona excelentemente en tramos largos, determinando exactamente el mejor inicio/salida. El precio inicial por apertura sera por un periodo de tiempo, luego aumentará.
RAD CRITICAL LEVES RAD indicator tracks “Relevant Volume” in real time, identifying accumulation and distribution processes, projecting them in the chart as SUPPORT or RESISTANCE zones. Natural   support   and resistance levels are generated by Volume Accumulation and Distribution processes. As these processes evolve, levels at which the relevant volume in the market place is positioned, become difficult areas to cross upwards or downwards. By using this information, traders can identify very s
Eng Gold
Ely Alkrar Xshkaky
ENG-GOLD Scalper It is an auxiliary indicator that identifies potential targets and determines the place of entry with a stop loss that works on Heiken Ashi candles  The green lines are usually the targets, the red lines are the stop loss, and the yellow lines are the entry location.  This file is recognized on small and medium frames, usually less than the watch frame I highly recommend using XAUUSD US100 US30 USOIL 
Weis Wave with Alert MT5
Trade The Volume Waves Single Member P.C.
4.93 (15)
Rental/Lifetime Package Options and Privileges  * For optimum results the yearly or lifetime package is suggested due to live training ! Rent Monthly Six Months   Yearly/Lifetime Weis Wave with Speed with Alert+Speed Index x x x Manual  x x x Quick Set up Video x x x Blog x x x Lifetime Updates x x x Setup and Training Material x x Free Rectangle Break Alert Tool      x Discord Access Channel "The SI traders" x 2-hour live methodology training x How to trade with it:    http://
WanaScalper
Isaac Wanasolo
1 (1)
A scalping indicator based on mathematical patterns, which on average gives signals with relatively small SL, and also occasionally helps to catch big moves in the markets (more information in the video) This indicator has three main types of notifications: The first type warns of a possible/upcoming signal on the next bar The second type indicates the presence of a ready signal to enter the market/open a position The third type is for SL and TP levels - you will be notified every time price r
INDIKATOR basierend auf KÜNSTLICHER INTELLIGENZ, der mögliche Call- und Put-Eingaben für binäre Optionen generiert. Der Indikator funktioniert nach drei verschiedenen Strategien: 1) Durch das Ablesen der Volumina wird ein Signal gesendet, wann sich der Preis umkehren sollte 2) Durch die Divergenz zwischen Preis und Volumen sendet es ein Signal, wann sich der Trend fortsetzen oder umkehren sollte 3) Durch die Konvergenz zwischen Preis und Volumen sendet es ein Signal, wann sich der Trend
Average Cost Price helps you keep track of your open positions on the chart. In doing so, it provides lines and explanations on the chart. This line is the average price value of the Bid or Ask. If you wish, you can see the average cost price by adding SWAP and COMMISSION to the average price value. *** You can add commission manually per lot. The legend below the Average Cost Price line gives you: * Average Buy or Sell price line, * Swap Amount, * Commission Amount, * Total Profit or Los
TREND HARMONY MT5 – Multi Timeframe Trend and Phase and Pullback Level Visualizer indicator for Metatrader5 The TREND HARMONY indicator automates deep trend analysis and generates visualizations for you. Take control of your trades by eliminating uncertainty! Revolutionize your trading experience with precision and insight through the TREND HARMONY Multi Timeframe indicator – your ultimate MT5 trend visualization indicator. [  Features and Manual   | MT4 version |   All Products   ] Are you t
The indicator is designed to close positions on the market in time. For example: to take profits ahead of schedule if the price has not reached TakeProfit, and the market is turning around. The indicator analyzes the momentum, not the trend. He does not give any information about the trend. The indicator is well suited for finding divergence. The Ershov 38 Parrots indicator dynamically adjusts to the market and detects price movement impulses of medium and high amplitude. It almost does not rea
Smooth price for Monarch
Konstantin Gruzdev
5 (1)
The Smooth Price technical indicator is used for plotting a smoothed line as close to the price of the financial instrument as possible, and serves to eliminate its noise components. The indicator is part of the Monarch trading system, but here it is presented as an independent technical analysis tool. The indicator is based on the cluster digital filter , which, unlike the ClusterSMA , is applied directly to the price time series. Smooth Price does not redraw (except the very last, zero bar) an
Классификатор силы тренда. Показания на истории не меняет. Изменяется классификация только незакрытого бара. По идее подобен полной системе ASCTrend, сигнальный модуль которой, точнее его аппроксимация в несколько "урезанном" виде, есть в свободном доступе, а также в терминале как сигнальный индикатор SilverTrend . Точной копией системы ASCTrend не является. Работает на всех инструментах и всех временных диапазонах. Индикатор использует несколько некоррелируемых между собой алгоритмов для класси
Gartley Projections D
Oleksandr Medviediev
3 (2)
Der Indikator identifiziert die harmonischen Muster (XABCD) gemäß den Entwicklungen von H.M. Gartley („Profits in the Stock Market“, 1935г). Der D-Punkt wird als Punkt in der perspektivischen Projektion projiziert (geben Sie in den Einstellungen ProjectionD_Mode = true an). Wird nicht neu gezeichnet. Wenn ein Balken des Arbeitszeitraums schließt und sich der identifizierte Musterpunkt während der Balken von Patterns_Fractal_Bars nicht bewegt hat, erscheint ein Pfeil auf dem Diagramm (in Ric
Currency Index Watcher is a simple and user-friendly tool for whoever wish to trade Forex using currencies indexes. Currency Index Watcher is configurable and usable directly from the panel. Indexes of 8 custom currencies EUR, USD, GBP, JPY, CHF, AUD, CAD, NZD (default) Any 3-chars symbol from your market watch could be used (BTC = bitcoin, RUB = ruble, CNH = yuan etc ...) : double click the symbol label  Ability to select which currencies and made-of pairs will be analyzed : check/uncheck want
SmartTrendMt5
Andrey Spiridonov
The SmartTrendMt5 trend indicator generates signals based on the principle of combined analysis of calculated reference points within the Keltner channel. The indicator plots the Keltner channel in a separate window (by default, red lines and a blue line - the middle of the channel), and also draws the histogram of calculated reference points for each candle (by default, the histogram bars are yellow). The should be attached to a chart of any timeframe and any trading symbol in the usual way.
If there is only one MT5 indicator you ever buy for trading forex – this has to be it. Your success as a forex trader depends on being able to identify when a currency or currency pair is oversold or overbought. If it is strong or weak. It is this concept which lies at the heart of forex trading. Without the Quantum Currency Strength indicator, it is almost impossible. There are simply too many currencies and too many pairs to do this quickly and easily yourself. You need help! The Quantum C
Forex Relative Performance indicator This indicator calculates the relative strength of major currencies against the US dollar. The basic idea behind this indicator is "to buy strong currency and to sell weak currency". This indicator allows you to quickly identify the best forex pair to trade according to your trading style (Intraday, Scalping, Swing, or Long Term)
The latest most requested Binary Options arrow indicator in the Garuda Signals product line is now on MT5! Binary options signal based on multiple time frame cross over analysis. Gets confirmation from the most consistent signals known to man; Ichimoku, SMA, Bollinger Bands; and also uses the 1 Hour time frame as trend confirmation , so you don't have to open up multiple chart and waste time. - Can be used for all time frames up to 1 hour, but is most POWERFUL for 1 and 5 min options. - Place yo
SuavizadorDePrecio
Cesar Juan Flores Navarro
Funciona identificando picos de máximos y mínimos, para luego eliminarlos haciendo una linea o curva, pudiendo el usuario ingresar el valor de que tanto puede suavizar. Nos facilita poder ver la tendencia así como ver el cruce que puede hacer con otros indicadores, mostrando a simple vista los inicios y salidas de una tendencia u operación. Así también facilita la visualización de subidas y bajadas.
Pendiente de Precio
Cesar Juan Flores Navarro
Indicador en base a la pendiente de la linea de precio, dibuja una línea de color cuando sube a base de los precios que previamente has sido procesados o linealizados, y cuando baja la pendiente la linea linealizada toma otro color. En este caso se a considerado 6 lineas de diferentes procesos desde pendientes largas hacia las cortas, observándose que cuando coincidan las pendientes se produce un máximo o mínimo, lo que a simple vista nos permitirá hacer una COMPRA O VENTA.
Description Very precise patterns to detect: entry signals as well as breakout, support and resistance reversal patterns. It points out zones in which, with a high probability, institutional orders with the potential to change the price’s direction and keep moving towards it, have been placed. Support:   We create great tools for the entire trading community. Most of them are free. If you believe in what we do  Support Us Here.   KEY LINKS:   Indicator Manual  -  All Products  How is this ind
Индикатор Coefficient Of Determination (COD) представляет собой значение коэффициента детерминации или квадрат коэффициента корреляции между зависимой переменной — ценой и объясняющей переменной — тиковым объемом. Что это дает нам на практике? COD отлично распознает кульминацию трендовых движений, что позволяет подбирать оптимальные точки и ловить развороты рынка. Как использовать индикатор: Наиболее популярная торговая стратегия строится совместно с трендовым индикатором Moving Average (MA), пе
Weitere Produkte dieses Autors
Natürlich, hier ist die Übersetzung in Deutsch: Vorstellung des Astronomie-Indikators für MT4: Dein ultimativer himmlischer Trading-Begleiter Bist du bereit, deine Trading-Erfahrung auf himmlische Höhen zu heben? Suche nicht weiter als unseren revolutionären Astronomie-Indikator für MT4. Dieses innovative Tool übertrifft herkömmliche Trading-Indikatoren und nutzt komplexe Algorithmen, um dir unvergleichliche astronomische Einblicke und präzise Berechnungen zu bieten. Ein Universum an Information
Dieser Indikator wurde entwickelt, um mit der Elliott-Wellen-Theorie auf zwei Arten zu arbeiten: Automatische Arbeitsweise: In diesem Modus erkennt der Indikator automatisch alle fünf Motivwellen im Chart gemäß der Elliott-Wellen-Theorie. Er liefert Prognosen und identifiziert potenzielle Umkehrzonen. Darüber hinaus verfügt er über die Fähigkeit, Warnungen und Push-Nachrichten zu generieren, um Trader über bedeutende Entwicklungen zu informieren. Diese automatisierte Funktionalität vereinfacht d
Shepherd Harmonic Pattern
Abdullah Alrai
4.68 (59)
Dieser Indikator erkennt harmonische Muster, die manuell oder automatisch auf dem Chart gezeichnet wurden. Sie können das Benutzerhandbuch unter diesem Link einsehen: Fügen Sie Ihre Bewertung hinzu und kontaktieren Sie uns, um es zu erhalten. Es gibt eine kostenlose Version, um dieses Produkt auf MT4 auszuprobieren. Sie können es verwenden, um Gartley- und Nenstar-Muster zu erkennen: https://www.mql5.com/en/market/product/30181 Sie können die vollständige MT4-Version von kaufen: https://www.mql5
Der Gann Square Indikator ist ein leistungsstolles Marktanalyse-Tool, das auf dem Artikel "Mathematische Formel für Marktvorhersagen" von W.D. Gann basiert. Dieses Tool verwendet mathematische Konzepte und Gann-Theorien für eine präzise Marktanalyse. Es beinhaltet Quadratwerte von 144, 90, 52 und auch das Quadrat von 9. Darüber hinaus integriert es die Methode von  zur Quadratwurzel von 9 und deren Beziehung zu Kanälen und dem Sternmuster. Benutzerhandbuch und Anwendung: Vor der Verwendung diese
Bei diesem Indikator handelt es sich um eine Marktanalysemethode, die auf dem Artikel "Mathematische Formel für Marktprognosen" von W.D. Gann basiert, der auf Quadrat-von-Neun- und Quadrat-von-44-Methoden basiert. Benutzerhandbuch: Add Your review And contact us to get it Sie können die vollständige MT4-Version kaufen von: https://www.mql5.com/en/market/product/15316 Sie können auf MT4 kostenlos testen: https://www.mql5.com/en/market/product/15320?source=Site +Profile+Seller#!tab=
Erforschen Sie einen revolutionären Ansatz für den Handel mit dem Shepherd Numerology Levels Indikator. Dieses innovative Tool kombiniert das alte Wissen der Numerologie mit modernen Handelstechniken, um Ihnen bei der Identifizierung wichtiger Unterstützungs- und Widerstandsniveaus auf Ihren Charts zu helfen. Durch die Verwendung der Methode des Quadrats von Neun bietet dieser Indikator eine einzigartige Perspektive auf die Marktmechanismen und ermöglicht Ihnen informiertere Handelsentscheidunge
Shepherd Gann Squares Free
Abdullah Alrai
4.86 (37)
Bei diesem Indikator handelt es sich um eine Marktanalysemethode, die auf dem Artikel "Mathematische Formel für Marktprognosen" von W.D. Gann basiert, der auf Quadrat-von-Neun- und Quadrat-von-44-Methoden basiert. Benutzerhandbuch: Add Your review And contact us to get it Sie können die vollständige MT5-Version kaufen von: https://www.mql5.com/en/market/product/28669 Sie können auf MT4 kostenlos testen: https://www.mql5.com/en/market/product/15316 Dieses Produkt kann für Sie
FREE
This indicator will detect harmonic patterns that are drawn on the chart by manual and automatic methods. You can see user manual from this link: https://www.mql5.com/en/blogs/post/719257 There is a free version (it detect only Gartley and Nenstar Patterns) to try this product. You can buy the full MT4 version from: https://www.mql5.com/en/market/product/104689 Notes When you use this indicator and change the settings, add indicators like Moving Average or Bollinger Bands, this indicator will
FREE
ON Trade Marubozu-Kerzenmuster-Indikator Das Marubozu-Kerzenmuster ist ein kraftvolles und unkompliziertes Kerzenmuster, das wertvolle Einblicke in die Marktstimmung und mögliche Trendumkehrungen liefern kann. Es zeichnet sich durch eine Kerze mit sehr kleinem oder nicht vorhandenem Schatten (Lunte) an einem Ende und einem langen Körper aus, der sich in Richtung des vorherrschenden Trends erstreckt. Dieses Muster repräsentiert ein starkes Ungleichgewicht zwischen Käufern und Verkäufern und deute
FREE
Der Hikkake japanische Kerzenmuster-Indikator ist ein spezialisiertes Werkzeug, das entwickelt wurde, um alle auf dem Chart gebildeten Hikkake-Preisaktionsmuster zu identifizieren und zu erkennen. Diese Muster basieren auf dem Konzept eines falschen Durchbruchs aus einer Inside-Bar. Der Indikator analysiert die letzten fünf Kerzen auf dem Chart und bestimmt, ob sie die Merkmale des Hikkake-Musters aufweisen. Wenn dieses Muster bestätigt wird, zeichnet der Indikator ein Rechteck um die relevanten
ON Trade Pivoteer
Abdullah Alrai
4 (1)
Introducing the Pivot Point Selector Indicator: Your Ultimate Tool for Custom Pivot Levels Are you ready to take your trading to the next level? Say hello to the Pivot Point Selector Indicator, a game-changing tool that puts you in control of your pivot levels. This innovative indicator empowers you to choose three specific points that will determine the pivot level calculations, giving you unparalleled customization and precision in your trading strategy. Key Features and Benefits: Custom Pivo
FREE
Vorstellung des Goldgramm Preisrechner-Indikators Interessieren Sie sich dafür, den Goldpreis in Ihrer lokalen Währung stets im Blick zu behalten? Suchen Sie nicht weiter, denn der Goldgramm Preisrechner-Indikator bietet Ihnen ein innovatives Tool, mit dem Sie den Echtzeitpreis pro Gramm Gold in Ihrer bevorzugten lokalen Währung berechnen können. Mit diesem Indikator können Sie finanzielle Erkenntnisse nutzen, um informierte Entscheidungen zu treffen. Hauptmerkmale: Lokalisierter Goldpreis: Der
FREE
This indicator offers a comprehensive and efficient solution for traders seeking optimal entries in scalping strategies. Leveraging moving averages and stochastic indicators, it employs a systematic approach to identify favorable trade opportunities. The indicator goes beyond mere analysis, actively drawing clear and actionable entry points on your chart, denoted by arrows. Moreover, it provides the convenience of alerts to ensure you never miss these potential setups. Key Features and Benefits:
FREE
Dieser Indikator dient dazu, den Donchian-Kanal visuell auf Ihrem Handelschart darzustellen. Der Donchian-Kanal ist ein einfaches technisches Werkzeug, das den Bereich zwischen dem höchsten Hoch und dem niedrigsten Tief über einen bestimmten Zeitraum darstellt. Dieser Indikator verbessert die visuelle Analyse von Preisbewegungen und bietet Einblicke in potenzielle Ausbruchspunkte und die Fortsetzung von Trends. Der Donchian-Kanal kann sowohl auf den aktuellen Zeitrahmen als auch auf einen höhere
FREE
ON Trade Pivots is A technical indicator that Draws all Pivot levels depending on time frame that defined in settings. Notes It will be good tool for all traders who use pivot levels in their trades. Let me inform you that this indicator draw this level as buffers not as objects then you can connect it easily to EA. This indicator allow you to find pivots levels for any time frame not only daily you are free to choose time frame from settings. Parameters Use_System_Visuals - Enable /Disable
FREE
"Dieser Indikator ist ein einfaches Werkzeug zur Trenderkennung. Du kannst ihn zusammen mit deiner Strategie verwenden, um gute Einstiege zu erzielen, beispielsweise im Scalping-Modus. Er wird einen Kanal um den Preis herum zeichnen, der sich ausdehnt, wenn die Zeit zunimmt. In benutzerdefinierten Zeiträumen wird er zum Ausgangspunkt der Expansion zurückkehren, basierend auf einem Algorithmus, der Zeit und Preis gemeinsam berücksichtigt. Du kannst am unteren Rand des Kanals kaufen, nachdem Anzei
Rsi Channel
Abdullah Alrai
5 (1)
This indicator displays the channel of Relative Strength Index. When you see that the price touches the red line and retreats from it many times, then you will know that the general trend is down. When it retreats from the blue line many times, that means that the general trend is up. This lines express the RSI values attributed to the price values on the main chart. You can add this indicator to your strategy, it will help you. This indicator will work best on 5 minutes and higher time frames.
Regression Channel Tools" basiert. Durch die Nutzung dieses Tools können Trader eine außergewöhnliche Kontrolle über ihren Chart-Regression-Kanal erlangen und fundiertere Handelsentscheidungen treffen. Das Regression Channel Tool ist ein leistungsstarkes Instrument im Werkzeugkasten eines Traders. Es soll wertvolle Einblicke in Preisentwicklungen und potenzielle Unterstützungs- und Widerstandsniveaus bieten. Das Tool eignet sich besonders gut zur Visualisierung von Korrekturwellen innerhalb eine
"Wir präsentieren unseren leistungsstarken Forex-Indikator, der entwickelt wurde, um deine Handelsstrategie zu verbessern und präzise Einblicke in die Markttrends zu liefern. Dieses innovative Tool verwendet einen anspruchsvollen benutzerdefinierten Algorithmus, der sorgfältig die Messungen der Kerzen analysiert und Anpassungen vornimmt, um eine optimale Genauigkeit zu erzielen. Das Ergebnis? Ein Set von präzise platzierten Pfeilen auf deinem Chart, die strategische Einstiegspunkte anzeigen. Die
Shepherd Gann Squares
Abdullah Alrai
4.9 (10)
Bei diesem Indikator handelt es sich um eine Marktanalysemethode, die auf dem Artikel "Mathematische Formel für Marktprognosen" von W.D. Gann basiert, der auf Quadrat-von-Neun- und Quadrat-von-44-Methoden basiert. Benutzerhandbuch: Add Your review And contact us to get it Sie können die vollständige MT5-Version kaufen von: https://www.mql5.com/en/market/product/28669 Sie können auf MT4 kostenlos testen: https://www.mql5.com/en/market/product/15320?source=Site +Profile+Seller#!tab=re
Der Indikator wurde entwickelt, um Diamant-Gann-Wellen zu erkennen und zu visualisieren, ein spezifisches Muster, das aus der Gann-Theorie abgeleitet ist. Er liefert Tradern Einblicke in potenzielle Marktumkehrungen, indem er Punkte (P) auf Grundlage der ABC-Punkte des Musters zeichnet. Zusätzlich zeichnet der Indikator vertikale Linien von den vorhergesagten Punkten (P), um Tradern dabei zu helfen, potenzielle Umkehrpunkte leichter zu identifizieren. Indikator-Funktionen: Use_System_Visuals: Di
"Dieser Indikator erkennt Einträge basierend auf der Bystra-Muster-Theorie und liefert Einstiegswerte zur Platzierung von Limit-Orders mit Ziel- und Stopp-Levels. Dies ermöglicht es Ihnen, Ihr Risikoprozentsatz zu berechnen. Anmerkungen: Dieser Indikator verfügt über Puffer, die seine Verwendung in Expert Advisors (EAs) ermöglichen. Es ist wichtig, beim Arbeiten mit diesem Produkt eine gute Geldverwaltung zu praktizieren. Wenn Sie Ihren Zeitrahmen ändern, wird der Indikator die in Ihrer letzten
Der "Fibo Star" Indikator wurde entwickelt, um Fibonacci-Fächer in Form von Sternen auf Ihrem Handelschart darzustellen. Diese Fibonacci-Fächer sind ein leistungsstarkes Werkzeug zur Analyse von Preisbewegungen und können Einblicke in potenzielle Unterstützungs- und Widerstandsniveaus bieten. Dieser Indikator verfügt über ein benutzerfreundliches Steuerungspanel, das darauf abzielt, den Zeichnungs- und Konfigurationsprozess der Fächer zu vereinfachen und somit Zeit und Aufwand zu sparen. Anleitu
Der "Währungsstärke-Indikator" ist ein leistungsstarkes Werkzeug, das entwickelt wurde, um den Händlern Informationen über die relative Stärke verschiedener Währungen auf dem Devisenmarkt zu liefern. Durch Berechnung und Darstellung der Stärke jeder Währung basierend auf ihrem jeweiligen Zeitrahmen bietet dieser Indikator den Händlern die Möglichkeit, potenzielle Handelsmöglichkeiten zu identifizieren, insbesondere wenn signifikante Divergenzen oder Kreuzungen beobachtet werden. Hauptmerkmale de
Der Gann Square Indikator ist ein leistungsstolles Marktanalyse-Tool, das auf dem Artikel "Mathematische Formel für Marktvorhersagen" von W.D. Gann basiert. Dieses Tool verwendet mathematische Konzepte und Gann-Theorien für eine präzise Marktanalyse. Es beinhaltet Quadratwerte von 144, 90, 52 und auch das Quadrat von 9. Darüber hinaus integriert es die Methode von  zur Quadratwurzel von 9 und deren Beziehung zu Kanälen und dem Sternmuster. Benutzerhandbuch und Anwendung: Vor der Verwendung diese
Dieser Indikator erkennt harmonische Muster, die manuell und automatisch auf dem Chart gezeichnet werden. Bitte geben Sie Ihre eigene Bewertung ab. Hinweise: Der Indikator verfügt über ein Steuerungsfeld und speichert alle (Chart & Zeitrahmen) Einstellungen. Sie können es minimieren, um mehr Platz auf dem Chart zu haben, und Sie können die Schaltfläche "Schließen" drücken, um alle Indikatordaten auf dem Chart auszublenden, wenn Sie lieber mit anderen Analysewerkzeugen arbeiten. Wenn Sie diesen I
Technischer Indikator zur Erkennung starker Preisaktionsmuster: Pin Bar, Inside Bar und Outside Bar Einführung: Im Bereich der technischen Analyse dienen Preisaktionsmuster als wichtige Indikatoren für potenzielle Markt­bewegungen. Wir haben einen anspruchsvollen technischen Indikator entwickelt, der die Identifizierung robuster Preisaktionsmuster auf Charts vereinfacht. Unser Indikator spezialisiert sich auf die Erkennung von drei wesentlichen Mustern: Pin Bar, Inside Bar und Outside Bar. Schlü
Numerologie-basierter Unterstützungs- und Widerstandsanzeiger für MetaTrader Einführung: Eröffnen Sie eine neue Dimension der technischen Analyse mit unserem Numerologie-basierten Unterstützungs- und Widerstandsanzeiger für MetaTrader. Dieses einzigartige Tool nutzt die Kraft der Numerologie, um Schlüsselunterstützungs- und Widerstandsniveaus auf Ihren Charts zu identifizieren und Ihnen wertvolle Einblicke in potenzielle Preisbewegungen zu geben. Hauptkonzepte: Numerologie im Handel: Numerologi
Unlock Hidden Insights with the Numerokh Indicator: Your Numerology-Based Support and Resistance Tool Introducing the Numerokh indicator, a revolutionary tool that brings the mystical world of numerology into the realm of trading. Imagine having the power to identify key support and resistance levels on your charts using the age-old wisdom of numerology. This indicator takes trading to a new dimension, offering you a unique way to analyze price movements and make informed trading decisions. Key
Vorstellung des ON Trade Numerology Mirror Indikators: Enthüllung versteckter Umkehrmuster durch Numerologie Erkunden Sie eine neue Dimension in der technischen Analyse mit dem ON Trade Numerology Mirror Indikator. Dieses innovative Tool nutzt das alte Wissen der Numerologie, um Schlüsselumkehrniveaus in Ihren Charts zu identifizieren. Durch die Umkehrung von Zahlen in gespiegelte Positionen enthüllt dieser Indikator versteckte Muster, die das Potenzial haben, wichtige Preisumkehrungen anzuzeige
Auswahl:
Corrado Bruni
415
Corrado Bruni 2024.05.13 11:22 
 

Der Benutzer hat keinen Kommentar hinterlassen

Lahcen drihem
19
Lahcen drihem 2024.05.10 19:20 
 

Der Benutzer hat keinen Kommentar hinterlassen

Antwort auf eine Rezension