V Pattern Scanner MT4
- Indikatoren
- Elif Kaya
- Version: 1.0
- Aktivierungen: 20
Introduction
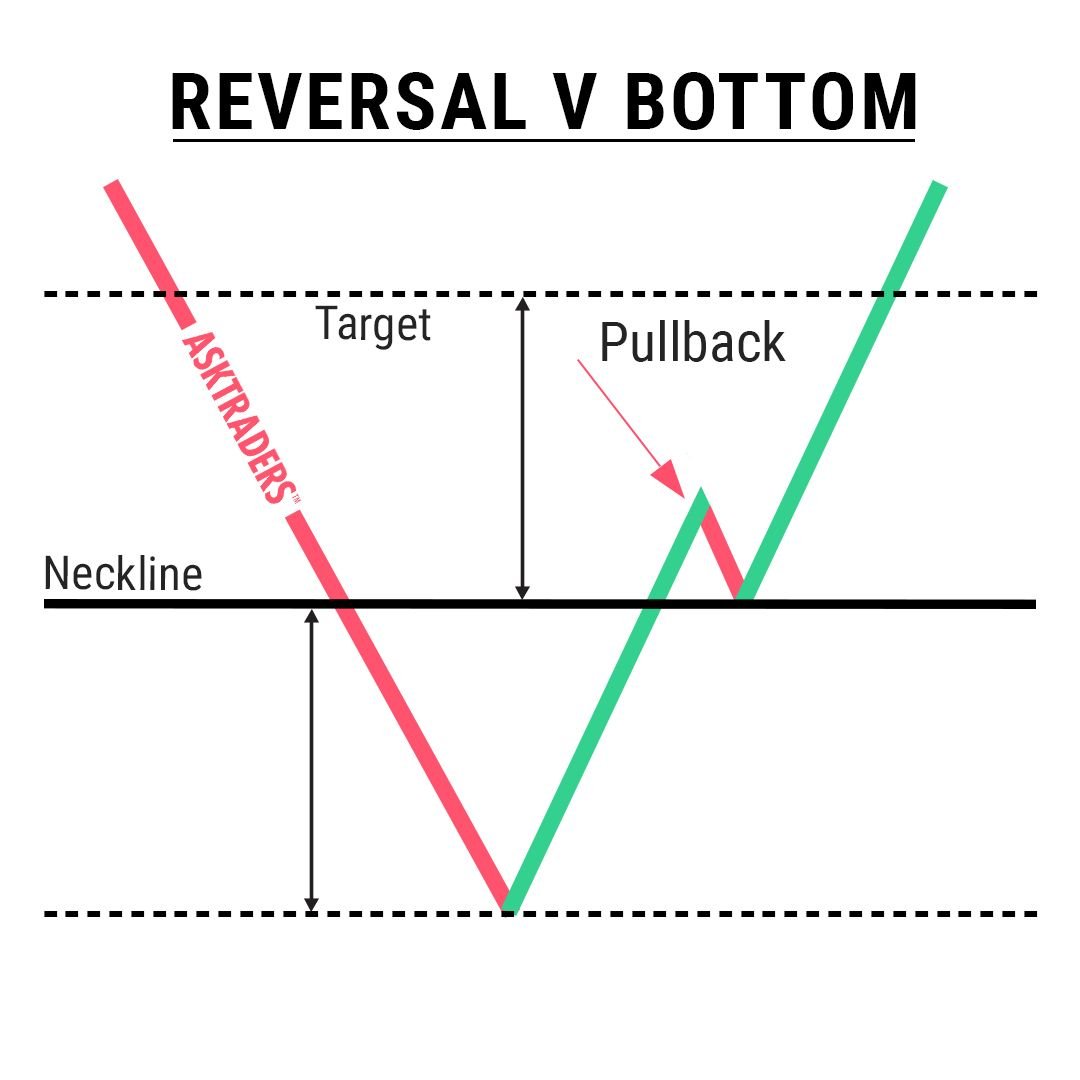
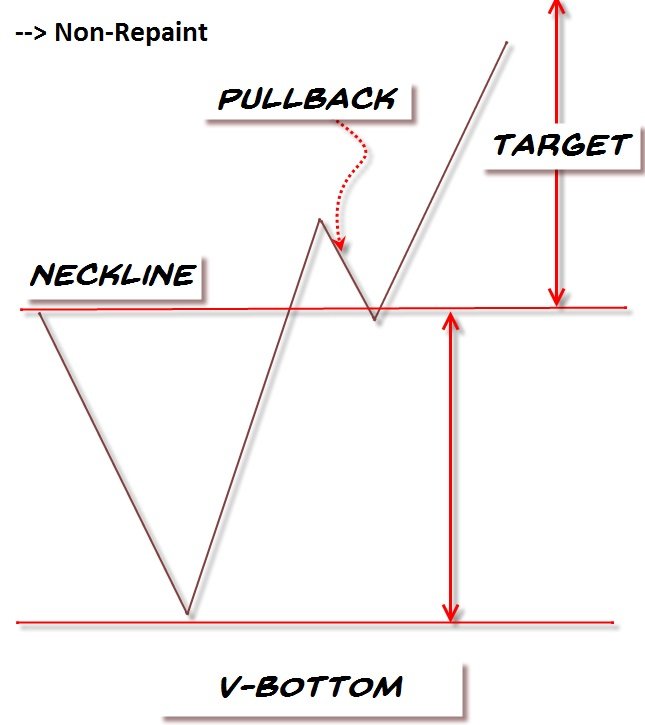
V Bottoms and Tops are popular chart patterns among traders due to their potential for identifying trend reversals. These patterns are characterized by sharp and sudden price movements, creating a V-shaped or inverted V-shaped formation on the chart. By recognizing these patterns, traders can anticipate potential shifts in market direction and position themselves accordingly. V pattern is a powerful bullish/bearish reversal pattern and appears in all markets and time-frames.
V Pattern Scanner Indicator
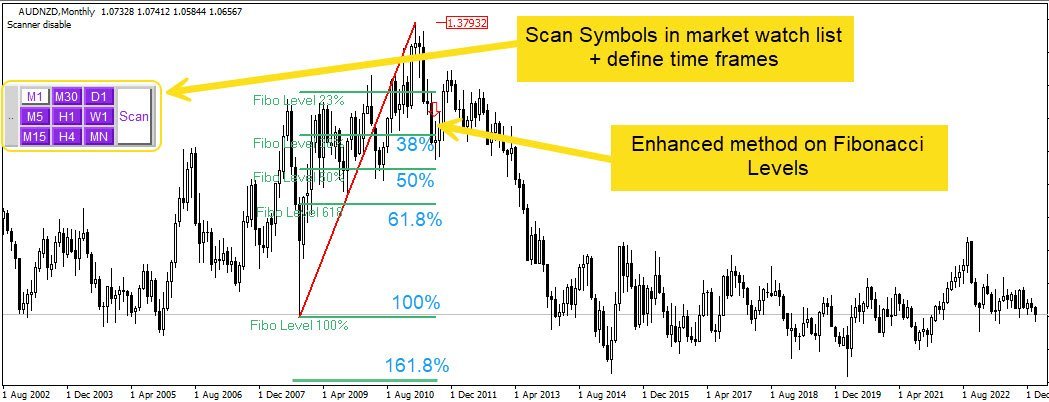
V-shaped bottoms and tops can be challenging to trade because of their sharp and sudden movement, making it difficult to identify a clear breakout point, as well as searching for dozens of charts and time frames will take time. This indicator can automatically search all charts and time frames to find possible patterns in one chart.
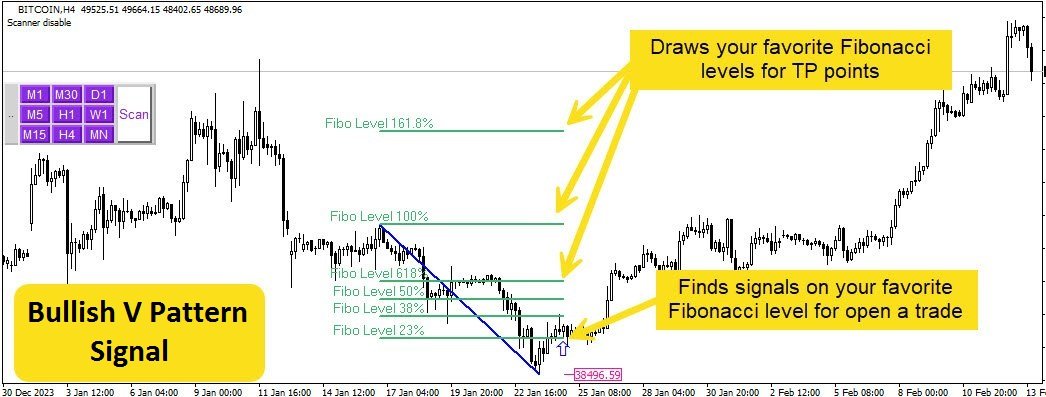
Searching, Fibonacci calculations and pattern recognition are completely the responsibility of the indicator; All you have to do is "press the scan button".
How To Trade?
All parameters necessary to enter the trade are calculated, such as entry point, stop-loss, and take-profit.
By observing the signal and deciding to trade, we enter the trade with the "set and forget" method.


Another good scanner by developer.