Supply Demand Basic
- Indikatoren
- Krzysztof Janusz Stankiewic
- Version: 1.0
- Aktivierungen: 5
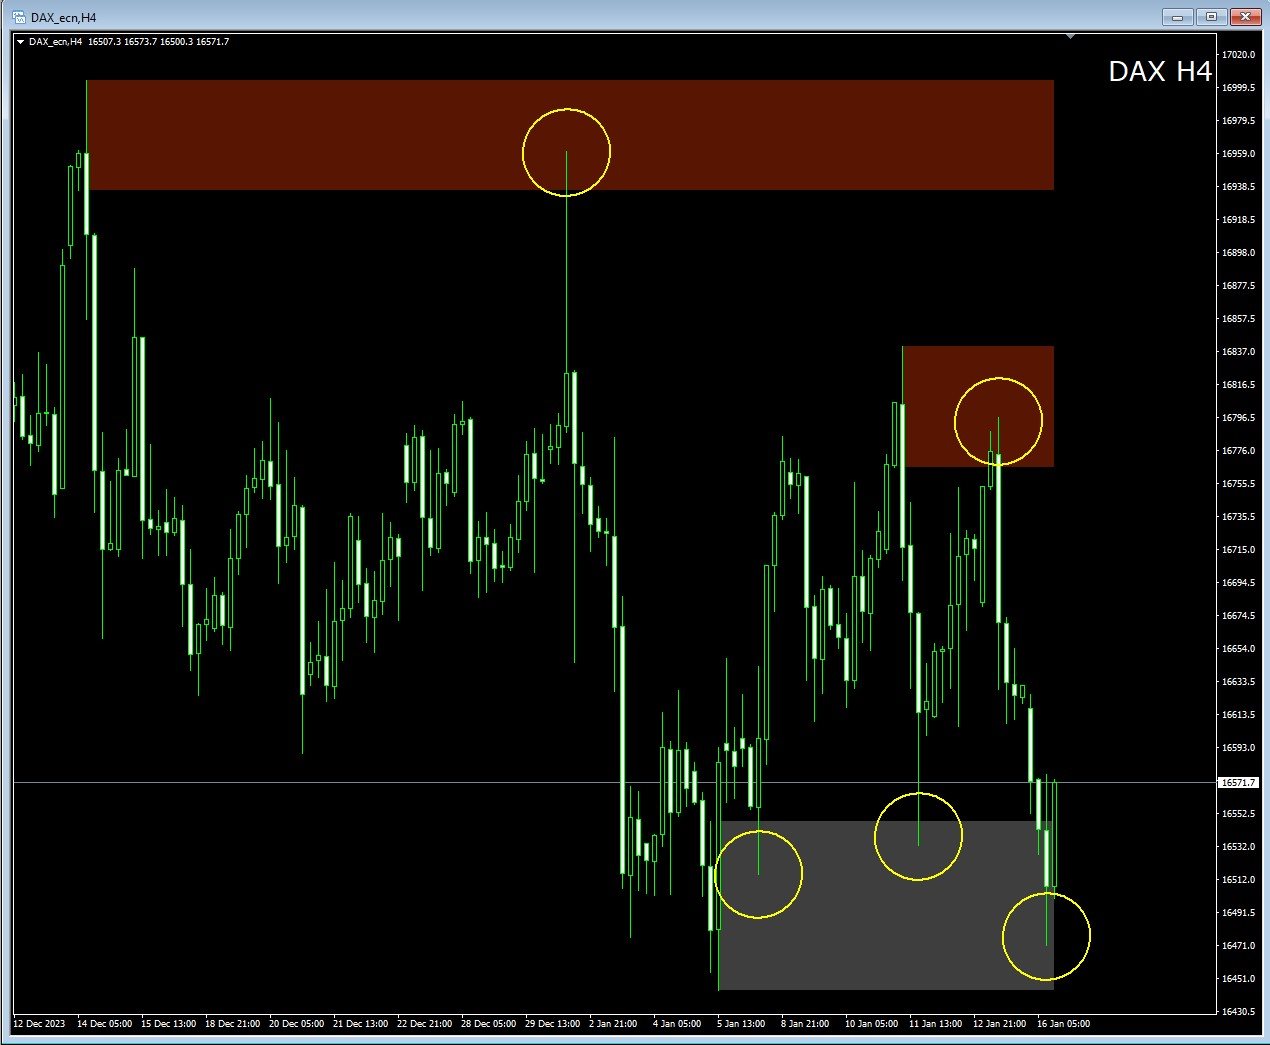
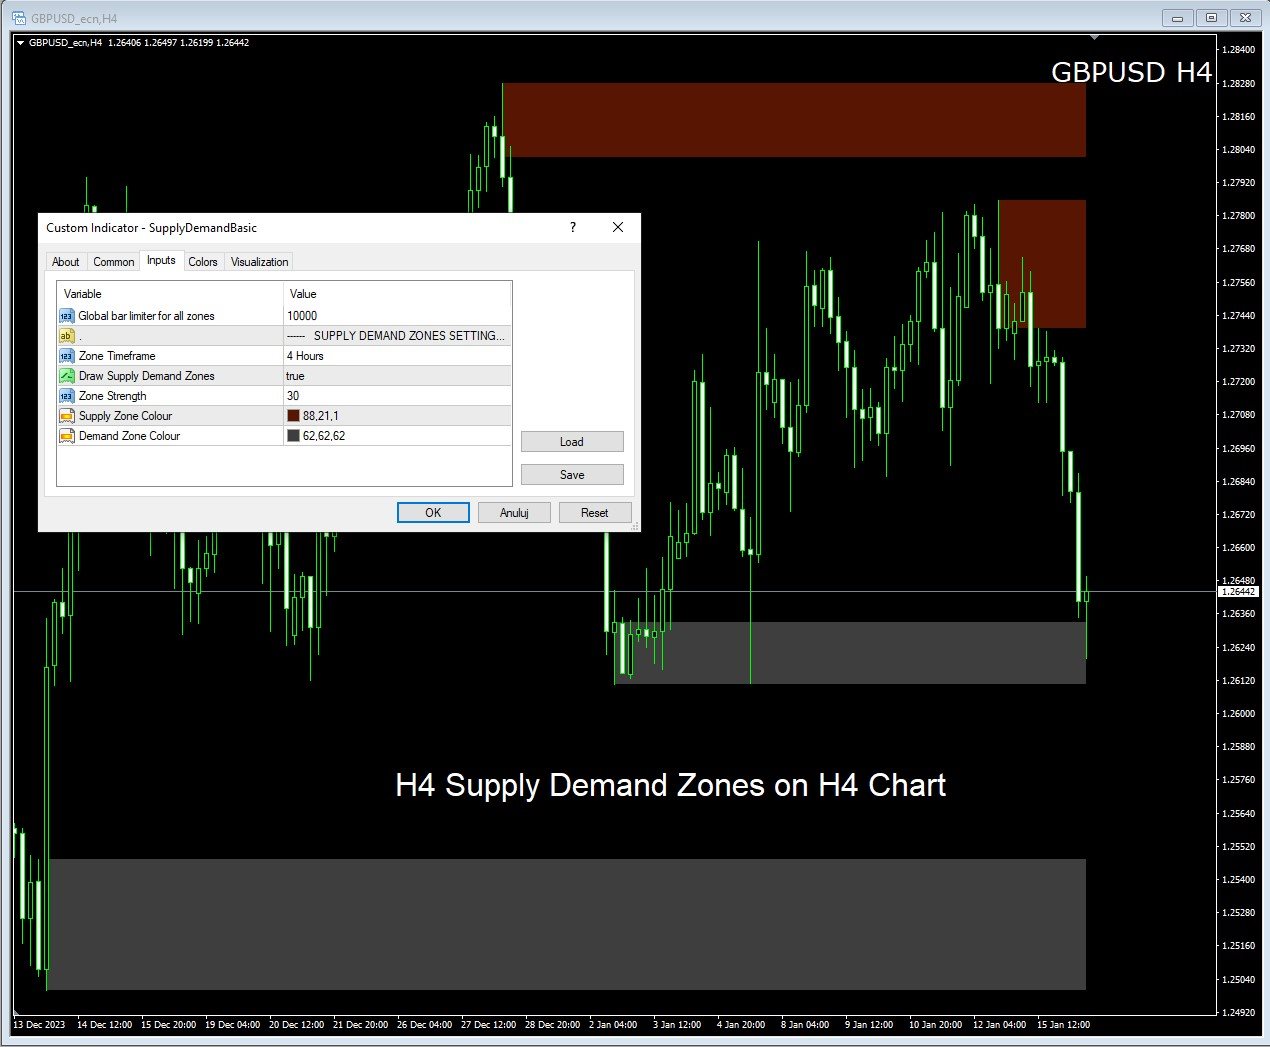
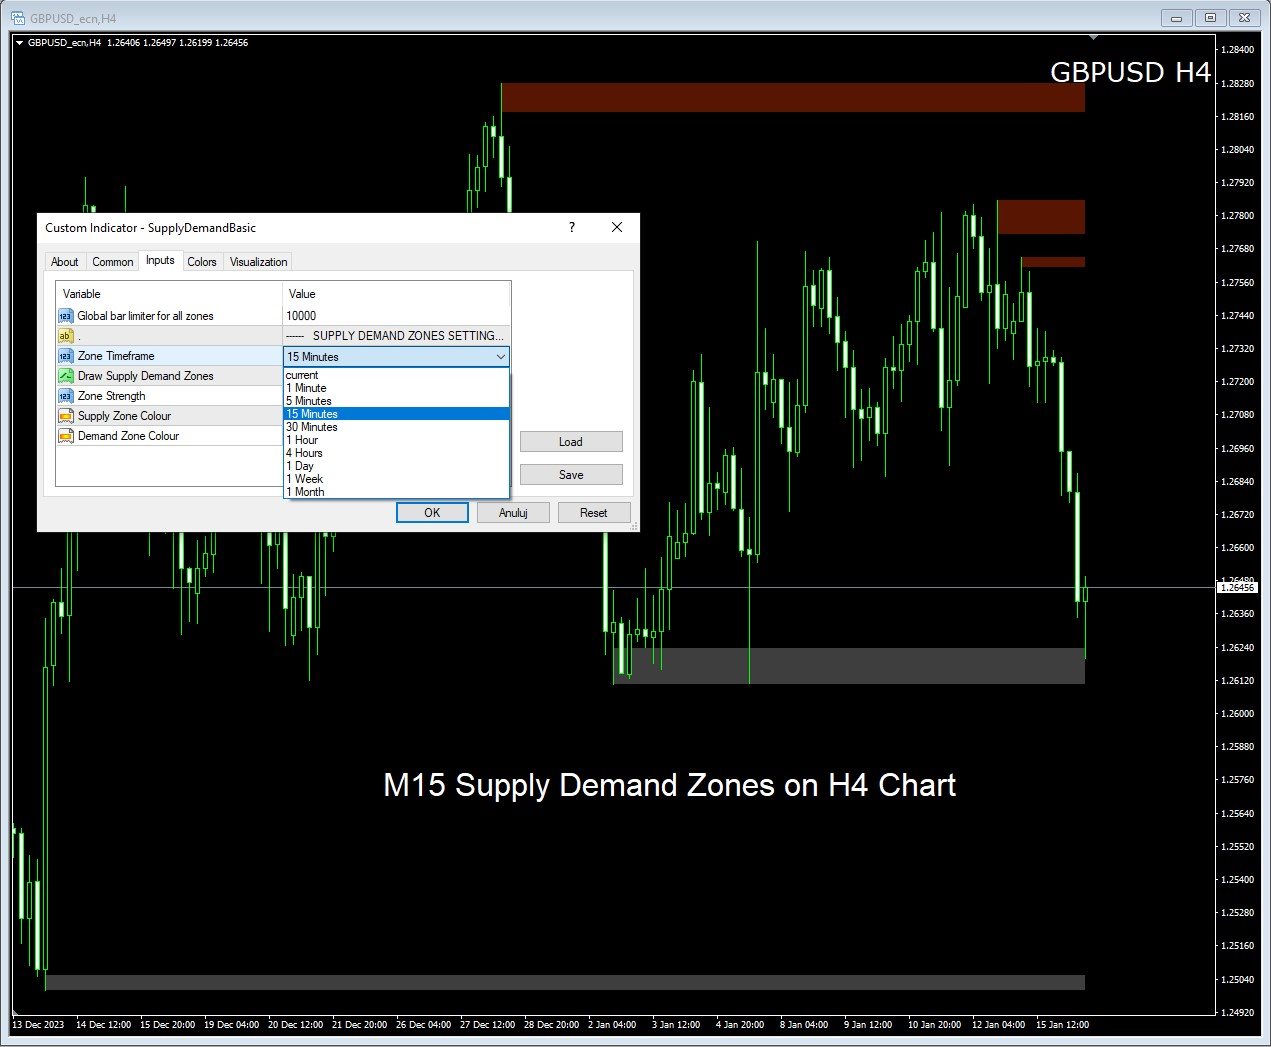
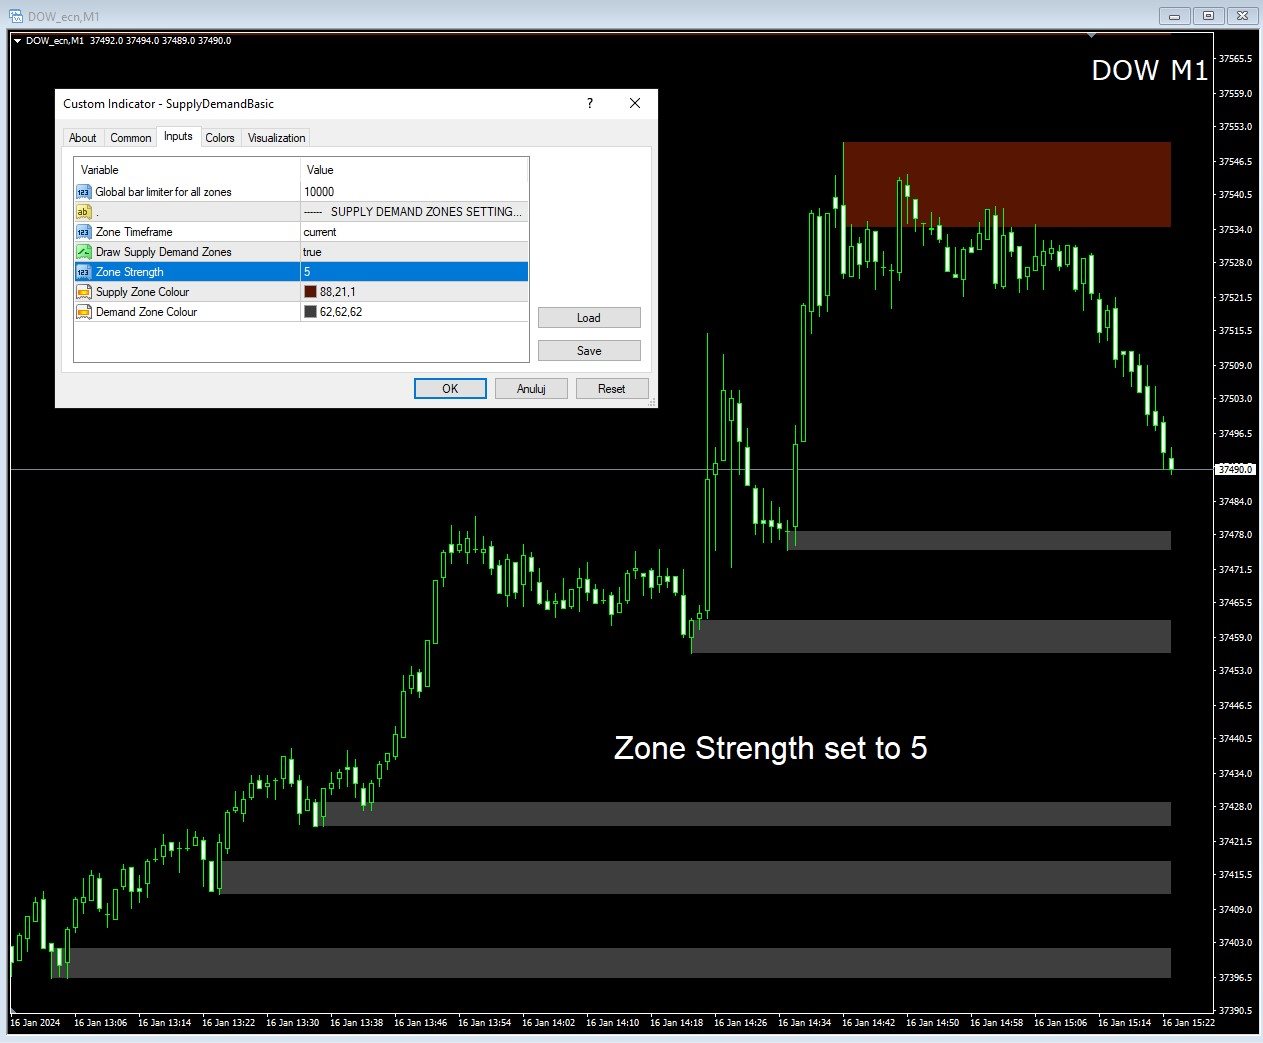
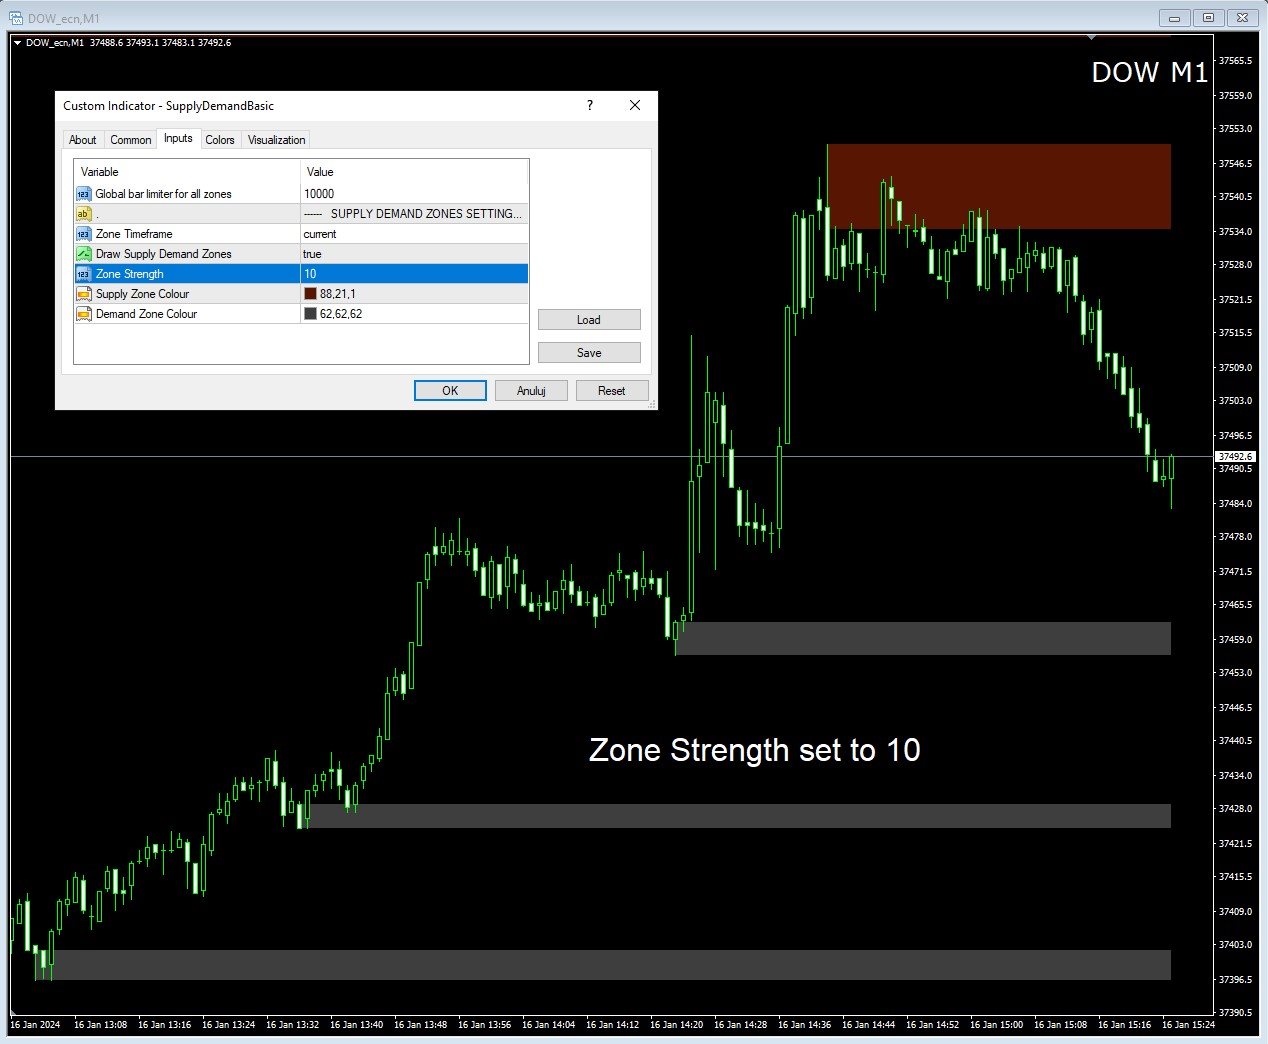
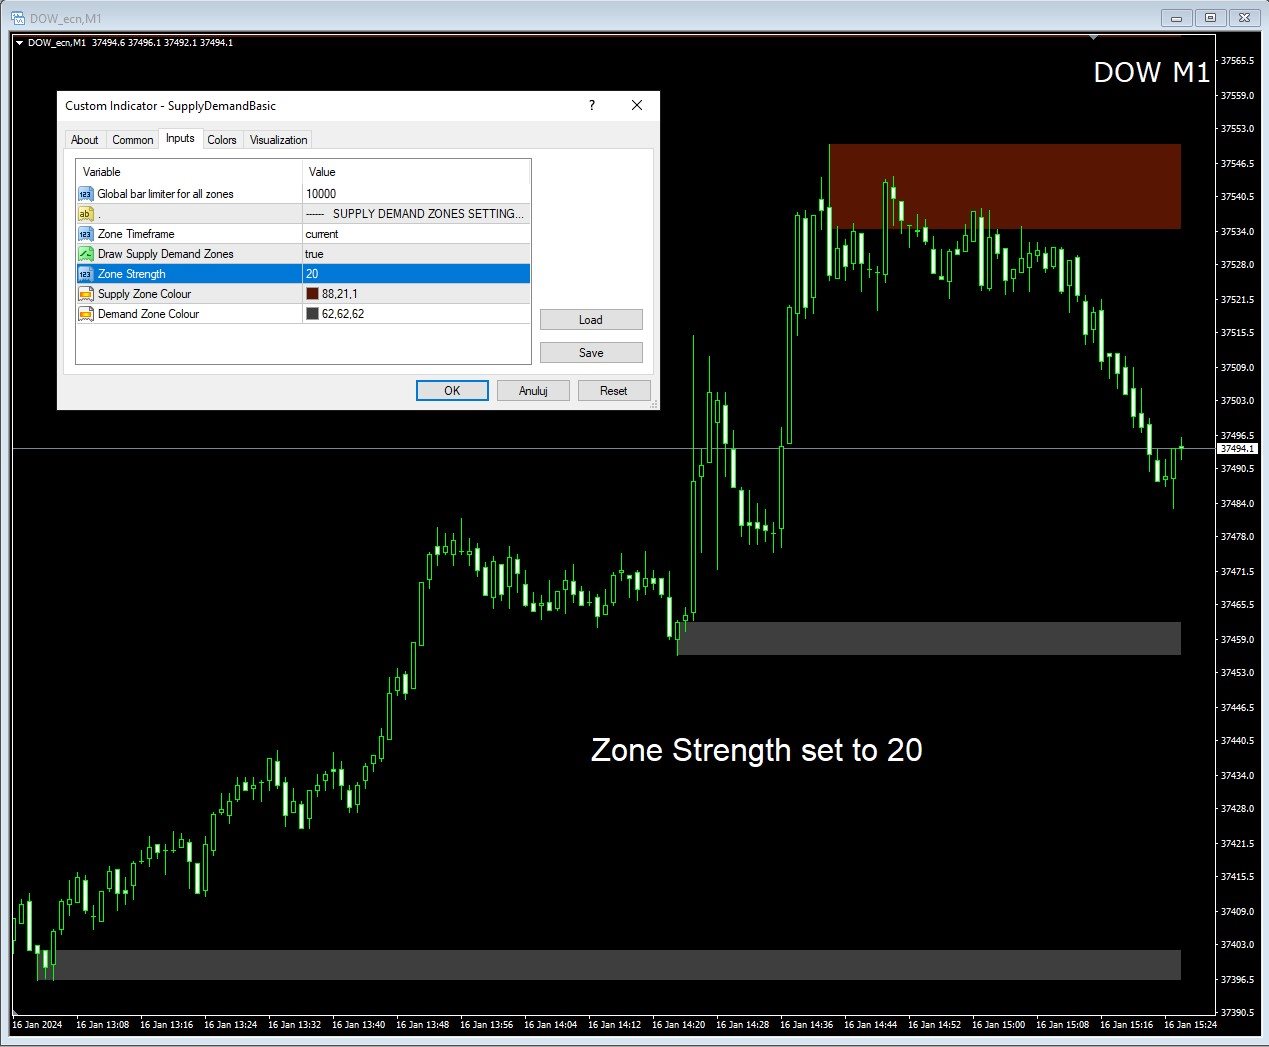
The indicator draws supply and demand zones. The zone timeframe can be set independently of the chart timeframe. For instance, it is possible to set M5 zones on an H4 chart. The importance of zones can be adjusted using the zone strength parameter. Demand zones are displayed if at least one candle in the range of the zone is entirely above the zone. Similarly, supply zones are displayed if at least one candle within the zone is entirely below the zone.