ArwByIdx MT5
- Indikatoren
- Sajiro- Yoshizaki
- Version: 2.14
- Aktualisiert: 3 Mai 2024
Dieses Produkt empfängt Informationen von Indikatoren/Signaltools und zeigt Pfeile oder Benachrichtigungen an, wenn bestimmte Bedingungen erfüllt sind.
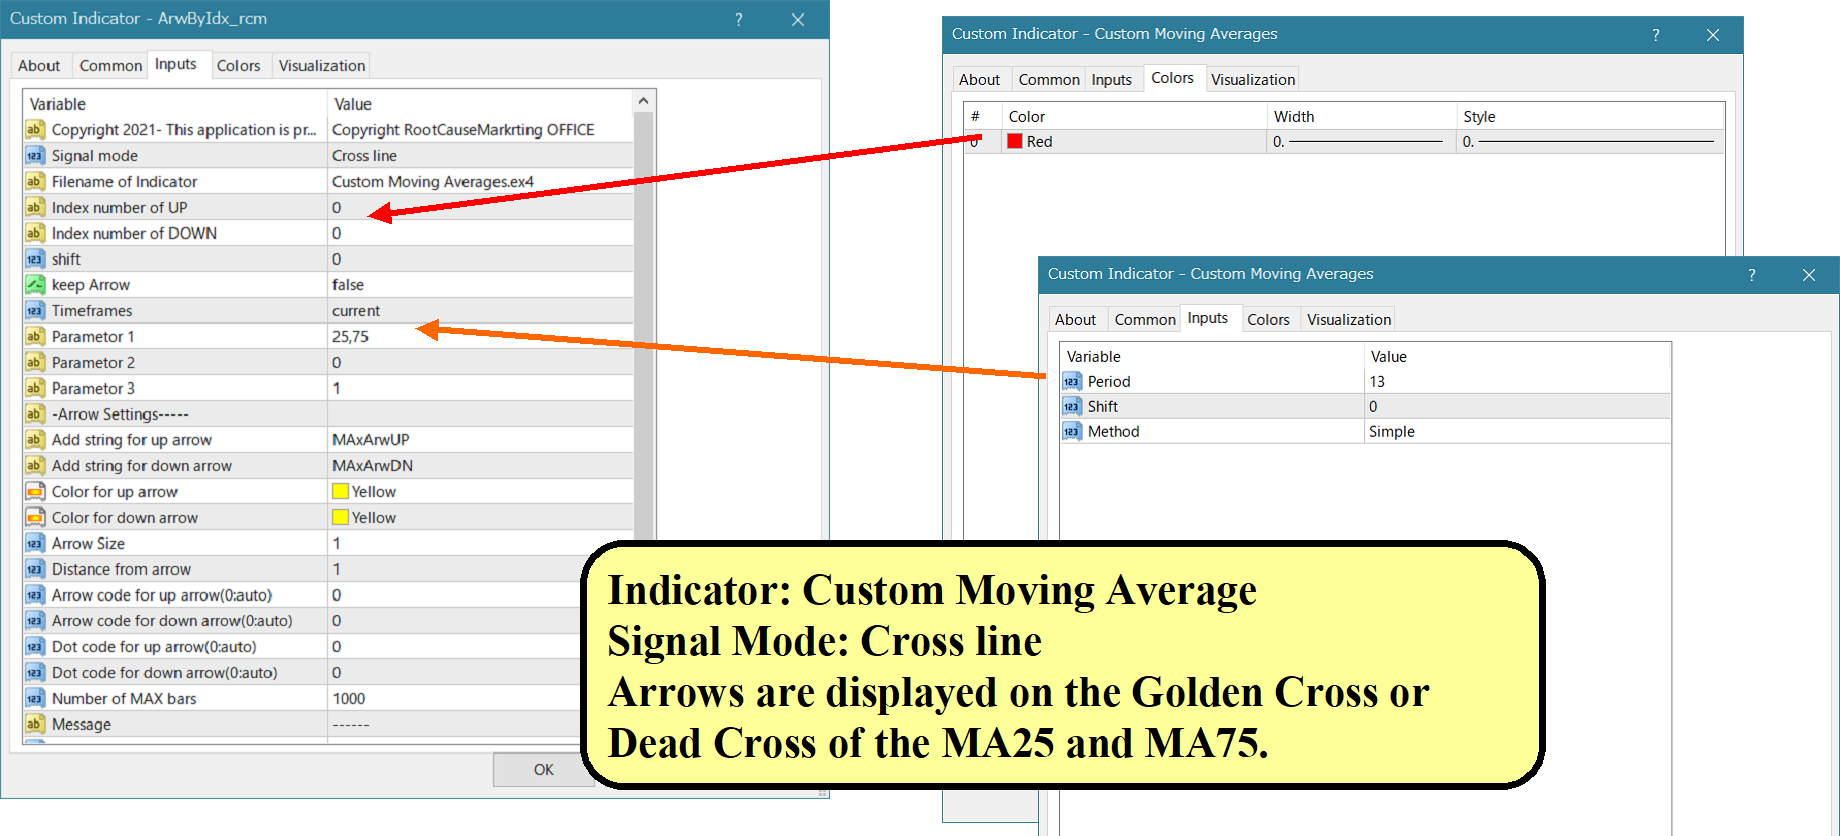
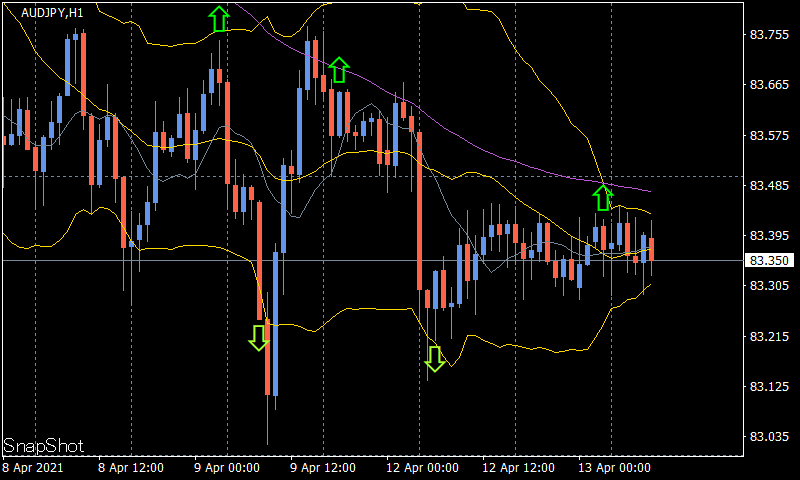
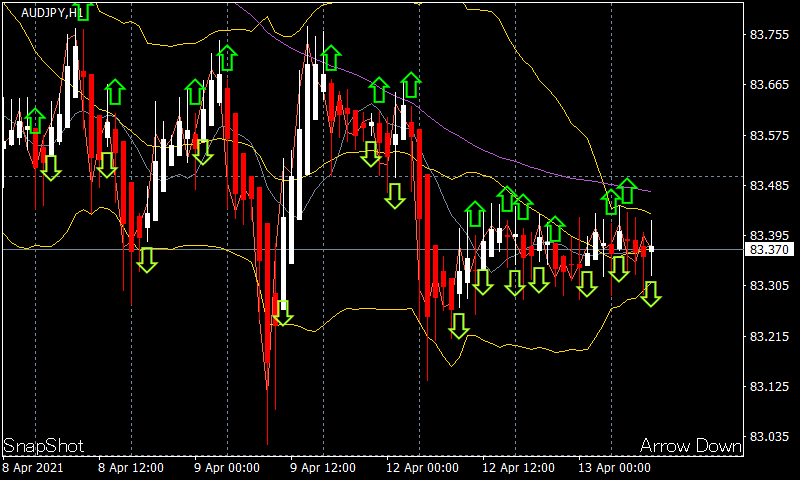
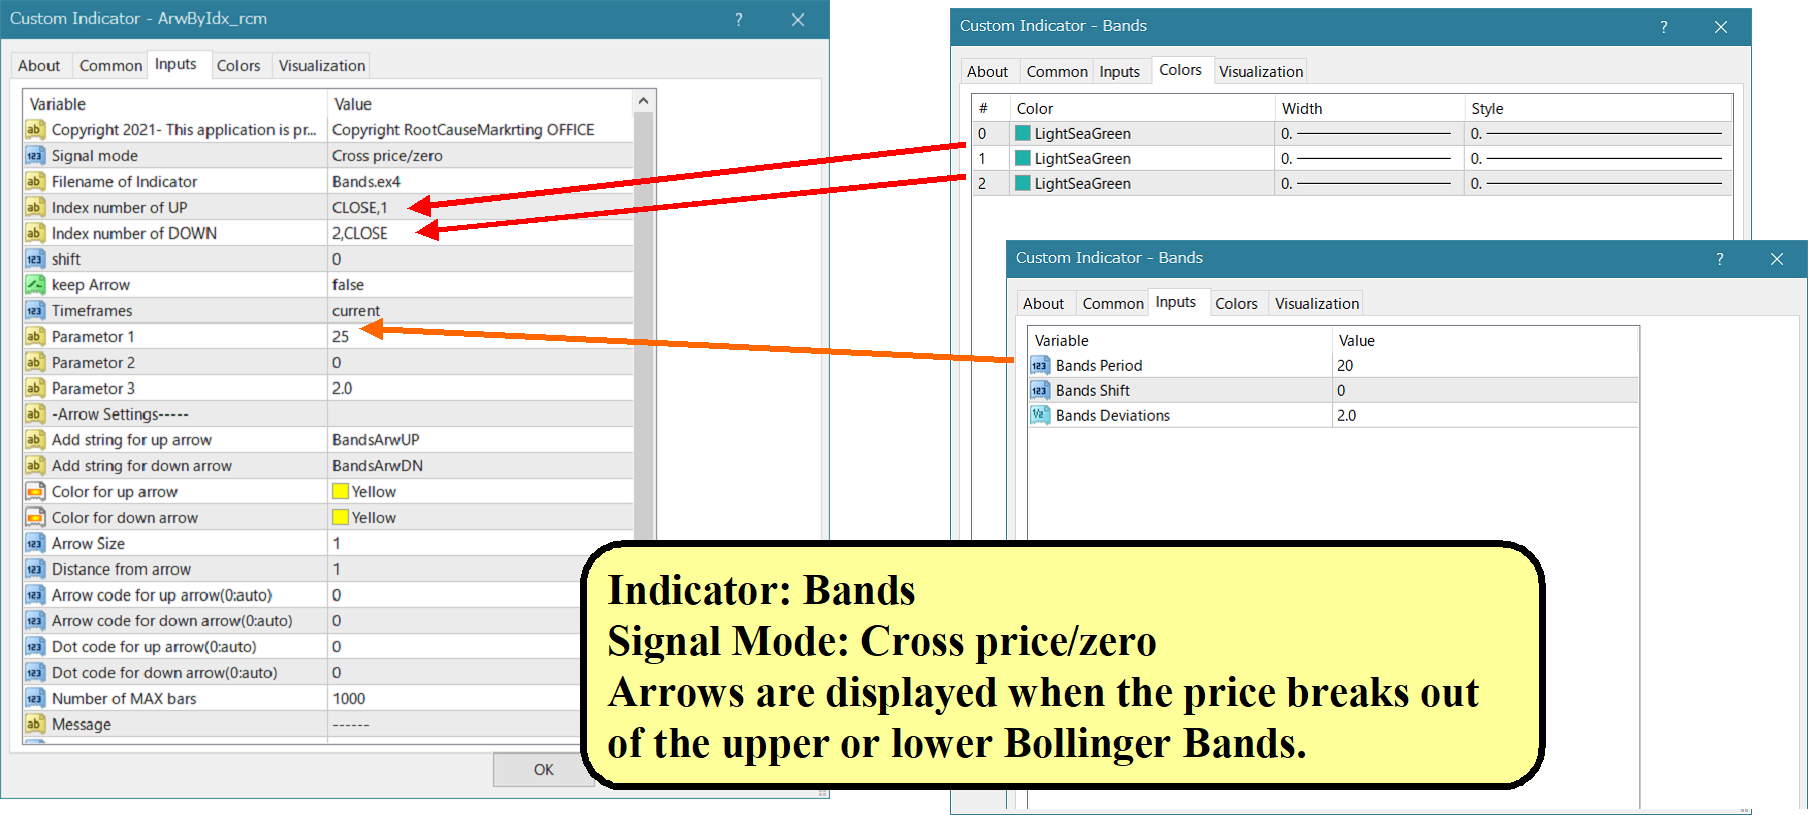
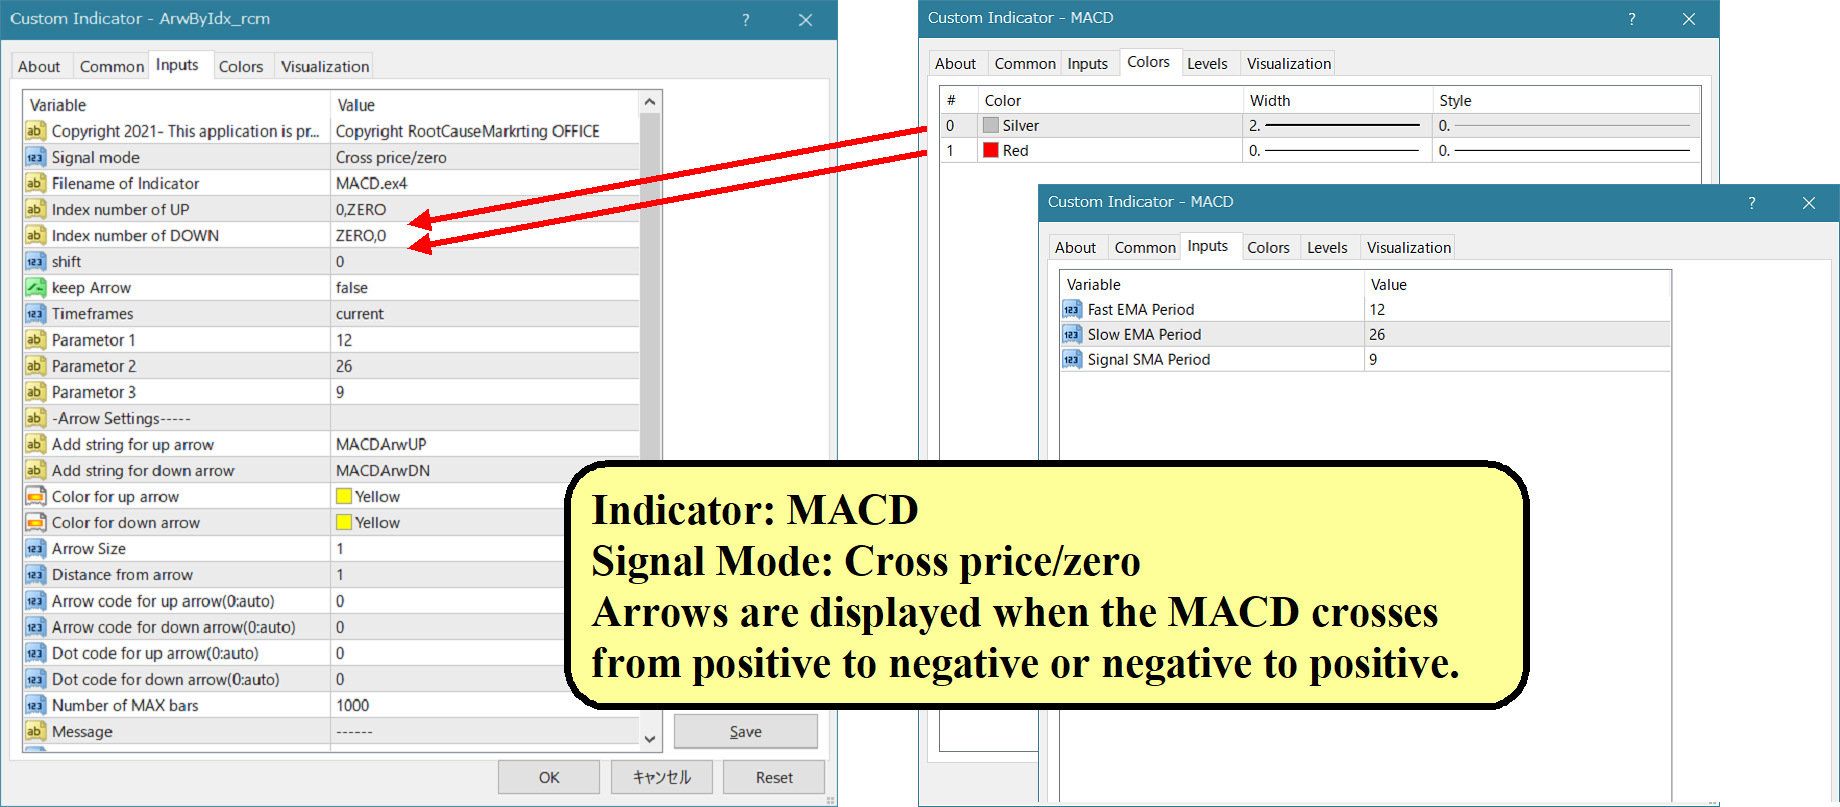
Zum Beispiel werden Pfeile und Benachrichtigungen angezeigt, wenn MA25 und MA50 sich kreuzen, wenn SAR umkehrt, wenn MACD sein Plus/Minus ändert oder wenn der Schlusskurs die Bollinger-Bänder kreuzt. Bitte beachten Sie das Beispielbild mit den Einstellungen für bestimmte Konfigurationen.
Detaillierte Handbücher und Konfigurationsdateien finden Sie unter:
https://www.mql5.com/en/blogs/post/755082
Eine kostenlose Version steht ebenfalls zum Download bereit. Die Pfeile können in verschiedenen Konfigurationen angezeigt werden und die Kombinationen sind so grenzenlos wie Ihre Vorstellungskraft.
Wenn Sie Probleme beim Einrichten der Verknüpfung mit Signaltools und Indikatoren haben, wenden Sie sich bitte an uns, um Hilfe zu erhalten.
Wir können auch Push-Benachrichtigungen an Smartphones, E-Mail, Slack, Line, Discord usw. senden, bis zu 8 Parameter hinzufügen oder auf Anfrage individuell mit Indikatoren verknüpfen.
Sie können es als Ergänzung zu Ihren Signaltools oder als Benachrichtigungsfunktion für Ereignisse verwenden.