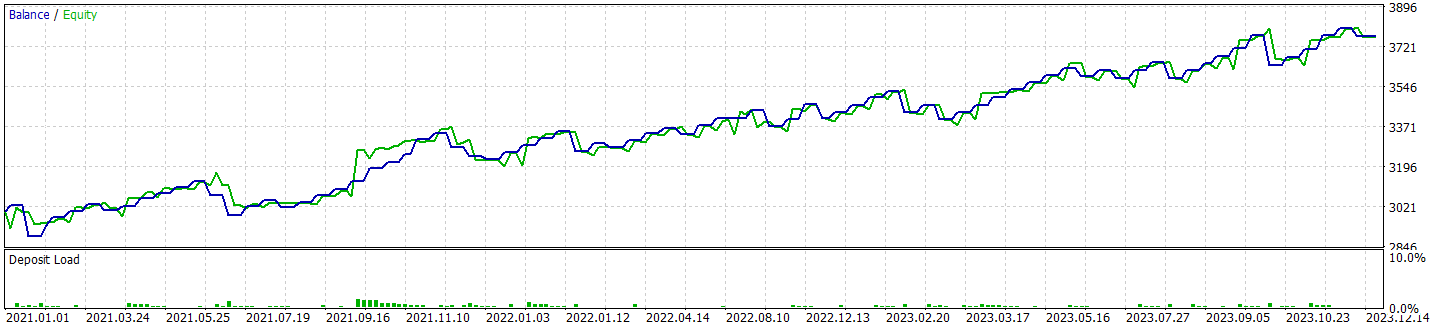
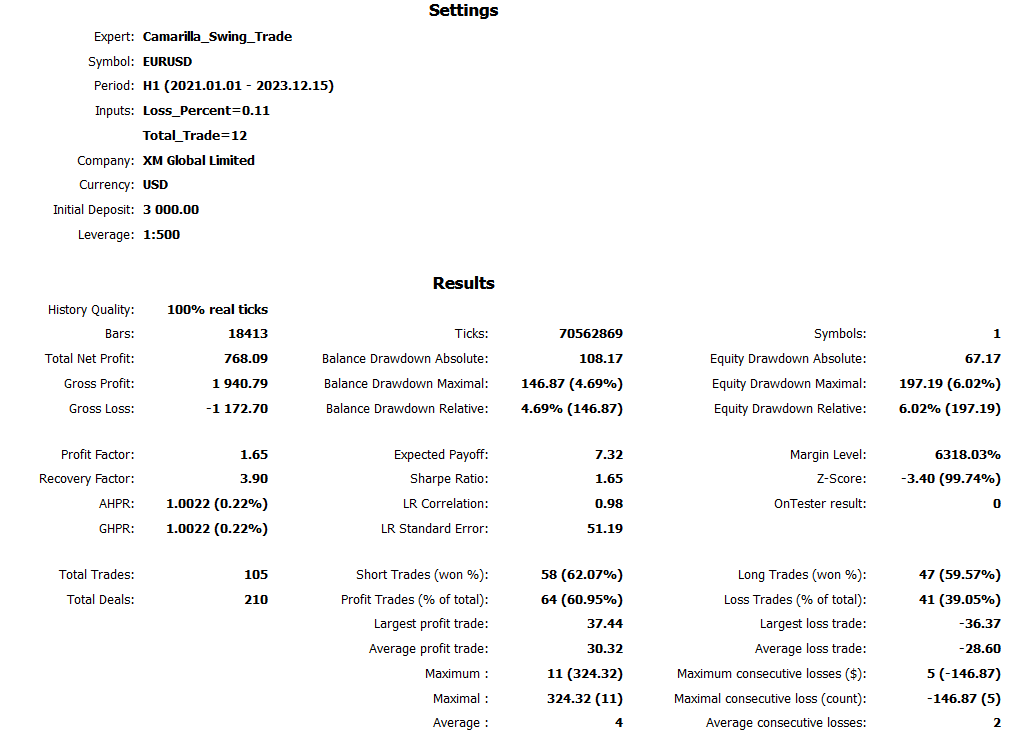
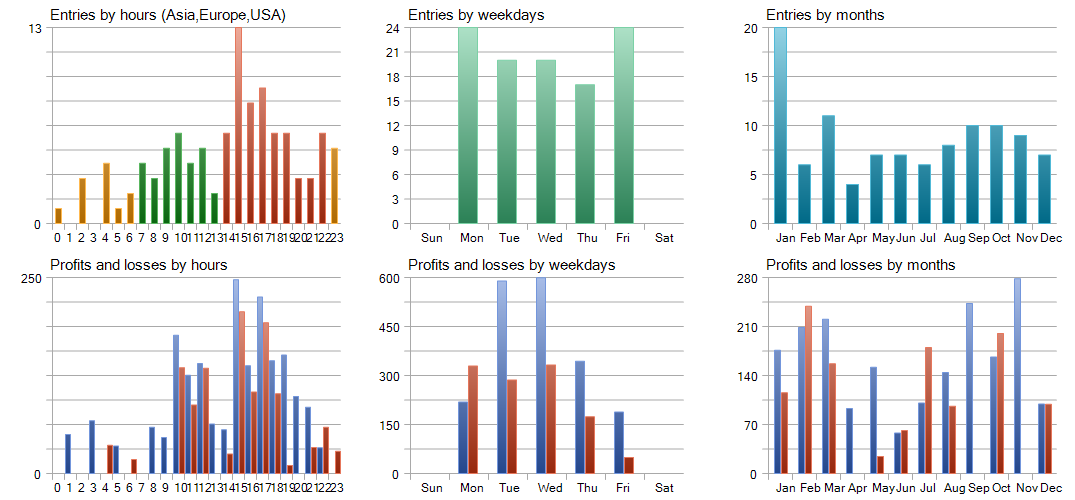
Camarilla Swing Trade Indicator
- Indikatoren
- Chayakorn Rakwongthai
- Version: 1.0
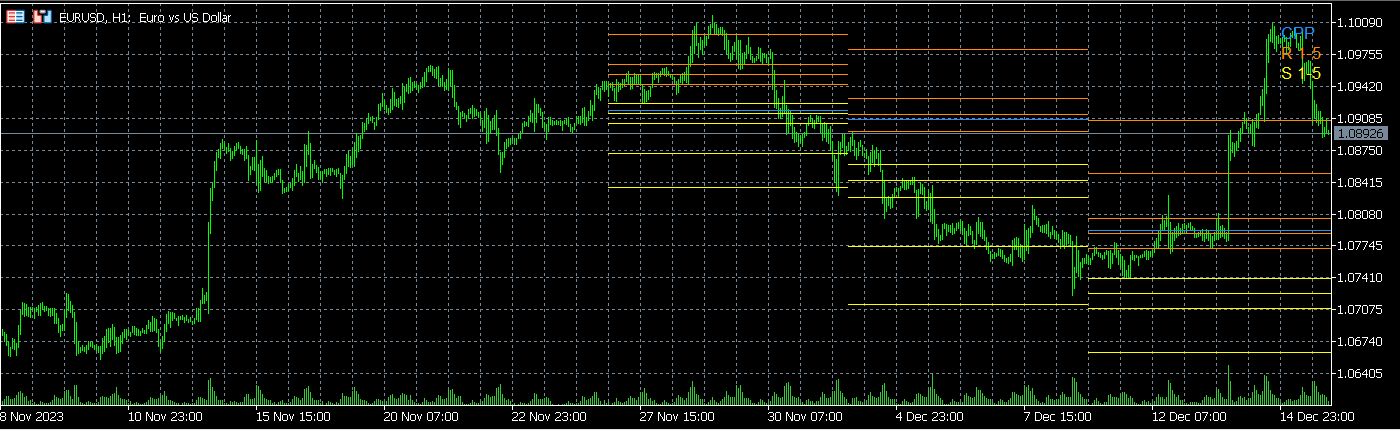
Camarilla Swing Trade Indicator is an Indicator. Support and resistance points are calculated from the High Low Close of the previous TF Week's price.
What are Camarilla Pivot Points?
1.Camarilla Pivot Points is a modified version of the classic Pivot Point.
2.Camarilla Pivot Points was launched in 1989 by Nick Scott, a successful bond trader.
3.The basic idea behind Camarilla Pivot Points is that price tends to revert to its mean until it doesn't.
4.Camarilla Pivot Points is a mathematical price action analysis tool that creates possible intraday support and resistance levels.
Camarilla Pivot Points are a set of eleven levels that resemble support and resistance values for a current trend.
CPP - Camarilla Pivot Points
Support 1-5
Resistance 1-5
Camarilla Swing Trade Strategy
Buy Entry
1. The opening price of the Week candlestick is greater than CPP.
2. Identify the buying advantage when CPP is less than Support Line 2.
3. When the price breaks the support line between the 2nd and 4th support lines, then the price reverses and rises above the said support line.
4. Set SL at points S5 and TP equal to the distance between the entry point and the SL point.
Sell Entry
1. The opening price of the Week candlestick is less than CPP.
2. Identify the advantage in purchasing when CPP is greater than Resistance line 2.
3. When the price breaks the resistance line between the 2nd and 4th resistance lines, then the price has reversed down to stand below the said resistance line.
4. Set SL at points R5 and TP equal to the distance between the entry point and the SL point.
Input
Total_CM = Total Camarilla Pivot Points on Chart
Example Total_CM = 3 Chart Will show current Camarilla Pivot Points and Previous two Camarilla Pivot Points on Chart
CM_Period = TF Period to calculate Camarilla Pivot Points Normally have to use TF Week or Month

good indicator but ( Total_CM = Total Camarilla Pivot Points on Chart ) isn't found in settings