• Übersicht
  • Bewertungen
  • Diskussion
  • Neue Funktionen

MTF Precise Price Action Arrow Filtered Model S

Introducing the advanced trading tools of 2023.

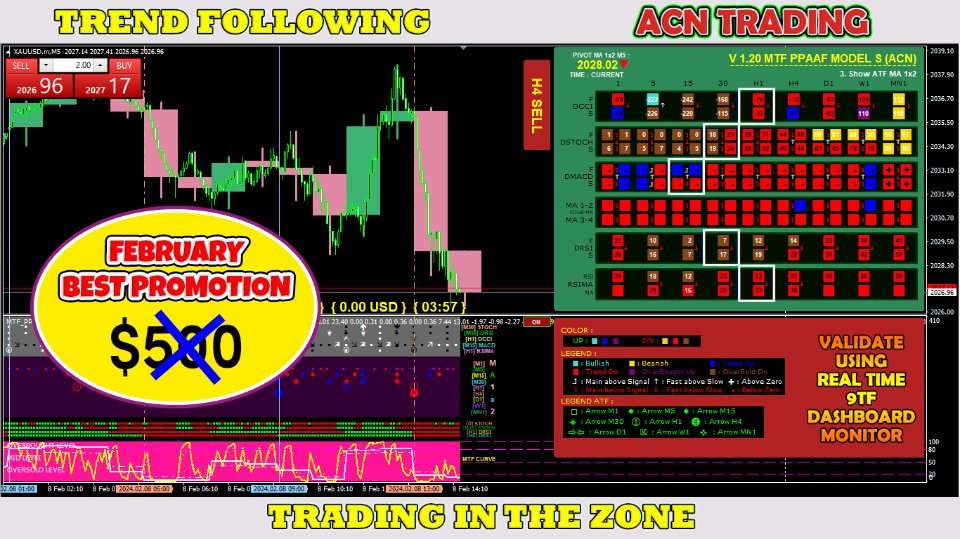
MTF PPAAF Model S.

This is sub window version of my best trading tool : MTF Precise Price Action Arrow Filtered. 

Click here to learn more about MTF PPAAF.

This trading tool is equipped with various powerful features :

  1. MTF = Multi Time Frame = Time Frame can be changed.
  2. On/off button.
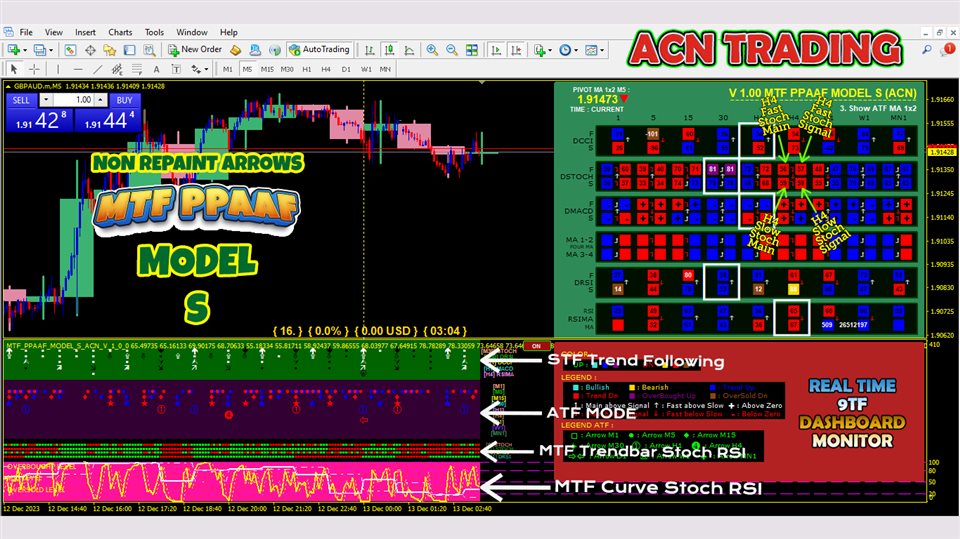
  3. Non Repaint Arrows. 
  4. Customizable parameter, color etc. 
  5. Can show all time frame (ATF) crossover arrows of fast stochastic main line & fast stochastic signal line (mode number 1).
  6. Can show all time frame (ATF) crossover arrows of fast macd main line & fast macd signal line (mode number 2).
  7. Can show all time frame (ATF) crossover arrows of moving average 1 & moving average 2 line (mode number 3).
  8. Can show all time frame (ATF) crossover arrows of fast RSI & slow RSI line (mode number 4).
  9. Can show all time frame (ATF) crossover arrows of RSI and MA (mode number 5).
  10. Can show all time frame (ATF) crossover arrows of fast CCI and slow CCI (mode number 6).
  11. Can show selected time frame (STF) trend following arrow of fast stochastic main line x fast stochastic signal line.
  12. Can show selected time frame (STF) trend following arrow of fast RSI line x slow RSI line.
  13. Can show selected time frame (STF) trend following arrow of fast CCI line x slow CCI line.
  14. Can show selected time frame (STF) trend following arrow of fast macd main line x fast macd signal line.
  15. Can show selected time frame (STF) trend following arrow of RSI line x MA line.
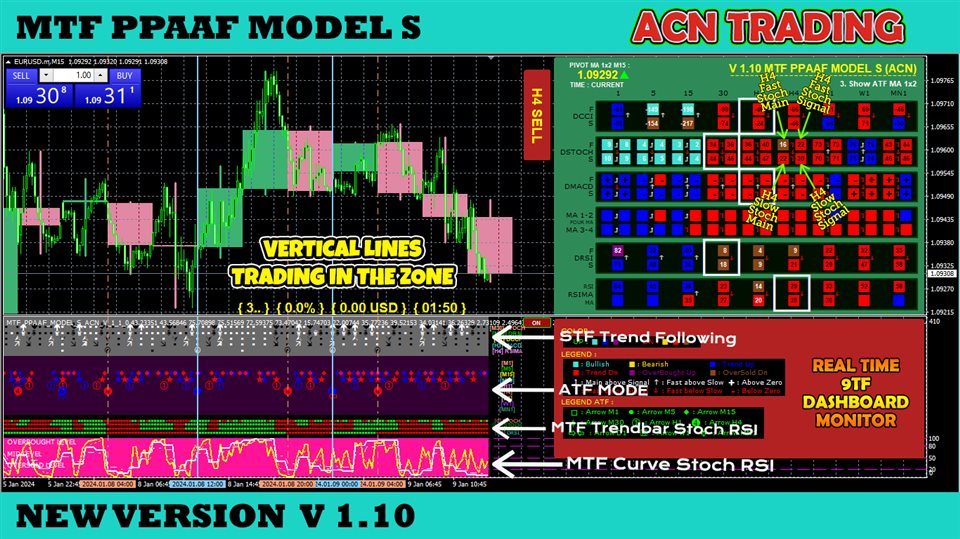
  16. MTF trendbar of dual stochastic.
  17. MTF trendbar of dual double RSI.
  18. MTF curve of dual stochastic. 
  19. MTF curve of dual double RSI.
  20. Pivot level.
  21. Replay system.
  22. Candle high time frame.
  23. Beautiful 20 dashboard color scheme.
  24. Beautiful 11 ATF color scheme.
  25. OBOS line scheme. 
  26. TSPI = Time Spread Profit Info.
  27. Vertical lines trading in the zone (new V 1.10).
  28. Status quo trading in the zone (new V 1.10).

This trading tool has gone through various in-depth research.

I am sure this tool will help you become a pro trader and achieve financial success.

Download it now.

Thank you.

#priceaction #tradingtool #stochrsi #rsiindicator #stochastic #macd #cci #movingaverage #rsima #dashboardtrading 


Empfohlene Produkte
A technical indicator that displays information about the trading volume in the form of a histogram of distribution by price levels. It is used as an independent indicator that helps to evaluate the current objective situation of the instrument, as well as in the format of integration with other methods of analysis, to confirm or filter when making trading decisions. Key Features: Interactive profile update, real-time work Five modes of histogram calculation The possibility of separating the vo
Global Trend
Vitalii Zakharuk
Global Trend Indicator, shows the signals for entry. Displays both entry points and the trend itself. Shows statistically calculated moments for entering the market with arrows. When using the indicator, the risk factor can be optimally distributed. Settings: Uses all one parameter for settings. Choosing a parameter, it is necessary to visually resemble it so that the appropriate graph has a projection of extremes. Parameters: Length - the number of bars for calculating the indicator.
Rira Renko
Vitor Palmeira Abbehusen
RENKO on Time Chart This indicator is an enhanced Renko, so you can watch the Renko bricks on the chart to understand price movement more clearly the other improvement is automated box size according to ATR (Average True Range) period you can set the ATR number as you want and the box size of Renko changes automatically based on price movement Inputs Mode: Box size is the input to specify the size of the Renko box you want to print on the chart. This input lets you choose the fixed b
This Dashboard displays signals in grid view for the 28 major fx currency pairs. It is Mainly used for forex scalping in between 10 to 20 pips maximum and can be used on major trend market decisions. It Uses mainly Moving average and does not give false signal. All you need to note is the point in the grid where the signal occurs.  A beep sound is heard whenever there is a new signal and it will be displayedat the top of the chart.
Scanner Trend Indy
Suriya Thammalungka
A trend indicator based on the Ichimoku Kinko Hyo and Candlestick. The Scanner Trend Indy is an improved variant of the Ichimoku Kinko Hyo and Candlestick, which shows the moment of trend following quite accurately. It is often used as a signal filter. Combination of two indicators makes a better use of these advantages: Ichimoku Kinko Hyo identifies the trend, while Candlestick determines the short-term movements and signals in the trend direction. Messages/sounds (notifications and sound set
实盘交易盈利,回测年化125%,回撤25%,交易量少,不是经常下单,挂起后要有耐心。没有多牛的技术,只是一套简单的交易策略,贵在长期坚持,长期执行。我们有时候就是把自己高复杂,想想我们交易的历程,你就会发现,小白好赚钱,当你懂得越多的时候也是亏损的开始,总是今天用这个技术,明天用那个指标,到头来发现,没有一个指标适合你。其实每个技术指标都是概率性的,没有100%的胜率。很多技术指标你要融合一套交易策略,资金仓位控制,止损止盈比例,一套策略下来下一步你做的就是执行力了,必须要坚决执行你的交易策略,如果不能坚持的话最终还是在亏损。说实话不是每个人都有好的心态和执行力,所以我们做出来这款ea自己来用,发现时间久了扭亏为盈了,那现在就拿出来给大家分享,让更多的人来达到自己的盈利目标。购买后留下邮箱或添加软件里的qq,我们会根据你的资金来调整软件参数。 经测试过的柱数 14794 用于复盘的即时价数量 51321985 复盘模型的质量 n/a 输入图表错误 213935 起始资金 10000.00 点差 当前 (54) 总净盈利 12583.42 总获利 37630.02 总亏损 -25046.
Indicator for binary options arrow is easy to use and does not require configuration works on all currency pairs, cryptocurrencies buy signal blue up arrow sell signal red down arrow tips do not trade during news and 15-30 minutes before their release, as the market is too volatile and there is a lot of noise it is worth entering trades one or two candles from the current period (recommended for 1 candle) timeframe up to m 15 recommended money management fixed lot or fixed percentage of the depo
FiboZag
Andriy Sydoruk
Indicator FiboZag - transfer the indicator to the chart and the Fibonacci levels will be built automatically on the last ZigZag turn. The main advantage lies in the correct construction of Fibonacci levels and markup of price levels. Simple, visual and effective use. The indicator is not redrawn and does not lag. Works on all currency pairs and on all timeframes.
This indicator is designed for those people who want to trade and make money on any instrument and time frame. It gives a very good point to enter the market, to trade is very simple, arrows will show when to open a deal, set and trade without thinking about anything, stop-loss and take profit, set everything depends on your trading style, who is scalping and who keeps the deal for a few days.
GeoWprPro
Georgij Komarov
WPR by Profile, or WPR for Professionals Geo_WprPro is one of the well-known currency profile indicators. It simultaneously displays two WPR indicators with different parameters in the matrix form on all timeframes of multiple currency pairs forming the currency profile . As follows from the description, " WPR is a leading indicator that often goes ahead of the price chart. The oscillator frequently reaches extreme values before the price reversal as if anticipating that event: it almost always
The King of Forex Trend Cloud Indicator is a trend following indicator based on moving averages. The Indicator is meant to Capture both the beginning and the end of a trend. This indicator can be used to predict both short and long terms market trends.  The king of Forex Trend Cloud if paired together with the King of Forex Trend Indicator can give a broad picture in market analysis and forecasts. I have attached images for both the  The king of Forex Trend Cloud on its own and  The king of Fore
Full Forex Market View Dashboard
Opengates Success International
5 (2)
VOLLSTÄNDIGE FOREX-MARKTANSICHT Dashboard-Anzeige Dies ist ein benutzerdefinierter Indikator, der erstellt wurde, um Händlern einen vollständigen Überblick darüber zu geben, was auf dem Markt vor sich geht. Es verwendet Echtzeitdaten, um auf den Markt zuzugreifen und alle Informationen anzuzeigen, die für einen erfolgreichen Handel erforderlich sind. INSTALLATION: Bevor Sie diesen Indikator an Ihren Fenster-Chart anhängen, gehen Sie zum Market Watch Panel Ihres MT4 und AUSBLENDEN Sie al
H4 GBPUSD Trend Scalper is a trend signal scalper The EA trades according to the trend strategy using original built-in indicator for opening and closing orders. The external inputs for limiting trading on Fridays and Mondays are available. The purpose of the strategy is to use the current trend with the most benefit. According to the results of testing and working on demo and real accounts, the best results achieved by using the Н4 timeframe on the GBP/USD pair Works on MetaTrader 4 Build 971+
Demand And Supply
Khurram Mustafa
3.8 (5)
Function Indicate Buy Sell Signals Indicate Strength of Buy Sell Signals This system is for both type of traders (Short & Long Term) Instead of Other Calculations, Parabolic Sar & Awesome are also used In Any time frame this can be use. What is in for Trader? Trading Switch:  Short Term & Long Term Finally, we all knows that Forex Trading needs completely concentrate & proper cash management, So I never promising that my program will never give you loss but I tried well to provide good and respo
FREE
This indicator is created by considering volume divergence with price that is outcome of Bollinger band and Envolpes indicators crossing. It won’t repaint.  It is providing 1 market and three pending orders.  If it is followed with patient, it is providing remarkable profit at the end.  This indicator will be on sale soon on expert advisor. Target is calculated for buy orders as follow 1. 50 pips standard 2. Top Bollinger band 3. Sell Signal Target is calculated for buy orders as follow 1. 50
**Vorstellung des Binary Smart Systems: Ihr ultimativer Handelsbegleiter** Das Binary Smart System ist nicht nur ein Indikator; es ist ein ausgeklügeltes Handelswerkzeug, das sorgfältig entwickelt wurde, um Händlern eine punktgenaue Genauigkeit und rechtzeitige Signale in verschiedenen Märkten zu bieten. Aufgebaut auf einer Grundlage aus hochmodernen Algorithmen und einer umfassenden Sammlung von technischen Indikatoren ist dieses System der Schlüssel, um Handelserfolg zu entfesseln. **Best
This MT4 indicator has been designed to be used on any currency pair and any time frame . It has the scalper and swing trader in mind.  The indicator looks for short-term high-probability reversals in price and will indicate to you to go long (buy) or short (sell) if you see a green or red arrow next to the current candlestick respectively. The indicator provides the best trading opportunities to you during the active trading hours of London and New York, but it will continue to give signals all
Strong Retracement Points Pro demo edition! SRP (Strong Retracement/Reversal Points) is a powerful and unique support and resistance indicator. It displays the closest important levels which we expect the price retracement/reversal! If all level are broken from one side, it recalculates and draws new support and resistance levels, so the levels might be valid for several days depending on the market! If you are still hesitating to start using this wonderful tool, you can check this link to see h
The trader uses the Trend for Neuro indicator to determine the market situation. This is a trending algorithm that is convenient to download, install and use. The algorithm with acceptable accuracy generates input signals and output levels. Strategy for trend trading, filtering and all the necessary functions built into one tool! By launching the indicator, the user will see only two types of arrows that can change color to blue during an uptrend, to red during a downtrend there is no uncertaint
How to use Pair Trading Station Pair Trading Station is recommended for H1 time frame and you can use it for any currency pairs. To generate buy and sell signal, follow few steps below to apply Pair Trading Station to your MetaTrader terminal. When you load Pair Trading Station on your chart, Pair Trading station will assess available historical data in your MetaTrader platforms for each currency pair. On your chart, the amount of historical data available will be displayed for each currency pai
The indicator is a trading system for AUDUSD or NZDUSD currency pairs. The indicator was developed for time periods: M15, M30. At the same time, it is possible to use it on other tools and time periods after testing. "Kangaroo Forex" helps to determine the direction of the transaction, shows entry points and has an alert system. When the price moves in the direction of the transaction, the maximum length of the movement in points is displayed. The indicator does not redraw, all actions o
Indicator help you recognize trend quickly ( recommended to use TF M30-Daily ) Parameters: Alert when have signal Push Notification to MT4 mobil2 Benefits  Easy to use. input parameters is simple The ability to use as filter for any strategy. It work on stock, index, oil,  gold, and on all time frames. It has the function of push-notifications, and sound alerts. Importance : Non Repainting Indicator 
ZhiBiMACD MT4
Qiuyang Zheng
4.5 (2)
Dies ist eine einzigartige MACD-Anzeige, die genauer und einfacher zu bedienen ist als herkömmliche MACD. Es ist für jeden Chartzyklus geeignet und für jede Marktvielfalt geeignet. Die rote Spalte ist das (Buy) Bandsignal und die blaue Spalte das (Sell) Bandsignal. Die gelbe und grüne Linie sind Trendlinien und die beiden Linien kreuzen sich nie. Kaufen: In der blauen Spalte die grüne Linie durch die mittlere 0-Achse betrachten. Verkaufen: In der roten Spalte die gelbe Linie entlang der
Everyday trading represents a battle of buyers ("Bulls") pushing prices up and sellers ("Bears") pushing prices down. Depending on what party scores off, the day will end with a price that is higher or lower than that of the previous day. Intermediate results, first of all the highest and lowest price, allow to judge about how the battle was developing during the day. It is very important to be able to estimate the Bears Power balance since changes in this balance initially signalize about possi
What is this?  This script not only can help you to place all type of orders, included market order " BUY " / " SELL " and pending order " BUYSTOP " / " BUYLIMIT " / " SELLSTOP " / " SELLLIMIT ", but also, it allow you to place order lots by money management concept. How to use this script? 1. Open the chart you want to trade; 2. Drag and drop the script to that chart; 3. Input the parameter what you want to do; 4. Double check the order information, then click "Yes" to confirm to place orde
NN8D Points
Aleksandr Nikolskii
NN8D Points is one of the indicators included into NN8D ( N ikolsky's N esting D oll) trading system. NN8D Points is an indicator containing multiple tools for analyzing Forex market: candle analysis and area system. Rather than simply averaging by Open, Close, High and Low prices, NN8D Points performs a complex analysis of the current and previous bars by various parameters: bar color; bar body size; bar wicks; bar core (average value between Open and Close, as well as between Lows and Highs);
Dark Sniper
Dmitriy Kashevich
Dark Sniper arrow indicator. complete lack of redrawing percentage of correct indicator predictions from 80 85% The arrow indicates the direction of the next candle and the possible direction of the trend in the future.  suitable for small m1 timeframes. It is recommended to open deals from 1 to 2 candles. The signal appears on the last candle advantages of the indicator: 1. leading signals. 2.complete lack of redrawing 3. high signal accuracy.
Helio
Philip Effiong Philip
Its free now till Frebruary 15th GIVE ME A GOOD RATING! Helio indicator is a  advance version of RSI indicator  with  more features .  It provides technical information about  bullish and bearish price momentum , and is often plotted in “Existed pane below”. An asset is usually considered overbought when the Helio is above 70 and oversold when it is below 30. Add your additional chart analysis to filter the signals further . ITS FREE, GIVE ME A GOOD RATING! Traders of all experience levels ca
CyberZingFx Trend Reversal
Afsal Meerankutty
4.26 (19)
Indicator captures the trend reversals with no-repaint Buy and Sell Arrow signals. CyberZingFx Trend Reversal Indicator - your go-to solution for accurate and reliable trend reversal signals. With its  advanced trading strategy , the indicator offers you Buy and Sell Arrow signals that do not repaint, making it a reliable tool for catching Swing Highs and Swing Lows in any market and any time frame. Indicator works on  any market  and  any time frames . __________________________________________
News Catcher Pro
Valeriia Mishchenko
4 (8)
News Catcher Pro is a mean-reversion strategy that uses intraday seasonal volatility patterns caused by high-impact news events. It enters the market at a certain time shortly before a high-impact news event occurs . It does not trade frequently! Supported currency pairs: GBPUSD, EURUSD, EURGBP Recommended timeframe: M5 MT5 version can be found here EA is   FIFO compatible To backtest the EA you should download the news events data file ' NewsEvents.txt ' and copy it to the common MT4/5 dir
Käufer dieses Produkts erwarben auch
Präsentation des Miraculous Forex Indikators: Entfesseln Sie die Kraft präzisen Tradings Sind Sie es leid, nach dem besten Forex-Indikator zu suchen, der wirklich herausragende Ergebnisse in allen Zeitebenen liefert? Suchen Sie nicht weiter! Der Miraculous Forex Indikator ist da, um Ihre Trading-Erfahrung zu revolutionieren und Ihre Gewinne auf neue Höhen zu bringen. Basierend auf modernster Technologie und jahrelanger sorgfältiger Entwicklung steht der Miraculous Forex Indikator als Höhepunkt v
TrendMaestro
Stefano Frisetti
5 (2)
note: this indicator is for METATRADER4, if you want the version for METATRADER5 this is the link: TRENDMAESTRO recognizes a new TREND in the bud, he never makes mistakes. The certainty of identifying a new TREND is priceless. DESCRIPTION TRENDMAESTRO identifies a new TREND in the bud, this indicator examines the volatility, volumes and momentum to identify the moment in which there is an explosion of one or more of these data and therefore the moment in which prices have strong probability of f
Indicator : RealValueIndicator Description : RealValueIndicator is a powerful tool designed specifically for trading on the EURUSD pair. This indicator analyzes all EUR and USD pairs, calculates their real currency strength values, and displays them as a single realistic value to give you a head start on price. This indicator will tell you moves before they happen if you use it right. RealValueIndicator allows you to get a quick and accurate overview of the EURUSD currency pair tops and bottoms,
PZ Day Trading
PZ TRADING SLU
3.67 (3)
Dieser Indikator erkennt Preisumkehrungen im Zick-Zack, wobei nur Preisaktionsanalysen und ein Donchian-Kanal verwendet werden. Es wurde speziell für den kurzfristigen Handel entwickelt, ohne dass ein Nachlackieren oder ein Backpainting erforderlich ist. Es ist ein fantastisches Werkzeug für clevere Trader, die darauf abzielen, das Timing ihrer Operationen zu verbessern. [ Installationsanleitung | Update-Anleitung | Fehlerbehebung | FAQ | Alle Produkte ] Erstaunlich einfach zu handeln Es bi
Gann Signal
Kirill Borovskii
Gann Signal is a very simple indicator at first glance, but hidden inside is many years of experience in studying W.D.Ganna methods. The indicator gives accurate BUY/SELL signals, without redrawing. The indicator is very easy to use. All you need to do is attach it to your chart and follow its recommendations. The indicator constantly analyzes the market for entry opportunities. When such an opportunity appears, the indicator gives a signal in the form of an arrow. I repeat, all signals are NOT
Natürlich, hier ist die Übersetzung in Deutsch: Vorstellung des Astronomie-Indikators für MT4: Dein ultimativer himmlischer Trading-Begleiter Bist du bereit, deine Trading-Erfahrung auf himmlische Höhen zu heben? Suche nicht weiter als unseren revolutionären Astronomie-Indikator für MT4. Dieses innovative Tool übertrifft herkömmliche Trading-Indikatoren und nutzt komplexe Algorithmen, um dir unvergleichliche astronomische Einblicke und präzise Berechnungen zu bieten. Ein Universum an Information
Order Block Indicator MT4
Diego Arribas Lopez
5 (3)
[   MT5-Version   ]  Orderblock-Indikator MT4 Der Order Block Indicator MT4 ist derzeit der genaueste und anpassbarste Indikator auf dem Markt. Es wurde entwickelt, um die Analyse von Operationen basierend auf Auftragsblöcken und Angebots- und Nachfragezonen zu erleichtern. Diese Zonen sind mögliche Umkehrpunkte einer Bewegung. Orderblock Indicator MT4 hebt aktive Orderblöcke von bis zu 4 TFs gleichzeitig hervor. Gleichzeitig bietet der Order Block Indicator MT4 ein visuelles Warnsystem, mit dem
Please send me Direct message on MQL5 CHAT after purchasing the Indicator for Training and Installation Support There are some additional files that is important to use with the Indicator . So be sure to contact me after purchasing the Indicator So that I can add you for training and support . If you find any difficulty with installation then send me Direct message here So that I can connect with you via Anydesk or Teamview for the product installation. " Smart Order Block Indicator " to find
Candle Power Pro
Thushara Dissanayake
4.33 (6)
Nutzen Sie die Kraft echter Volumeninformationen mit dem   Candle Power Pro-   Indikator. Dieses dynamische Tool erfasst die tatsächlichen Volumendaten für jede Kerze und stellt sie als Prozentsatz des Gesamtvolumens dar. Auf diese Weise können Sie den anhaltenden Kampf zwischen Käufern und Verkäufern auf dem Markt erkennen. Candle Power Pro zeigt den Kampf zwischen Käufern und Verkäufern als Prozentsatz des Gesamtvolumens an und gibt Ihnen wertvolle Einblicke in die Marktdynamik. Sie können Aus
Market Breaker Updated version 3
Allistair Kabelo Mandow
1 (1)
Features for software Main functions: Accurate entry signals WITHOUT REPAINTING! Once a signal appears, it remains valid! This is a significant distinction from repainting indicators that might provide a signal and then alter it, potentially leading to deposit losses. Now, you can enter the market with higher probability and precision. There's also a function to colour candles after an arrow appears until the target (take profit) is reached or a reversal signal appears . Display of STOP LOSS
Weis Wave with Alert
Trade The Volume Waves Single Member P.C.
4.79 (19)
Rental/Lifetime Package Options and Privileges' * For optimum results the yearly or lifetime package is suggested due to live training and Discord  channel trading with the  creator! Rent Monthly Six Months   Yearly/Lifetime Weis Wave with Speed with Alert+Speed Index x x x Manual  x x x Quick Set up Video x x x Blog x x x Lifetime Updates x x x Setup and Training Material x x Free Rectangle Break Alert Tool      x Discord Access Channel "The SI traders" x 2-hour live methodology traini
VTrende Pro mt4
Andrii Diachenko
3 (2)
VTrende Pro MT4 - MTF indicator for trend trading with a display panel for MT5 *** Videos can be translated into any language using subtitles (video language - Russian) Although the signals of the VTrende Pro indicator can be used as signals of a full-fledged trading system, it is recommended to use them in conjunction with the Bill Williams TS. VTrende Pro  MT4 is an extended version of the VTrende indicator. Difference between Pro version and VTrende: - Time zones - Signal V - signal 1-
The Nihilist 5.0 Indicator includes Forexalien and Nihilist Easy Trend trading strategies and systems. It is composed of an MTF Dashboard where you can analyze the different input possibilities of each strategy at a glance. It has an alert system with different types of configurable filters. You can also configure which TF you want to be notified on your Metatrader 4 platform and Mobile application The indicator has the option to view how could be a TP and SL by using ATR or fixed points, even
MartingaleArrow
Abdulkarim Karazon
Martingale Arrow ist ein mt4-Indikator vom Typ Pfeil, der für den Handel mit Martingale-Binäroptionen entwickelt wurde. Dieser Pfeil wird auf den offenen Balken/Intrabalken gedruckt und gibt eine Warnung aus. ANWENDUNG: Öffnen Sie den Handel, sobald der Pfeil erscheint. Wenn der Handel gewonnen hat, warten Sie auf das nächste Signal und handeln Sie mit demselben Lot. Wenn der Handel beim nächsten Signal das doppelte Los verliert und so weitermacht, bis ein Signal gewinnt, dann zurücksetzen und
System Trend Pro - This is the best trend trading indicator!!! The indicator no repaint!!!   The indicator has   MTF   mode, which adds confidence to trading on the trend (   no repaint   ). How to trade? Everything is very simple, we wait for the first signal (big arrow), then wait for the second signal (small arrow) and enter the market in the direction of the arrow. (See screens 1 and 2.) Exit on the opposite signal or take 20-30 pips, close half of it, and keep the rest until the oppo
Full STO
Roman Smoroda
Vollständiger STO-Indikator (enthält alle Versionen der drei STO-Indikatoren: Premium, Gold, Silver) - STABLE TRADE OPTION ist für den automatischen Handel mit binären Optionen konzipiert.  VORSICHTIG LESEN!!!!! WICHTIG Erstellen Sie in einem Terminal zwei Vorlagen mit unterschiedlichen Verfallzeiten, eine Vorlage für 18:01, 18:02 mit Verfallzeiten von 1 bis 15 Minuten und eine Vorlage für 22:00 mit Verfallzeiten von 10 bis 20 Minuten. Gewinnrate: 71% in den letzten 5 Jahren Geldverwalt
Connect Indicator
Sukunthakan Ngernbamrung
Connect Indicator is a tool used for connecting indicators between the MQL market and MT4. The connected indicators are made by our group and can be used for other applications, such as sending messages to the Line application or Telegram application. If you have any questions, please don't hesitate to ask us to receive support. Function and indicator buffer Buffer one is the high price of the previous candle. Buffer two is the high price of the previous candle. Usage To connect indicators to fu
Idea: RSI ( Relative Strength Index) and CCI ( Commodity Channel Index ) are powerfull to solved the market.  This indicator has Smoothed Algorithmic signal of RSI and CCI. So that, it separates the market into buy and sell zones, these areas are marked with arrows, red for downtrend, green for uptrend. This algorithm has the effect of predicting the next trend based on the historical trend, so users need to be cautious when the trend has gone many candles. Please visit screenshots
DESCRIPTION The CHAOS INDICATOR has been developed to be used for the TRADING STRATEGY OF CHAOS, as described in the book. The book is in italian language only and can be obtained only on my website indicated below. DATAS COLLECTED AND SHOWN ON GRAPHS The CHAOS INDICATOR apply easily to any graph and any asset, and it is a TRADING FACILITATOR, as it identify immediately the following items on any graph: - The GP (= RIGHT PRICE) i.e. the price to which the asset should be attracted within 24
Gann Swing Structure
Kirill Borovskii
5 (1)
This indicator is based on the mathematics of the great trader W.D. Ganna. With its help, you can easily find strong levels by analyzing swings to find the optimal entry point. The indicator works on all instruments and all timeframes. The indicator is fully manual and has control buttons. All you need to do is press the NEW button, a segment will appear, which you can place on any movement, swing or even 1 candle that you want to analyze. By placing the segment, press the OK button. A grid (th
Divergenzen sind schwierig zu finden und seltener anzutreffen. Sie sind eines der zuverlässigsten Handelsszenarien. Dieser Indikator sucht automatisch mit Ihrem bevorzugten Oszillator nach regelmäßigen und versteckten Abweichungen. [ Installationsanleitung | Update-Anleitung | Fehlerbehebung | FAQ | Alle Produkte ] Einfach zu handeln Findet regelmäßige und versteckte Abweichungen Unterstützt viele bekannte Oszillatoren Implementiert Handelssignale basierend auf Ausbrüchen Zeigt geeignete
PZ Swing Trading
PZ TRADING SLU
5 (4)
Swing Trading ist der erste Indikator, der Schwankungen in Trendrichtung und mögliche Umkehrschwankungen erkennt. Es wird der in der Handelsliteratur weit verbreitete Baseline-Swing-Trading-Ansatz verwendet. Der Indikator untersucht mehrere Preis- und Zeitvektoren, um die aggregierte Trendrichtung zu verfolgen und erkennt Situationen, in denen der Markt überverkauft oder überkauft ist und zur Korrektur bereit ist. [ Installationsanleitung | Update-Anleitung | Fehlerbehebung | FAQ | Alle Produkte
A. Was ist A2SR ?   * Es ist ein führender technischer Indikator (kein Repaint, kein Verzögern). -- Orientierungshilfe : -- unter  https://www.mql5.com/en/blogs/post/734748/page4#comment_16532516 -- und  https://www.mql5.com/en/users/yohana/blog A2SR verfügt über eine spezielle Technik zur Bestimmung der Unterstützungsniveaus (Nachfrage) und des Widerstands (Angebot). Im Gegensatz zu der gewöhnlichen Methode, die wir im Internet gesehen haben, hat A2SR ein originelles Konzept zur Bestimmung d
Das technische Handelssystem von BB Reverse Arrows wurde entwickelt, um umgekehrte Punkte für Einzelhandelsentscheidungen vorherzusagen. Die aktuelle Marktsituation wird durch den Indikator analysiert und für mehrere Kriterien strukturiert: die Erwartung von Umkehrmomenten, potenziellen Wendepunkten, Kauf- und Verkaufssignalen. Der Indikator enthält keine überschüssigen Informationen, verfügt über eine visuelle verständliche Schnittstelle, mit der Händler angemessene Entscheidungen treffen k
Gold Channel is a volatility-based indicator, developed with a specific timing algorithm for the XAUUSD pair, which consists of finding possible corrections in the market. This indicator shows two outer lines, an inner line (retracement line) and an arrow sign, where the theory of the channel is to help identify overbought and oversold conditions in the market. The market price will generally fall between the boundaries of the channel. If prices touch or move outside the channel it is a tra
ECM Channel MT4
Paulo Rocha
5 (1)
ECM Elite Channel is a volatility-based indicator, developed with a specific time algorithm, which consists of finding possible corrections in the market. This indicator shows two outer lines, an inner line (retracement line) and an arrow sign, where the channel theory is to help identify overbought and oversold conditions in the market. The market price will generally fall between the boundaries of the channel. If prices touch or move outside the channel, it's a trading opportunity. The
Gann Zone Pro
Kirill Borovskii
This indicator identifies and displays zones, as it were areas of strength, where the price will unfold. The indicator can work on any chart, any instrument, at any timeframe. The indicator has two modes. The indicator is equipped with a control panel with buttons for convenience and split into two modes. Manual mode: To work with manual mode, you need to press the NEW button, a segment will appear. This segment is stretched over the movement and the LVL button is pressed. The level is displayed
The indicator is designed to work on any trading platform. The program is based on proprietary algorithms and W.D.Ganna's mathematics, allowing you to calculate target levels of price movement based on three points with the highest degree of certainty. It is a great tool for stock trading. The indicator has three buttons: NEW - call up a triangle for calculation. DEL - delete the selected triangle. DELS - completely remove all constructions. The probability of achieving the goals is more than 80
EZT Trend
Tibor Rituper
4 (1)
Der EZT-Trendindikator zeigt Ihnen den Trend, den Rückzug und die Einstiegsmöglichkeiten. Optionale Filterung und alle Arten von Warnungen sind verfügbar. E-Mail- und Push-Benachrichtigungsbenachrichtigungen werden hinzugefügt. Wir entwickeln auch einen EA basierend auf diesem Indikator, der bald verfügbar sein wird. Es handelt sich um einen multifunktionalen Indikator, der aus zwei Farbhistogrammen und einer Linie besteht. Es handelt sich um eine visuelle Darstellung der Richtung und Stärke
IA Trendx3 PRO
Marco Aurelio Santos Costa
What if God Created a Trade System? No miracles... Just see how mathematics can be effective in the market. We managed to combine technical analysis / price action into indicators, creating the best setup for trading, be it in Forex, Indices, or stocks. It took us 2 years to create something that really works, and now it's time for you to discover it. TrendX3 is a revolution in trend analysis. Based on advanced algorithms and real-time data, it provides valuable insights so that you can make inf
Weitere Produkte dieses Autors
Wenn Sie oft Trades verlieren, weil Sie nur einen Indikator verwenden, dann probieren Sie dieses Handelstool aus. Dieses Handelstool verwendet mehr als einen Indikator. Ich beobachte oft Händler, die nur den RSI-Indikator verwenden. Sehr oft ist der Markt überverkauft, aber immer noch im Minus, oder der Markt ist überkauft, aber immer noch im Plus. Aus diesem Grund müssen Sie mehr als einen Indikator verwenden. Wir stellen die neue Version V 3.40 MTF PPAAF vor: Multi Time Frame Precise Price Ac
Die Analyse mehrerer Zeitrahmen eines Währungspaares in einem Fenster kann Sie verwirren. Um mehrere Zeiträume zu analysieren, benötigen Sie zuverlässige Indikatoren. Einer von ihnen verwendet die 9TF-MACD-Kurve. Ich habe Tag und Nacht daran gearbeitet, Code zu erstellen, der einfach, aber zuverlässig ist und alle neun Zeitrahmen in nur einem Indikator abdeckt. Schauen wir uns einige der Vorteile dieses Indikators an: Buntes Histogramm. Die Farbe der Kurve in jedem Zeitrahmen untersch
Die Analyse mehrerer Zeitrahmen eines Währungspaares in einem Fenster kann Sie verwirren. Um mehrere Zeiträume zu analysieren, benötigen Sie zuverlässige Indikatoren. Einer von ihnen verwendet 9TF STOCH RSI. Ich habe Tag und Nacht daran gearbeitet, Code zu erstellen, der einfach, aber zuverlässig ist und alle neun Zeitrahmen in nur einem Indikator abdeckt. Schauen wir uns einige der Vorteile dieses Indikators an: Buntes Histogramm. Die Farbe der Kurve in jedem Zeitrahmen unterscheidet
Analyzing multiple time frames of a currency pair in one window can make you confused. To analyze multiple time frames, you need reliable indicators. One of them is using 9TF RSI MA . I've been working day and night to create code that is simple but reliable and covers all nine time frames in just one indicator .  Let's look at some of the advantages of this indicator: Colorful histogram . The color of the curve in each timeframe is different from one another.  Arrows indicating the crossing of
Analyzing multiple time frames of a currency pair in one window can make you confused. To analyze multiple time frames, you need reliable indicators. One of them is using 9TF MACD Limited Bar . I've been working day and night to create code that is simple but reliable and covers all nine time frames in just one indicator .  Attention! When first installed, the indicator does not look intact. Changing the timeframe will solve the problem. Let's look at some of the advantages of this indicator: C
Analyzing multiple time frames of a currency pair in one window can make you confused. To analyze multiple time frames, you need reliable indicators. One of them is using 9TF STOCH RSI LIMITED BAR . I've been working day and night to create code that is simple but reliable and covers all nine time frames in just one indicator .  Attention! When first installed, the indicator does not look intact. Changing the timeframe will solve the problem. Let's look at some of the advantages of this indicat
Die Analyse mehrerer Zeitrahmen eines Währungspaares in einem Fenster kann Sie verwirren. Um mehrere Zeiträume zu analysieren, benötigen Sie zuverlässige Indikatoren. Einer von ihnen verwendet 9TF Double RSI Double MA. Ich habe Tag und Nacht daran gearbeitet, Code zu erstellen, der einfach, aber zuverlässig ist und alle neun Zeitrahmen in nur einem Indikator abdeckt. Schauen wir uns einige der Vorteile dieses Indikators an: Doppeltes RSI, d.h. RSI schneller & RSI langsamer. Doppelter
Die Analyse mehrerer Zeitrahmen eines Währungspaares in einem Fenster kann Sie verwirren. Um mehrere Zeiträume zu analysieren, benötigen Sie zuverlässige Indikatoren. Einer von ihnen verwendet 9TF Double CCI Double MA. Ich habe Tag und Nacht daran gearbeitet, Code zu erstellen, der einfach, aber zuverlässig ist und alle neun Zeitrahmen in nur einem Indikator abdeckt. Schauen wir uns einige der Vorteile dieses Indikators an: Doppeltes CCI, d.h. CCI schneller & CCI langsamer. Doppelter
Ein genauer CCI-Indikator ist verfügbar. Dashboard Trendleiste Smart Level 9TF Double CCI. Doppelter CCI, d.h. Fast CCI & Slow CCI Warum brauchen Sie ein zweites CCI? Die Verwendung zusätzlicher Indikatoren wird uns im Live-Handel mehr überzeugen 9TF Fast CCI-Kurve 9TF Langsame CCI-Kurve 9TF Echtzeit-CCI-Winkel 9TF Echtzeit-CCI-Wert 9TF Echtzeit-CCI-Richtung/Phase 9TF Trendleiste Neuer Algorithmus bei der Berechnung des Trendbalkens An / aus Schalter. Sehr nützlich, um den Indikator mit nur e
Ein genauer RSI-Indikator ist verfügbar. Dashboard Trendleiste Smart Level 9TF Double RSI. Doppelter RSI, d.h. schneller RSI & langsamer RSI Warum brauchen Sie einen zweiten RSI? Die Verwendung zusätzlicher Indikatoren wird uns im Live-Handel mehr überzeugen 9TF Schnelle RSI-Kurve 9TF Langsame RSI-Kurve 9TF Echtzeit-RSI-Winkel 9TF Echtzeit-RSI-Wert 9TF Echtzeit RSI Richtung/Phase 9TF Trendleiste Neuer Algorithmus bei der Berechnung des Trendbalkens An / aus Schalter. Sehr nützlich, um den Ind
Ein genauer MACD-Indikator ist verfügbar. Dashboard Trend Bar Smart Level 9TF Double MACD. Dual MACD, d.h. schnell (MACD 1) & langsam (MACD 2) Warum brauchen Sie einen zweiten MACD? Die Verwendung zusätzlicher Indikatoren wird uns im Live-Handel mehr überzeugen 9TF Fast MACD 1-Kurve 9TF Langsame MACD 2-Kurve 9TF MACD-Winkel in Echtzeit 9TF MACD-Wert in Echtzeit 9TF-Echtzeit-MACD-RichtungEin genauer MACD-Indikator ist verfügbar. Dashboard Trend Bar Smart Level 9TF Double MACD. Dual MACD, d.h
Ein genauer stochastischer Indikator ist verfügbar. Dashboard Trend Bar Smart Level 9TF Dual Stochastic. Dual Stochastic, d. h. Fast Stochastic & Slow Stochastic Warum brauchen Sie die zweite Stochastik? Die Verwendung zusätzlicher Indikatoren wird uns im Live-Handel mehr überzeugen 9TF Fast Stochastic-Kurve 9TF Langsame stochastische Kurve 9TF Stochastischer Winkel in Echtzeit 9TF Echtzeit-Stochastikwert 9TF Echtzeit Stochastische Richtung/Phase 9TF Trendleiste Neuer Algorithmus bei der Bere
[V 1.00] MTF NRPA 5 Moving Average RTD wurde veröffentlicht! Pfeil-Echtzeit-Dashboard ohne Neulackierung. Wenn Sie nach dem besten Indikator für den gleitenden Durchschnitt suchen, sind Sie hier genau richtig. Im Allgemeinen werden zwei gleitende Durchschnitte festgelegt, da der Schnittpunkt der beiden gleitenden Durchschnitte (der Crossover) die Richtung des nächsten Preistrends bestimmt. Wenn sich der schnelle gleitende Durchschnitt mit dem langsam gleitenden Durchschnitt schneidet und sc
[V 1.00] MTF NRPA 5 RSI RTD wurde veröffentlicht! Pfeil-Echtzeit-Dashboard ohne Neulackierung. Wenn Sie es satt haben, verschiedene RSI-Indikatoren zu verwenden, aber feststellen, dass diese ungenau sind, dann probieren Sie dieses eine Tool aus. Normalerweise installieren Leute nur 1 RSI, um den OBOS-Level in einem bestimmten Zeitraum zu bestimmen. Die schlechte Nachricht ist, dass Sie die OBOS-Werte und -Trends nicht in verschiedenen Zeiträumen gleichzeitig sehen können. Deshalb habe ich d
If you are curious about the position of the stochastic, RSI, CCI curve, whether it is at the OBOS level or not, then this trading tool is for you. Introducing the advanced trading tools of 2024. ATF Trend Following Trend Bar OBOS. This indicator is similar to MTF PPAAF Model S but have two layers.  Click here to learn more about MTF PPAAFS . This trading tool is equipped with various powerful features : MTF = Multi Time Frame = Time Frame can be changed. On/off button. Customizable parameter,
Introducing the advanced trading tools of 2024. MTF PPAAF Model T. This is improvement version of MTF Precise Price Action Arrow Filtered Model S .  Click here to learn more about MTF PPAAF Model S . This trading tool is equipped with various powerful features : MTF = Multi Time Frame = Time Frame can be changed. On/off button. Non Repaint Arrows.  Customizable parameter, color etc.  Can show all time frame (ATF) crossover arrows of fast stochastic main line & fast stochastic signal line (mode
Mit diesem Handelstool können Sie 15 Märkte gleichzeitig scannen. Einführung eines neuen Handelsindikators 2024: ️ Dashboard Multi-Währung Multi-Time-Frame Stochastic. Es gibt mindestens zwei Gründe, warum ich dieses Handelstool entwickelt habe: Erstens ist es mir langweilig, nur einen Markt zu beobachten. Zweitens möchte ich den Einstieg in einen anderen Markt nicht verpassen. Deshalb möchte ich gleichzeitig auch andere Marktbedingungen kennen. Aus diesem Grund benötige ich einen
Auswahl:
Keine Bewertungen
Antwort auf eine Rezension
Version 1.20 2024.01.23
In this new version V 1.20 :
- Fixing OBOS level of ATF dashboard
Version 1.10 2024.01.09
In this new Version V 1.10 :
- Fixing ATF Stoch dan ATF Macd
- Fixing dashboard of RSIMA
- Adding status quo trading in the zone
- Adding vertical lines trading in the zone