• Übersicht
  • Bewertungen
  • Diskussion

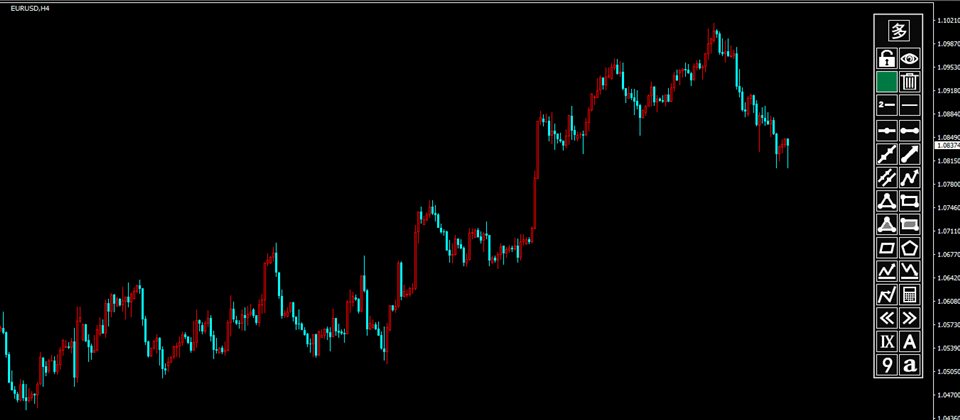
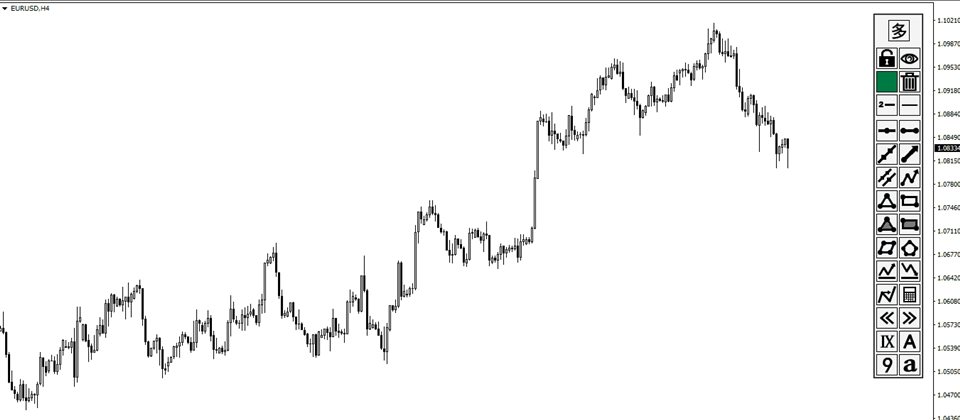
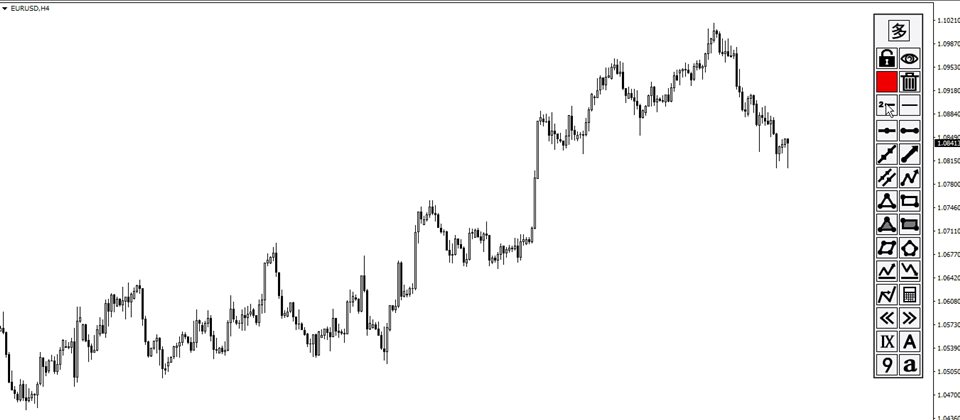
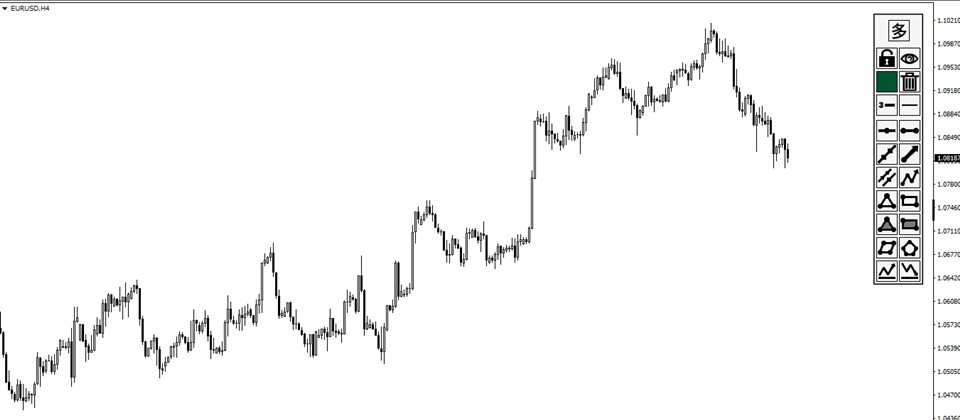
Quick Drawing Tool

About testing Mode

step1.Copy the settings below into txt and save as presets file such as   "QDT3.set"

step2.Copy the presets file into the "tester" folder which is located in the MT4 root directory

step3.Load the settings when testing the indicator

step4.Use the tick data to test and adjust the test speed to 30


InpDivideLine1=*******************************通用设置*******************************
InpTheme=2
InpSHIcon=0
InpShowSHIcon=true
InpShowOnRight=true
InpShowMainTabByClickAutoHide=true
InpHShiftIcon=15
InpVShiftIcon=15
InpHShift=15
InpVShift=15
InpShowMainTabByChartClick=true
InpShowMainTabClickR=30
InpShowMainTabClickY=0
InpTLine0AutoSearchHL=true
InpTLine2AutoSearchHL=false
InpChannelAutoSearchHL=true
InpTLineNArrAutoSearchHL=true
InpFiboAutoSearchHL=true
InpExpansionAutoSearchHL=true
InpAutoSearchHLOnPlaySound=true
InpHLineBack=true
InpTLineBack=true
InpTLineNArrBack=true
InpPolygonBack=true
InpChannelBack=true
InpChannelRayRight=true
InpChannelPointSize=10
InpShowLineInfo=true
InpDeleteOnCurTF=false
InpDeleteConfirm=true
InpShowOBJInfo=true
InpDivideLine2=*******************************图片设置*******************************
InpTipPicName=TipPic
InpHisPicOnlyLoadCurSymbol=true
InpTipPicLeft=-3
InpTipPicTop=-3
InpTipPicWidth=0
InpTipPicHeight=0
InpDivideLine3=*******************************盈亏比例*******************************
InpChangeOnlyOnSelected=true
InpRR1=1.0
InpRR2=2.0
InpRR3=3.0
InpRR4=4.0
InpRR5=5.0
InpRR6=0.0
InpRR7=0.0
InpRR8=0.0
InpRecSLColorB=150
InpRecTPColorB=1978880
InpRecSLColorW=13158655
InpRecTPColorW=14482120
InpFontName=Arial
InpFontSize=10
InpPLTextColor=255
InpDivideLine4=*******************************斐波那契*******************************
InpFiboLevelWaveFolder=FiboWav
InpABCMeasureMode=false
InpAdjustWaveFiboType=1
InpFiboSearchHLPix=15
InpFiboRateStr=-3.236,-2.236,-2,-1.618,-1,-0.618,-0.5,-0.382,-0.236,0,0.236,0.382,0.5,0.618,0.786,1,1.382,1.618,2,2.618,3,3.236,4.236
InpAlertFiboRateStr=0,0.382,0.5,0.618,1,1.382,1.618,2,2.618,3,-0.382,-0.618,-1,-1.618,-2
InpDistinguishFiboLevelWave=true
InpFiboDesStrRight=
InpFiboShowLevelPrice=false
InpFiboBack=true
InpFiboRayRight=false
InpFiboColorB=65535
InpFiboLevelColorB=65535
InpFiboColorW=16711680
InpFiboLevelColorW=16711680
InpFiboLevelWidth=1
InpFiboLevelStyle=0
InpExpansionRateStr=0,0.618,1,1.382,1.618,2,2.618,3
InpAlertExpansionRateStr=0.618,1,1.618,2
InpExpansionDesStrRight=
InpDistinguishExpansionLevelWave=true
InpExpansionShowLevelPrice=false
InpExpansionBack=true
InpExpansionRayRight=false
InpExpansionColorB=65535
InpExpansionLevelColorB=65535
InpExpansionColorW=16711680
InpExpansionLevelColorW=16711680
InpExpansionLevelWidth=1
InpExpansionLevelStyle=0
InpDivideLine5=*******************************带长度信息连续线段*******************************
InpTLineNWithLengthColor=255
InpTLineNWithLengthWidth=2
InpTLineNWithLengthStyle=0
InpTLineNWithLengthTxtColor=255
InpTLineNWithLengthTxtFont=Times New Roman
InpTLineNWithLengthTxtFontsize=12
InpTLineNWithLengthAphla=0.1
InpTLineNWithLengthTxtVShift=0
InpDivideLine6=*******************************区间跨度*******************************
InpOnBack=true
InpQJT_dn=5
InpQJT_up=120
InpR0=1
InpR1=20
InpNoneQJTLineLength=40
InpQJTLockHRang=15
InpWaveBtnFontsize=15
InpFont=1
InpQJTFontsize=15
InpQJTWidth=1
InpQJTColorB=16777215
InpQJTColorW=16711680
InpDivideLine7=*******************************波浪标记*******************************
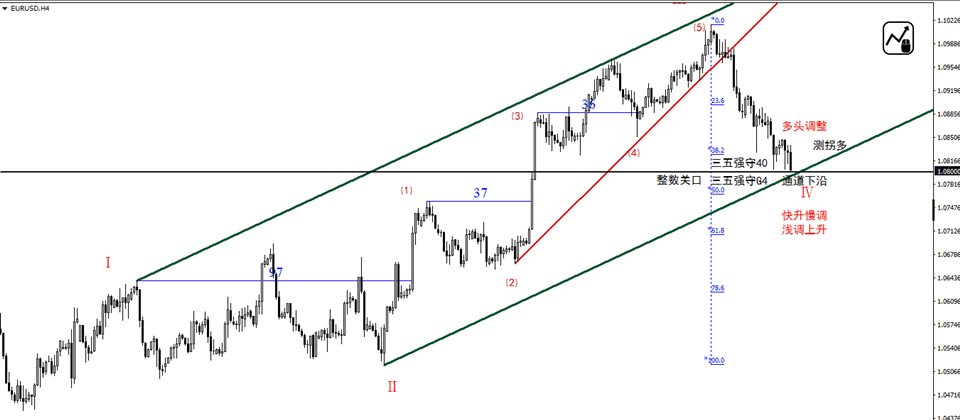
InpMarkSeriesA=Ⅰ,Ⅱ,Ⅲ,Ⅳ,Ⅴ,Ⅵ,Ⅶ,Ⅷ,Ⅸ
InpMarkSeriesB=A,B,C,D,E
InpMarkSeriesC=⑴,⑵,⑶,⑷,⑸,⑹,⑺,⑻,⑼
InpMarkSeriesD=(a),(b),(c),(d),(e)
InpWMAnchor=8
InpFontA=Times New Roman
InpFontsizeA=15
InpFontColorA=255
InpFontB=Times New Roman
InpFontsizeB=15
InpFontColorB=14772545
InpFontC=黑体
InpFontsizeC=12
InpFontColorC=180
InpFontD=Times New Roman
InpFontsizeD=12
InpFontColorD=10114859
InpDivideLine7exp0=Wingdings 2
InpDivideLine7exp1=j,k,l,m,n,o,p,q,r
InpDivideLine7exp2=u,v,w,x,y,z,{,|,}
InpDivideLine8=*******************************波浪标记和区间跨度显示周期*******************************
InpShowOnMode=0
InpAppliedM1=false
InpAppliedM5=true
InpAppliedM15=true
InpAppliedM30=true
InpAppliedH1=true
InpAppliedH4=false
InpAppliedD1=false
InpAppliedW1=false
InpAppliedMN1=false
InpDivideLine9=*******************************自定义分析框架*******************************
InpUserFrame=1
InpShowMarkETabByClickOBJName=
InpShowMarkETabByChartClick=true
InpShowMarkETabClickR=30
InpShowMarkETabClickY=0
InpMarkSeriesESpaceString=-
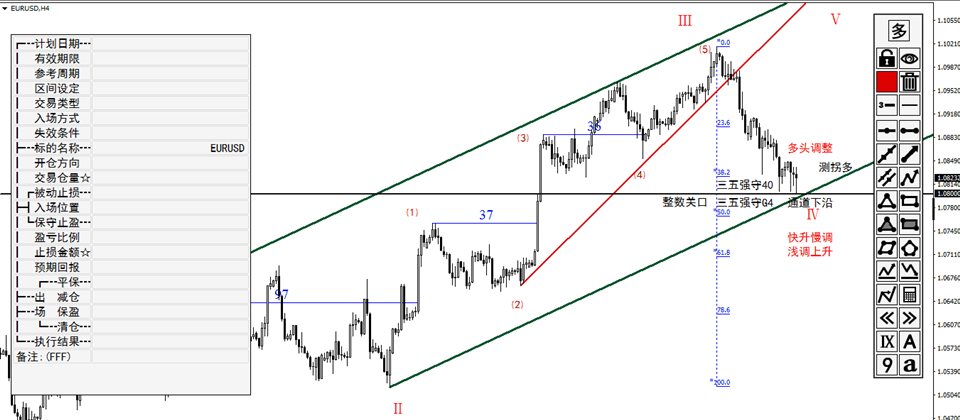
InpMarkSeriesEHead1=工具|趋势|方向|位置|
InpMarkSeriesEHead1SubHead1=道氏理论|波浪理论|箱体理论|通道指标|回撤范围|均线分析|形态分析|趋势线分析:
InpMarkSeriesEHead1Sub1=道氏理论|波浪理论|箱体理论|通道指标|回撤范围|均线分析|形态分析|趋势线分析:
InpMarkSeriesEHead1SubHead2=上升趋势|下跌趋势|横盘震荡|趋势初期|趋势中期|趋势末期||快升慢调|慢升快调|浅调上升|中调上升|深调上升||快跌慢调|慢跌快调|浅调下跌|中调下跌|深调下跌||标准震荡|非标震荡:
InpMarkSeriesEHead1Sub2=上升趋势|下跌趋势|横盘震荡|趋势初期|趋势中期|趋势末期||快升慢调|慢升快调|浅调上升|中调上升|深调上升||快跌慢调|慢跌快调|浅调下跌|中调下跌|深调下跌||标准震荡|非标震荡:
InpMarkSeriesEHead1SubHead3=多头主升|多头调整|空头主跌|空头反弹|盘整上升|盘整下跌||简单快速浪|复合快速浪|简单慢速浪|复合慢速浪||标准阳线多|连续阳线多||标准阴线多|连续阴线多||K线影线密集|价格折返频繁|次级别回撤深:
InpMarkSeriesEHead1Sub3=多头主升|多头调整|空头主跌|空头反弹|盘整上升|盘整下跌||简单快速浪|复合快速浪|简单慢速浪|复合慢速浪||标准阳线多|连续阳线多||标准阴线多|连续阴线多||K线影线密集|价格折返频繁|次级别回撤深:
InpMarkSeriesEHead1SubHead4=前期高点|前期低点|调整极限|反弹极限|盘整上沿|盘整下沿|通道上沿|通道下沿|均线支撑|均线阻力|形态边界|顶部颈线|底部颈线|整数关口|趋势线支撑|趋势线压力|黄金分割62%|黄金分割50%|黄金分割40%:
InpMarkSeriesEHead1Sub4=前期高点|前期低点|调整极限|反弹极限|盘整上沿|盘整下沿|通道上沿|通道下沿|均线支撑|均线阻力|形态边界|顶部颈线|底部颈线|整数关口|趋势线支撑|趋势线压力|黄金分割62%|黄金分割50%|黄金分割40%:
InpMarkSeriesEHead2=形态|信号|入场|出场|
InpMarkSeriesEHead2SubHead1=A字顶|双顶|头肩顶|三重顶|箱型顶|圆弧顶||V字底|双底|头肩底|三重底|箱型底|圆弧底||简单型|锯齿型|平台型|abcde型|楔形|旗形|钻石|顺势平台型|上升三角形|下降三角形|收缩三角形|扩张三角形:
InpMarkSeriesEHead2Sub1=A字顶|双顶|头肩顶|三重顶|箱型顶|圆弧顶||V字底|双底|头肩底|三重底|箱型底|圆弧底||简单型|锯齿型|平台型|abcde型|楔形|旗形|钻石|顺势平台型|上升三角形|下降三角形|收缩三角形|扩张三角形:
InpMarkSeriesEHead2SubHead2=底分型|标准阳线|早晨之星|看涨吞没|反击刺透|红三兵|锤子线|顶分型|标准阴线|黄昏之星|看跌吞没|乌云盖顶|绿三兵|吊颈线|十字星|孕线:
InpMarkSeriesEHead2Sub2=底分型|标准阳线|早晨之星|看涨吞没|反击刺透|红三兵|锤子线|顶分型|标准阴线|黄昏之星|看跌吞没|乌云盖顶|绿三兵|吊颈线|十字星|孕线:
InpMarkSeriesEHead2SubHead3=回调多|测趋多|测拐多|突破多|破趋多|破拐多|区间多|超卖多|破颈线多|破形态多|一买多|二买多|三买多||反弹空|测趋空|测拐空|突破空|破趋空|破拐空|区间空|超买空|破颈线空|破形态空|一卖空|二卖空|三卖空:
InpMarkSeriesEHead2Sub3=回调多|测趋多|测拐多|突破多|破趋多|破拐多|区间多|超卖多|破颈线多|破形态边界多|一买多|二买多|三买多||反弹空|测趋空|测拐空|突破空|破趋空|破拐空|区间空|超买空|破颈线空|破形态边界空|一卖空|二卖空|三卖空:
InpMarkSeriesEHead2SubHead4=主动止损|分批止损|点位止盈|点数止盈|盈亏比止盈|分批止盈|1倍减半仓|点数移损|条件移损|条件平保|条件保盈|道氏跟踪|通道跟踪|趋势线跟踪|均线跟踪|布林跟踪|海龟跟踪|指标反向:
InpMarkSeriesEHead2Sub4=主动止损|分批止损|点位止盈|点数止盈|盈亏比止盈|分批止盈|1倍减半仓|点数移损|条件移损|条件平保|条件保盈|道氏跟踪|通道跟踪|趋势线跟踪|均线跟踪|布林跟踪|海龟跟踪|指标反向:
InpMarkSeriesEHead3=操作|分类
InpMarkSeriesEHead3SubHead1=建单仓多|建双仓多|减半仓多|补半仓多|清仓多|反手空||建单仓空|建双仓空|减半仓空|补半仓空|清仓空|反手多:
InpMarkSeriesEHead3Sub1=↑建单仓多|↑↑建双仓多|↓减半仓多|↑补半仓多|清仓多|↓↓反手空||↓建单仓空|↓↓建双仓空|↑减半仓空|↓补半仓空|清仓空|↑↑反手多:
InpMarkSeriesEHead3SubHead2=× 排除可能|概率 ★★★|概率 ★★☆|概率 ★☆☆||位置A|位置B|位置C|位置D|位置E|位置F|位置G|位置H|位置I|位置J|位置K||[情形1]|[情形2]|[情形3]|[情形4]|[情形5]|[情形6]|[情形7]|[情形8]|[情形9]
InpMarkSeriesEHead3Sub2=× 排除可能|概率 ★★★|概率 ★★☆|概率 ★☆☆||位置A||位置B|位置C|位置D|位置E|位置F|位置G|位置H|位置I|位置J|位置K||[情形1]|[情形2]|[情形3]|[情形4]|[情形5]|[情形6]|[情形7]|[情形8]|[情形9]
InpMarkSeriesEHead3SubHead3=
InpMarkSeriesEHead3Sub3=
InpMarkSeriesEHead3SubHead4=
InpMarkSeriesEHead3Sub4=
InpMarkETabLeft=15
InpMarkETabTop=15
InpMarkEBtnWidth=110
InpMarkEBtnHeight=20
InpMarkEBtnAlign=2
InpFontE=黑体
InpFontsizeE=12
InpFontsizeEHead=12
InpBackColorEHeadB=4934475
InpBackColorEHeadW=11842740
TheFontColorEBaseB=16777215
TheFontColorEBaseW=0
InpFontColorE1B=255
InpFontColorE2B=65280
InpFontColorE3B=8421504
InpFontColorE1W=255
InpFontColorE2W=6326018
InpFontColorE3W=8421504
InpKeyWords1=上升|阳线|多头|快升|慢升|★★★|底分型|标准阳线|早晨之星|看涨吞没|反击刺透|红三兵|锤子线
InpKeyWords1r=上升三角形
InpKeyWords2=下跌|阴线|空头|快跌|慢跌|★☆☆|顶分型|标准阴线|黄昏之星|看跌吞没|乌云盖顶|绿三兵|吊颈线
InpKeyWords2r=下降三角形
InpKeyWords3=位置|情形
InpKeyWords3r=
InpBackColorE1B=180
InpBackColorE2B=1978880
InpBackColorE1W=240
InpBackColorE2W=6326018
InpDivideLine10=*******************************交易计划表*******************************
InpSHPTSheetByClickOBJName=
InpClilckRightPBarSHPTSheet=true
InpRightPBarSHPTSheetRate1=0.9
InpRightPBarSHPTSheetRate2=1.0
InpTradePlanSheetSpaceString=-
InpTradePlanSheet_TF=M1|M5|M15|M30|H1|H4|D1|W1|MN1|M5 + M1|M15 + M5|H1 + M15|H4 + H1|D1 + H4|W1 + D1|M15 + M5 + M1|H1 + M15 + M5|H4 + H1 + M15|D1 + H4 + H1|W1 + D1 + H4
InpTradePlanSheet_QJT=QJT =   5|QJT =  10|QJT =  20|QJT =  30|QJT =  40|QJT =  50|QJT =  60|QJT =  70|QJT =  80|QJT =  90|QJT = 100|QJT = 120|QJT = 150
InpTradePlanSheet_TradeTypeA=回调多->博主升|突破多->博主升|回调多->博反转|突破多->博反转|超卖多->博反转|多反弹->博反转|区间多->做震荡|-|
InpTradePlanSheet_TradeTypeB=反弹空->博主跌|突破空->博主跌|反弹空->博反转|突破空->博反转|超买空->博反转|空回调->博反转|区间空->做震荡
InpTradePlanSheet_EntryModeA=本级趋势线突破|本级拐点线突破|本级分界点突破|本级指标线突破|-|
InpTradePlanSheet_EntryModeB=趋势线->调整突破/形态边界|拐点线->调整突破/形态边界|单均线->调整突破/形态边界|双均线->调整突破/形态边界|布林线->调整突破/形态边界|前区间->调整突破/形态边界|回调线->调整突破/形态边界|-|
InpTradePlanSheet_EntryModeC=浅回调->本级突破/次级突破|形态外->颈线突破/边界突破|形态内->高抛低吸/单向开仓|主浪完->上级位置/次级突破
InpTradePlanSheet_FailureCondition=
InpTradePlanSheet_OpenDirection=开多|开空|加多|加空|-|平多|平空|减多|减空|-|平多 && 开空|平空 && 开多
InpTradePlanSheet_BreakEvenA=盈利点数 ≥ X|盈利金额 ≥ X|价格上破 ≥ X|价格下破 ≤ X|盈亏比达 ≥ X|
InpTradePlanSheet_BreakEvenB=走势主浪特征不明显|未破前高出现反向标K|未破前低出现反向标K|未破前高折返破趋势线|未破前低折返破趋势线|
InpTradePlanSheet_BreakEvenC=未破前高折返破通道线|未破前低折返破通道线|突破幅度小于0.382折返|未达到主浪幅度就折返|入场位在右肩附近不启用
InpTradePlanSheet_PositionReduceA=盈利点数 ≥ X 减Y|盈利金额 ≥ X 减Y|价格上破 ≥ X 减Y|价格下破 ≤ X 减Y|盈亏比达 ≥ X 减Y|
InpTradePlanSheet_PositionReduceB=重要位置停滞或反向 减Y|外延三点停滞或反向 减Y|复合主浪级别被破坏 减Y|小级别背驰引发停滞 减Y|快升浪幅度达标后停滞 减Y|快跌浪幅度达标后停滞 减Y|
InpTradePlanSheet_PositionReduceC=快升浪加速后迅速回撤 减Y|快跌浪加速后迅速反弹 减Y|同级别突破幅度达0.9倍 减Y|主浪幅度0.9倍后破导拐 减Y|5以下区间破10EMA 减Y|10左右区间破20EMA 减Y|突破15期唐奇安通道 减Y
InpTradePlanSheet_ProfitProtectionA=盈利点数≥X 移损Y|盈利金额≥X 移损Y|价格上破≥X 移损Y|价格下破≤X 移损Y|盈亏比达≥X 移损Y|
InpTradePlanSheet_ProfitProtectionB=盈利点数≥X 保盈Y|盈利金额≥X 保盈Y|价格上破≥X 保盈Y|价格下破≤X 保盈Y|盈亏比达≥X 保盈Y|
InpTradePlanSheet_ProfitProtectionC=盈利点数≥X Y指标 移损|盈利金额≥X Y指标 移损|价格上破≥X Y指标 移损|价格下破≤X Y指标 移损|盈亏比达≥X Y指标 移损
InpTradePlanSheet_CloseAllA=盈利点数 ≥ X|盈利金额 ≥ X|价格上破 ≥ X|价格下破 ≤ X|盈亏比达 ≥ X|
InpTradePlanSheet_CloseAllB=突破分界点趋势逆转|突破通道线趋势逆转|突破趋势线趋势逆转|原趋势级别结束进入盘整|突破导航分界点主浪结束|突破导航通道线主浪结束|突破导航趋势线主浪结束|
InpTradePlanSheet_CloseAllC=向下突破30期唐奇安通道|向上突破30期唐奇安通道|调整周期足够后不创新高折返|调整周期足够后不创新低折返
InpTradePlanSheet_ExecutionResult=止损|止盈|中断|扫平保|扫移损|扫保盈|减仓后扫移损|减仓后扫保盈
InpDivideLine11=*******************************价格观测区*******************************
InpClilckRightPBarDrawPRng=true
InpRightPBarDrawPRngAutoChangeTF=true
InpChangeTFByClickRngInfo=true
InpRightPBarDrawPRngRate1=0.0
InpRightPBarDrawPRngRate2=0.1
InpRecColorB=2631720
InpRecColorW=11119017
InpDivideLine12=*******************************报警设置*******************************
InpAlertR0=100.0
InpAlertTotalLen=60
InpAlertWavLen=18
InpAlertWav=关键位置.wav
InpAlertWavFB=斐波回调.wav
InpAlertWavEP=斐波扩展.wav
InpAlertWavShortName1=趋势
InpAlertWav1=趋势线.wav
InpAlertWavShortName2=通道
InpAlertWav2=通道线.wav
InpAlertWavShortName3=分A
InpAlertWav3=分界点A.wav
InpAlertWavShortName4=前高
InpAlertWav4=前高.wav
InpAlertWavShortName5=前低
InpAlertWav5=前低.wav
InpAlertWavShortName6=颈线
InpAlertWav6=颈线.wav
InpPlanTradeAlertOnOff=true
InpAlertWavOP=计划开仓价.wav
InpAlertWavSL=计划止损价.wav
InpAlertWavTP=计划止盈价.wav
InpAlertDefaultPlaySound=true
InpAlertDefaultAlert=true
InpAlertDefaultNotification=false
InpAlertDefaultEMail=false
InpAlertDefaultContinuously=false
InpAlertDefaultTF=15
InpClickPriceAxisSHProperty=false
InpClickPriceAxisRate1=0.75
InpClickPriceAxisRate2=0.85
InpDivideLine13=*******************************快捷键设置*******************************
InpKeyScrShootSetting=74
InpKeySaveChartPic=79
InpChartPicWithDate=true
InpKeyShowHideTipPic=85
InpKeyShowHideHisPic=89
InpKeyTipPicOnBack=66
InpKeyChangeChartColorRev=188
InpShowCurPriceLine=false
InpKeyShowRecInfo=73
InpKeyStopPlaySound=192
InpKeyMainTabShowHide=81
InpKeyShowHideMarkETab=87
InpKeyChangeMarkETabPosition=0
InpKeySetOBJStyle=0
InpKeyShowPlanSheet=84
InpKeyShowPlanTradeLines=76
InpKeyKbarShowHide=75
InpKeyShowHideAlertLines=77
InpShowHideAlertLinesChangeSelect=false
InpIncreaseWidthShowAlertLines=0
InpShowHideAlertLinesDotSize=7
InpShowHideAlertLinesKbarSpace=2
InpKeyOBJDelete=68
InpKeyOBJShowHide=72
InpKeyOBJLock=83
InpKeyTrendHLock=67
InpKeyOBJDeleteByClick=17
InpOBJDeleteByClickOnlyDTCreated=false
InpKeyDeleteWaveMark=0
InpBackspaceKey=90
InpApplyTFChange=true
InpLastTFKey=90
InpNextTFKey=88
InpSkipM30=true
InpTFFontName=Impact
InpTFFontSize=180
InpTFFontColor=2175488
InpApplyMainTFChange=true
InpMainTFKey=9
InpMainTF1=1440
InpMainTF2=60
InpKeyChartShiftSize=65
InpShiftValue=15
InpKeyCopyTLine=86
InpKeyHReverseTLine=78
InpKeyHReverseTLine1=50
InpKeyHReverseTLine2=51
InpKeyChangeColor2RedGreen=71
InpKeyChangeColor2RedBlue=82
InpKeyVerticalMove=190
InpKeyQJT=0
InpKeyFibo=70
InpKeyExpansion=69
InpKeyHLine=0
InpKeyTLine2=0
InpKeyTLine=0
InpKeyTLineArr=0
InpKeyChannel=0
InpKeyTLineNArr=0
InpKeyTriangle=0
InpKeyRectangle=0
InpKeyTrianglefill=0
InpKeyRectanglefill=0
InpKeyRectangle2=0
InpKeyPolygon=0
InpKeyBuyPL=0
InpKeySellPL=0
InpVersionDT=1702944000
InpDivideLine14=************************************************************************


Empfohlene Produkte
Dark Sniper
Dmitriy Kashevich
Dark Sniper arrow indicator. complete lack of redrawing percentage of correct indicator predictions from 80 85% The arrow indicates the direction of the next candle and the possible direction of the trend in the future.  suitable for small m1 timeframes. It is recommended to open deals from 1 to 2 candles. The signal appears on the last candle advantages of the indicator: 1. leading signals. 2.complete lack of redrawing 3. high signal accuracy.
Night ghost
Dmitriy Kashevich
Night Ghost - Pfeilanzeige für binäre Optionen. Dies ist ein zuverlässiger Assistent für Sie in der Zukunft! - Kein Neuzeichnen auf dem Diagramm -Funktioniert hervorragend bei allen Währungspaaren! - Anzeigegenauigkeit bis zu 90 % (besonders nachts) -Keine lange Einrichtung erforderlich (perfekt für binäre Optionen eingerichtet) - Keine späten Signale - Das Erscheinen eines Signals auf der aktuellen Kerze -Perfekt für die M1-Periode (nicht mehr!) - Augenfreundliche Kerzenfar
DMAX pro
Danny Teoh Kok Keong
DMAX SIGNAL IS VERY POWERFUL TOOL TO HELP YOU ENTRY,ITS CAN DETECT OVERSOLD AND OVERBOUGHT IN FOREX MARKET. ITS CAN TRADE 24 FOREX PAIR IN MARKET, 80% ACCURATE RESULT. MANY TRADER FAIL BECAUSE OF ENTRY POINT AND EXIT POINT , SIGNAL OF DMAX WILL GIVE VERY GOOD SIGNAL TO LET YOU KNOW WHERE TO ENTRY AND EXIT.  RISK MANAGEMENT IS VERY IMPORTANT IN TRADING FOREX, PLEASE DONT RISK OVER 5% PER TRADE IS FORE MARKET
PRO Renko System ist ein hochpräzises Handelssystem, das speziell für den Handel mit RENKO-Charts entwickelt wurde. Dies ist ein universelles System, das auf verschiedene Handelsinstrumente angewendet werden kann. Das System neutralisiert effektiv so genannte Marktgeräusche, die Ihnen Zugang zu genauen Umkehrsignalen geben. Der Indikator ist sehr einfach zu bedienen und hat nur einen Parameter, der für die Signalerzeugung verantwortlich ist. Sie können das Tool einfach an jedes Handelsinstr
Trend Flasher Trend is your friend is the age old saying quote in trading arena, there are though many ways to gauge the trend and its direction, more scientific measure and logically meaningful will be an ATR break outs to identify and spot the trend and its acceleration, so we created this easy to use trend identification panel and optimized super trend based multi time frame panel entry system to aid and help the traders to make their trading decision. Unique Features of Trend Flasher 1
Binary Options Support Resistance Indicator This indicator is designed for binary options trading and effectively shows retracements from support and resistance levels. Signals appear on the current candle. A red arrow pointing downwards indicates a potential selling opportunity, while a blue arrow pointing upwards suggests buying opportunities. All that needs adjustment is the color of the signal arrows. It is recommended to use it on the M1-M5 timeframes as signals are frequent on these timef
Black series MT4
Dmitriy Kashevich
1 (1)
Black series MT4 - The indicator is designed for trading on binary options with Timeframe M1-M5-M15 Multicurrency (Works on cryptocurrency and currency pairs) The signal appears when the candle opens Up to 90% correct signals There is no signal redrawing at all Can be used with other indicators. Good for scalping! In Settings there is: -Indicator working methods -I Allert Arrow color Red signal down Blue signal up Also watch the video how the indicator works and signals
Cosmic Diviner X Planet
Olena Kondratenko
4 (2)
This unique multi-currency strategy simultaneously determines the strength of trends and market entry points, visualizing this using histograms on the chart. The indicator is optimally adapted for trading on the timeframes М5, М15, М30, Н1. For the convenience of users, the indicator renders the entry point (in the form of an arrow), recommended take profit levels (TP1, TP2 with text labels) and the recommended Stop Loss level. The take profit levels (TP1, TP2) are automatically calculated for
ReboltP
David Theodore Caro-greene
Rebalance Overlay Technology (Rebolt) enables the trader to visualize the flow of money from one chart to another chart. Rebolt Probability indicates the probability that money has flowed from one chart to another chart for a specified length of time over a number of intervals specified by the user. When Rebolt reads Cyan or Blue these are buying signs good for the length of time specified by the user or until a conflicting signal arises. When Rebolt reads Violet or Red there are selling signs
Embark on the pinnacle of Binary Options evolution. Our indicator isn't just adaptive—it's relentless. Picture a ninja riding a serpent, shadowing its every move; that's how this tool trails the market trend, unwavering till the end. Built upon the foundational prowess of the Ichimoku indicator and honed with an array of fine-tuned oscillators, it epitomizes accuracy and precision. Dive deep without getting lost in the Ichimoku's intricacies—our indicator simplifies the process for you. Perhaps
Renko, Heiken Ashi, Ticks Bar, Range Bar.    Easy switching, easy setup, all in one window.        Place the Custom Chart indicator and view Renko, Heiken Ashi, Tick bar, Range bar charts in real time at real chart.    Position the offline chart window so that the indicator control panel is visible.    Switch the chart mode by click of a button.    Connect to the output chart any indicator, expert advisor without any restrictions.    No, it doesn't work in the tester.    Yes, you can use an
The indicator for determining key patterns for the BBMA strategy will perfectly complement the Fibo Musang strategy, and can also be used as an independent tool. IMPORTANT! Contact me immediately after purchase to receive the second file! If you have any questions, I will help you deal with the indicator. Designed to save market analysis time; Sends push notifications to the phone when key moments of the strategy have arisen (Extrem A, Csak, cross the BB line with a candle) Advantages Easy to u
Strong Retracement Points Pro demo edition! SRP (Strong Retracement/Reversal Points) is a powerful and unique support and resistance indicator. It displays the closest important levels which we expect the price retracement/reversal! If all level are broken from one side, it recalculates and draws new support and resistance levels, so the levels might be valid for several days depending on the market! If you are still hesitating to start using this wonderful tool, you can check this link to see h
In der Welt des Handels mit binären Optionen, wo präzise Marktanalyse und strategische Entscheidungsfindung von größter Bedeutung sind, ist die Suche nach einem außergewöhnlichen Handelsindikator, der profitable Möglichkeiten erschließen kann, endlos. Treten Sie ein in den Secret Indicator - ein bemerkenswertes MT4-Handelstool für binäre Optionen, das seinen Ruf als das Beste und Stärkste in seiner Klasse erworben hat. Der Secret Indicator ist das Ergebnis jahrelanger akribischer Forschung, E
Fnix l long position
Monique Ellen Miranda Dos Santos
Sind Sie als Investor auf der Suche nach langfristigen Möglichkeiten auf dem Finanzmarkt? Ich präsentiere Ihnen den benutzerdefinierten Langzeit-Trendindikator. Dieser Indikator ist für Trader konzipiert, die Positionen auf längeren Zeiträumen als täglichen, wöchentlichen und monatlichen Charts handeln möchten. Mit klaren und präzisen Signalen erhalten Sie die Unterstützung, die Sie benötigen, um fundierte Entscheidungen zu treffen. Hauptmerkmale: Langzeitstrategie: Dieser Indikator eignet sich
Currency Weight FX ( CW8) You are going to see the Forex Treasure If you think in Forex Trading you are dealing with one chart only, then you are on your way to be plunged into misery. The weight of one's currency will affect other currency or currencies. This Currency Weight FX is a breakthrough in trading tools With Currency Weight FX   ( CW8 ) indicator you will see each weight of major currency. This currency WEIGHT is very much different from currency STRENGTH most people usually mean.
Forex-Scalping-Indikator, der seine Pfeile nicht neu zeichnet. Es funktioniert am besten in den Zeitrahmen M5, M15, M30, H1. Die Standardeinstellungen sind für den Zeitrahmen M5. Das folgende Bild zeigt ein Beispiel für die Arbeit am H1-Chart mit dem Parameterwert "Periode = 0,35". Sie können die Demoversion herunterladen und selbst testen. Jetzt verwenden wir die Signale dieses Indikators in fast allen unseren Scalping-Strategien. Nach unseren Berechnungen beträgt die Genauigkeit seiner Signal
Blahtech Market Profile
Blahtech Limited
4.61 (18)
Was: $249  Now: $99   Market Profile defines a number of day types that can help the trader to determine market behaviour. A key feature is the Value Area, representing the range of price action where 70% of trading took place. Understanding the Value Area can give traders valuable insight into market direction and establish the higher odds trade. It is an excellent addition to any system you may be using. Blahtech Limited presents their Market Profile indicator for the MetaTrader community. Ins
Skalping-Sofortanzeige. Ein Signal zum Kauf oder Verkauf zusammen mit dem Basiswert des Indikators wird durch den Pfeil gegeben. Als starkes Signal gilt, wenn der Pfeil und der Kellerindikator, der vier Zeitrahmen anzeigt, in der Vorhersage übereinstimmen. Dieser Indikator enthält viele Algorithmen und Aufgaben, die auf ein Ergebnis reduziert wurden, das der Skalping-Instant-Indikator liefert, nämlich den Händler über die Richtung des Marktes informiert. So gibt er 1. Scalping-Signal (A
FiboZag
Andriy Sydoruk
Indicator FiboZag - transfer the indicator to the chart and the Fibonacci levels will be built automatically on the last ZigZag turn. The main advantage lies in the correct construction of Fibonacci levels and markup of price levels. Simple, visual and effective use. The indicator is not redrawn and does not lag. Works on all currency pairs and on all timeframes.
This is a new strategy for SUPPLY DEMAND areas It is based on a calculation using the tick volume to detect the big price action in market for both bear /bull actions this smart volume action candles are used to determine the supply and demand areas prices in between main supply and demand lines indicate sideway market  up arrows will be shown when prices moves above the main supply and the secondary supply lines Down arrows will be shown when prices moves below the main demand and the secondary
GeoWprPro
Georgij Komarov
WPR by Profile, or WPR for Professionals Geo_WprPro is one of the well-known currency profile indicators. It simultaneously displays two WPR indicators with different parameters in the matrix form on all timeframes of multiple currency pairs forming the currency profile . As follows from the description, " WPR is a leading indicator that often goes ahead of the price chart. The oscillator frequently reaches extreme values before the price reversal as if anticipating that event: it almost always
ReversalPatterns
Thushara Dissanayake
Dieser technische Indikator identifiziert und analysiert automatisch Preisbewegungen anhand einer Vielzahl von   Umkehrkerzenmustern   im Diagramm. Es zeichnet praktischerweise Pfeilzeichen zusammen mit den entsprechenden Musternamen ein, sodass Sie die neuesten Umkehrkerzenmuster leicht erkennen können. Mit diesem Indikator können Sie Chartanalysen schnell identifizieren und mit zuvor identifizierten Kerzenmustern vergleichen. Der Indikator umfasst eine Reihe implementierter Candlestick-Muster,
Gioteen Volatility Index (GVI)   - your ultimate solution to overcoming market unpredictability and maximizing trading opportunities. This revolutionary indicator helps you in lowering your losing trades due to choppy market movements. The GVI is designed to measure market volatility, providing you with valuable insights to identify the most favorable trading prospects. Its intuitive interface consists of a dynamic red line representing the volatility index, accompanied by blue line that indicat
If you are using volume spread analysis, whether your are a beginner or an expert, this system will give you a lot of features and help in your analysis. Please watch the video to see all the features. Features With one click you will find all the VSA patterns on your chart . Bars without opening price. Easy to read volume indicator. Bar reader (Bar type - Close type - Volume type - Spread type). Daily and weekly levels (Pivot - Camarilla - Fibo). Very light on the trading platform and moving
WanaScalper MT4
Isaac Wanasolo
1 (1)
A scalping indicator based on mathematical patterns, which on average gives signals with relatively small SL, and also occasionally helps to catch big moves in the markets (more information in the video) This indicator has three main types of notifications: The first type warns of a possible/upcoming signal on the next bar The second type indicates the presence of a ready signal to enter the market/open a position The third type is for SL and TP levels - you will be notified every time price r
This is an indicator with real-time reminder function, which can realize real-time monitoring of four harmonic patterns of multiple cycles (30 minute chart, 1 hour chart, 4 hour chart, 1 day chart), and help traders to have insight into market reversal opportunities. Gartly Bat Butterfly Cypher Before loading into the chart, you need to manually input the switch parameters, which are the harmonic patterns   and time period you want to monitor: M30 / H1 / H4 / D1. It is on  when the corresponding
Urgently
Tatiana Savkevych
The Urgently indicator is designed to quickly determine the situation in the market, reflect the state of the market and signal profitable levels for opening trades. Market conditions change quickly enough, requiring constant calibration of trading strategies. Recommended for use in conjunction with any of the oscillators. The Urgently forex market trend indicator shows the trend direction and entry points. It smooths out price fluctuations when generating a signal by averaging the data and the
PZ Mean Reversion MT4
PZ TRADING SLU
2.33 (3)
Einzigartiger Indikator, der einen professionellen und quantitativen Ansatz für Mean-Reversion-Trading umsetzt. Es nutzt die Tatsache, dass der Preis auf vorhersehbare und messbare Weise umlenkt und zum Mittelwert zurückkehrt, was klare Ein- und Ausstiegsregeln ermöglicht, die nicht-quantitative Handelsstrategien bei weitem übertreffen. [ Installation Guide | Update Guide | Troubleshooting | FAQ | All Products ] Klare Handelssignale Erstaunlich einfach zu handeln Anpassbare Farben und Größen I
Atomic Analyst
Issam Kassas
5 (3)
Zunächst einmal ist es erwähnenswert, dass dieser Handelsindikator nicht neu malt, nicht neu zeichnet und keine Verzögerung aufweist, was ihn sowohl für manuellen als auch für Roboterhandel ideal macht. Benutzerhandbuch: Einstellungen, Eingaben und Strategie. Der Atom-Analyst ist ein PA-Preisaktionsindikator, der die Stärke und das Momentum des Preises nutzt, um einen besseren Vorteil auf dem Markt zu finden. Ausgestattet mit fortschrittlichen Filtern, die helfen, Rauschen und falsche Signale z
Käufer dieses Produkts erwarben auch
DERZEIT 26% RABATT Die beste Lösung für jeden Newbie oder Expert Trader! Dieser Indikator ist ein einzigartiges, qualitativ hochwertiges und erschwingliches Trading-Tool, da wir eine Reihe von proprietären Funktionen und eine neue Formel integriert haben. Mit nur EINEM Chart können Sie die Währungsstärke für 28 Forex-Paare ablesen! Stellen Sie sich vor, wie sich Ihr Handel verbessern wird, weil Sie in der Lage sind, den genauen Auslösungspunkt eines neuen Trends oder einer Scalping-Gelegenh
TPSpro RFI Levels
Roman Podpora
5 (13)
A key element in trading is zones or levels from which decisions to buy or sell a trading instrument are made. Despite attempts by major players to conceal their presence in the market, they inevitably leave traces. Our task was to learn how to identify these traces and interpret them correctly. Reversal First Impulse levels (RFI)   -  Version MT5                INSTRUCTIONS                 RUS                 ENG                                       R ecommended to use with an indicator   -  
Natürlich, hier ist die Übersetzung in Deutsch: Vorstellung des Astronomie-Indikators für MT4: Dein ultimativer himmlischer Trading-Begleiter Bist du bereit, deine Trading-Erfahrung auf himmlische Höhen zu heben? Suche nicht weiter als unseren revolutionären Astronomie-Indikator für MT4. Dieses innovative Tool übertrifft herkömmliche Trading-Indikatoren und nutzt komplexe Algorithmen, um dir unvergleichliche astronomische Einblicke und präzise Berechnungen zu bieten. Ein Universum an Information
Advanced Supply Demand
Bernhard Schweigert
4.92 (310)
Derzeit 33% Rabatt! Die beste Lösung für jeden Anfänger oder erfahrenen Händler! Dieser Indikator ist ein einzigartiges, qualitativ hochwertiges und erschwingliches Trading-Tool, da wir eine Reihe von proprietären Funktionen und eine neue Formel integriert haben. Mit diesem Update werden Sie in der Lage sein, doppelte Zeitrahmenzonen anzuzeigen. Sie können nicht nur einen höheren TF (Zeitrahmen) anzeigen, sondern sowohl den Chart-TF als auch den höheren TF: SHOWING NESTED ZONES. Alle Supply Dema
TPSproTREND PrO
Roman Podpora
5 (15)
TPSpro TRENDPRO  - is a trend indicator that automatically analyzes the market and provides information about the trend and each of its changes, as well as giving signals for entering trades without redrawing! The indicator uses each candle, analyzing them separately. referring to different impulses - up or down impulse. Exact entry points into transactions for currencies, crypto, metals, stocks, indices!  -  Version MT5               DETAILED DESCRIPTION        /       TRADING SETUPS           
Wir stellen vor       Quantum Trend Sniper Indicator   , der bahnbrechende MQL5-Indikator, der die Art und Weise, wie Sie Trendumkehrungen erkennen und handeln, verändert! Entwickelt von einem Team erfahrener Händler mit über 13 Jahren Handelserfahrung,       Quantum Trend Sniper-Indikator       wurde entwickelt, um Ihre Trading-Reise mit seiner innovativen Methode zur Identifizierung von Trendumkehrungen mit extrem hoher Genauigkeit auf ein neues Niveau zu heben. ***Kaufe Quantum Trend Snipe
Derzeit 20% Rabatt! Die beste Lösung für jeden Neueinsteiger oder Expert Händler! Dieses Dashboard arbeitet mit 28 Währungspaaren. Es basiert auf 2 unserer Hauptindikatoren (Advanced Currency Strength 28 und Advanced Currency Impulse). Es bietet einen hervorragenden Überblick über den gesamten Forex-Markt. Es zeigt die Werte der Advanced Currency Strength, die Veränderungsrate der Währungen und die Signale für 28 Devisenpaare in allen (9) Zeitrahmen. Stellen Sie sich vor, wie sich Ihr Hande
Das technische Handelssystem von BB Reverse Arrows wurde entwickelt, um umgekehrte Punkte für Einzelhandelsentscheidungen vorherzusagen. Die aktuelle Marktsituation wird durch den Indikator analysiert und für mehrere Kriterien strukturiert: die Erwartung von Umkehrmomenten, potenziellen Wendepunkten, Kauf- und Verkaufssignalen. Der Indikator enthält keine überschüssigen Informationen, verfügt über eine visuelle verständliche Schnittstelle, mit der Händler angemessene Entscheidungen treffen k
RelicusRoad Pro
Relicus LLC
4.78 (139)
Jetzt 147 US -Dollar (nach ein paar Aktualisierungen auf 499 US -Dollar) - Unbegrenzte Konten (PCs oder MACs) RelicusRoad Benutzerhandbuch + Schulungsvideos + Zugang zur privaten Discord-Gruppe + VIP-Status EINE NEUE ART, DEN MARKT ZU BETRACHTEN RelicusRoad ist der weltweit leistungsstärkste Handelsindikator für Forex, Futures, Kryptowährungen, Aktien und Indizes und gibt Händlern alle Informationen und Tools, die sie benötigen, um profitabel zu bleiben. Wir bieten technische Analysen un
Entry Points Pro
Yury Orlov
4.7 (225)
Dies ist ein Indikator für MT4, der genaue Signale für den Einstieg in einen Handel ohne Repainting (Neuzeichnen) liefert. Er kann auf alle Finanzwerte angewendet werden: Forex, Kryptowährungen, Metalle, Aktien, Indizes. Er liefert ziemlich genaue Schätzungen und sagt Ihnen, wann es am besten ist, eine Position zu eröffnen und zu schließen. Sehen Sie sich das Video (6:22) mit einem Beispiel für die Verarbeitung nur eines Signals an, das sich für den Indikator gelohnt hat! Die meisten Händler ver
Wir stellen Ihnen ON Trade Waves Patterns Harmonic Elliot Wolfe vor, einen fortschrittlichen Indikator, der entwickelt wurde, um verschiedene Markt-Muster mithilfe sowohl manueller als auch automatischer Methoden zu erkennen. Hier ist, wie er funktioniert: Harmonische Muster: Dieser Indikator kann harmonische Muster erkennen, die auf Ihrem Chart erscheinen. Diese Muster sind für Trader, die die Theorie des harmonischen Handels praktizieren, wie sie in Scott Carney's Buch "Harmonic Trading vol 1
Up down v6T
Guner Koca
5 (1)
Thise indicator is up down v6  comes with tradingwiev pinescript. purchased people, after installed on terminal ,contact me on mql5  to get BONUS  TradingView pinescript. up-down indicator is no repaint and works all pairs and lower than weekly time frames charts. it is suitable also 1 m charts for all pairs. and hold long way to signal. dont gives too many signals. when red histogram cross trigger line that is up signal.and price probably will down when blue histogram cross trigger line that
TrendMaestro
Stefano Frisetti
5 (2)
note: this indicator is for METATRADER4, if you want the version for METATRADER5 this is the link:  https://www.mql5.com/it/market/product/108106 TRENDMAESTRO ver 2.4 TRENDMAESTRO recognizes a new TREND in the bud, he never makes mistakes. The certainty of identifying a new TREND is priceless. DESCRIPTION TRENDMAESTRO identifies a new TREND in the bud, this indicator examines the volatility, volumes and momentum to identify the moment in which there is an explosion of one or more of these data a
FX Power MT4 NG
Daniel Stein
5 (9)
Erhalten Sie Ihr tägliches Marktupdate mit Details und Screenshots über unser Morning Briefing hier auf mql5 und auf Telegram ! FX Power MT4 NG ist die nächste Generation unseres langjährig sehr beliebten Währungsstärkemessers FX Power. Und was bietet dieser Stärkezähler der nächsten Generation? Alles, was Sie am ursprünglichen FX Power geliebt haben PLUS GOLD/XAU-Stärkeanalyse Noch präzisere Berechnungsergebnisse Individuell konfigurierbare Analysezeiträume Anpassbares Berechnungslimit für noc
Connect Indicator
Sukunthakan Ngernbamrung
Connect Indicator is a tool used for connecting indicators between the MQL market and MT4. The connected indicators are made by our group and can be used for other applications, such as sending messages to the Line application or Telegram application. If you have any questions, please don't hesitate to ask us to receive support. Function and indicator buffer Buffer one is the high price of the previous candle. Buffer two is the high price of the previous candle. Usage To connect indicators to fu
Quantum Breakout Indicator PRO
Bogdan Ion Puscasu
4.96 (26)
Wir stellen vor       Quantum Breakout PRO   , der bahnbrechende MQL5-Indikator, der die Art und Weise, wie Sie mit Breakout-Zonen handeln, verändert!   Quantum Breakout PRO   wurde von einem Team erfahrener Händler mit über 13 Jahren Handelserfahrung entwickelt und soll Ihre Handelsreise mit seiner innovativen und dynamischen Breakout-Zonen-Strategie auf ein neues Niveau bringen. Der Quantum Breakout Indicator zeigt Ihnen Signalpfeile auf Breakout-Zonen mit 5 Gewinnzielzonen und Stop-Loss
Scalper Inside PRO
Alexey Minkov
4.75 (57)
An exclusive indicator that utilizes an innovative algorithm to swiftly and accurately determine the market trend. The indicator automatically calculates opening, closing, and profit levels, providing detailed trading statistics. With these features, you can choose the most appropriate trading instrument for the current market conditions. Additionally, you can easily integrate your own arrow indicators into Scalper Inside Pro to quickly evaluate their statistics and profitability. Scalper Inside
FX Volume
Daniel Stein
4.6 (35)
Erhalten Sie Ihr tägliches Marktupdate mit Details und Screenshots über unser Morning Briefing hier auf mql5 und auf Telegram ! FX Volume ist der ERSTE und EINZIGE Volumenindikator, der einen ECHTEN Einblick in die Marktstimmung aus Sicht eines Brokers bietet. Es bietet fantastische Einblicke in die Positionierung von institutionellen Marktteilnehmern, wie z.B. Brokern, auf dem Forex-Markt, viel schneller als COT-Berichte. Diese Informationen direkt auf Ihrem Chart zu sehen, ist der wahre Game
GOLD Impulse with Alert
Bernhard Schweigert
4.56 (9)
Dieser Indikator ist eine hervorragende Kombination aus unseren 2 Produkten Advanced Currency IMPULSE with ALERT  +   Currency Strength Exotics . Es funktioniert für alle Zeitrahmen und zeigt grafisch Impulse der Stärke oder Schwäche für die 8 wichtigsten Währungen plus ein Symbol! Dieser Indikator ist darauf spezialisiert, die Beschleunigung der Währungsstärke für beliebige Symbole wie Gold, Exotische Paare, Rohstoffe, Indizes oder Futures anzuzeigen. Als erster seiner Art kann jedes Sym
EZT Trend
Tibor Rituper
4 (1)
Der EZT-Trendindikator zeigt Ihnen den Trend, den Rückzug und die Einstiegsmöglichkeiten. Optionale Filterung und alle Arten von Warnungen sind verfügbar. E-Mail- und Push-Benachrichtigungsbenachrichtigungen werden hinzugefügt. Wir entwickeln auch einen EA basierend auf diesem Indikator, der bald verfügbar sein wird. Es handelt sich um einen multifunktionalen Indikator, der aus zwei Farbhistogrammen und einer Linie besteht. Es handelt sich um eine visuelle Darstellung der Richtung und Stärke
How to use Pair Trading Station Pair Trading Station is recommended for H1 time frame and you can use it for any currency pairs. To generate buy and sell signal, follow few steps below to apply Pair Trading Station to your MetaTrader terminal. When you load Pair Trading Station on your chart, Pair Trading station will assess available historical data in your MetaTrader platforms for each currency pair. On your chart, the amount of historical data available will be displayed for each currency pai
Pro SMC Tool
The Anh Pham
5 (1)
Welcome to the world of SMC (Smart Money Concepts) Trading, where we empower traders with the tools and knowledge to make smarter trading decisions. Our latest addition to our suite of trading tools is the SMC Trading Pro indicator, version 1.0. Key Features: Major Market Structure Identification with BODY break. Order Block must be in Major Swing ( not Small Swing ). Order Block with Fair Value Gap Detection. Order Block in Discount | Premium zone. Filter for only Bullish, Bearish or All Order
Price Action Entry Alerts
Stephen Sanjeeve Sahayam
5 (3)
Dieser Indikator überprüft jeden Balken auf Kauf- oder Verkaufsdruck und identifiziert 4 Arten von Kerzenmustern mit dem höchsten Volumen. Diese Kerzen werden dann mithilfe mehrerer linearer Filter gefiltert, um Kauf- oder Verkaufssignale anzuzeigen. Signale funktionieren am besten in Verbindung mit einer höheren Zeitrahmenrichtung und wenn sie während der Stunden mit hohem Handelsvolumen gehandelt werden. Alle Filter sind anpassbar und funktionieren unabhängig voneinander. Kann Signale einer e
Best Currency Strength Indicator
Tumelo Patrick Rakotsoane
4.55 (47)
Advanced Currency Strength Indicator The Advanced Divergence Currency Strength Indicator. Not only it breaks down all 28 forex currency pairs and calculates the strength of individual currencies across all timeframes , but, You'll be analyzing the WHOLE forex market in 1 window (In just 1 minute) . This indicator is very powerful because it reveals the true movements of the market.  It is highly recommended to  analyze charts knowing the performance of individual currencies or the countries ec
Smart Ai Levels  Accumulation & Distribution indicator Smart Ai Levels are Ai controlled indicator which is based on Wyckoff Price cycle theory . It automatically scans the Accumulation & Distribution phases on chart and Ai draws the possible areas before Mark up and Mark down which acts as hot zones and can be traded with confirmation to catch those big price movements . It's a great tool for both Reversal and Breakout Trades suitable to all Trading Styles such as Scalping - Intraday - Swing 
NO REPAINT ADVANCED CHART PATTERN INDICATOR By definition, a price ( chart)  pattern is a recognizable configuration of price movement that is identified using a series of  trendlines  and/or curves. When a price pattern signals a change in trend direction, it is known as a reversal pattern; a continuation pattern occurs when the trend continues in its existing direction following a brief pause. Advanced Chart Pattern Tracker is designed to find the MOST ACCURATE patterns. A special script is
MAJOR CHANGES HAS BEEN MADE. Parameter description will be changed. EXPECT ANOTHER UPDATE BEFORE JUNE ENDS. PRICE WILL GO UP AFTER THE FINAL UPDATE. True Currency Meter with Email and SMS push notifications! Have you ever wondered why would some pairs would move more than others, and 100 pips on EURGBP is bigger than 100 pips on EURUSD? And during the news, some would move 200 pips but some would only move 150 pips? This is the key to the newly developed "28 pairs" True Currency Strength Met
Allows multiple indicators to be combined into a single indicator, both visually and in terms of an alert. Indicators can include standard indicators, e.g. RSI, CCI, etc., and also Custom Indicators, even those purchased through Market, or where just have the ex4 file. An early alert is provided, say when 4 out 5 indicators have lined up, and a confirmed alert when all are in agreement. A‌lso features a statistics panel reporting the success of the combined indicator by examining the current cha
Cycle Sniper
Elmira Memish
4.39 (36)
NEW YEAR SALE PRICE FOR LIMITED TIME!!! Please contact us after your purchase and we will send you the complimentary indicators to complete the system Cycle Sniper is not a holy grail but when you use it in a system which is explained in the videos, you will feel the difference. If you are not willing to focus on the charts designed with Cycle Sniper and other free tools we provide, we recommend not buying this indicator. We recommend watching the videos about the indiactor and system before pu
TakePropips Donchian Trend Pro
Eric John Pajarillaga Aldana
4.82 (17)
TakePropips Donchian Trend Pro   (MT4) ist ein leistungsstarkes und effektives Tool, das mithilfe des Donchian-Kanals automatisch die Richtung des Trends erkennt und Ihnen Handelssignale für den Ein- und Ausstieg liefert! Dieser Multifunktionsindikator umfasst einen Trendscanner, Handelssignale, ein statistisches Panel, einen Screener, Handelssitzungen und ein Dashboard für den Verlauf von Warnungen. Es wurde entwickelt, um Ihnen Handelssignale zu liefern und Ihnen Stunden beim Analysieren der C
Weitere Produkte dieses Autors
1. Compound Drawings (1) Line segment with arrow (2) Continuous line segment (broken line) (3) Parallelogram (4) Polygon (5) Profit and loss ratio measurement tools 2.   Backtracking  By the Z key  in the process of drawing the line Line types that support Z-key backtracking: continuous line segments (broken line) ,channels,parallelograms,polygons, and fibo extensions. 3.Automatic Adsorption (1) Click the "Lock-Button" to switch the automatic adsorption switch before drawing the line (2)
Part One : Characteristics Integrated line drawing and wave marking function Automatic adsorption( namely Auto Search High/Low )during Drawing Draw zigzag Lines and Fibo/Expansion at the same time Calculate the scale rate of  Interval Spans which is called Qjt for short Continuously delete objects by click Deleting drawings in batch Show/Hide Drawings and Wave-Marks Quickly save current chart as picture to certain folder Show/Hide main panel by  click certain zone of PriceAxis or by hotkey W Swi
LuXiwu Trend Trading  special wave marking tool 0.Main table show hide Click the  bottom  10% area of price axis to show or hide main table,or by default key Q. 1. QJT search Click the high or low point of the main wave to automatically find the QJT . If there is overlap between the inner and outer intervals, click the button << or >> to adjust the left and right, or manually drag the adjustment after completion.If there is a failure wave, you can use the system's own trend line to draw the
注意️测试模式并不能完全正常运行 所以那个免费模拟是个摆设 和实际效果相差甚远 实际效果比GIF图片里面要流畅不存在卡顿和性能问题 十年前的i3都没有任何压力 ____ 由于MT5的画线功能比较基础,迈达克官方也无意改进升级,但是后起之秀TradingView的出现极大拓展了画线分析部分的功能 (当然TV的优势远不止于此),甚至国内的很多看盘软件的画线功能也比MT4原生的画线功能要强大。当然市面上传播的画线工具肯定也是有很多的包括五年前我写的一些相对简单的工具。 但是现存的所有加起来也无法和便捷画线工具第三版相提并论,这是MT史上最强的画线工具没有之一,这是使用画线工具的朋友给出的评价。 本工具初版5-6千行代码,经过一年的升级优化写到第三版已经超过2万行代码(当然空行大括号和注释的占比也不会很低估计在10-20%左右我的代码很规范 每一个变量都不会瞎命名也不会对只用得到一两次的功能单独写一个函数当然也不会在需要反复调用的时候一遍遍复制雷同代码),最终功能呈现就是本文档所见这样几十个功能改进当然有些细节本文档也没有具体讲需要用户观看讲解视频学习使用。 ____ 本工具细
Auswahl:
Keine Bewertungen
Antwort auf eine Rezension