• Übersicht
  • Bewertungen
  • Diskussion
  • Neue Funktionen

MultiFractal

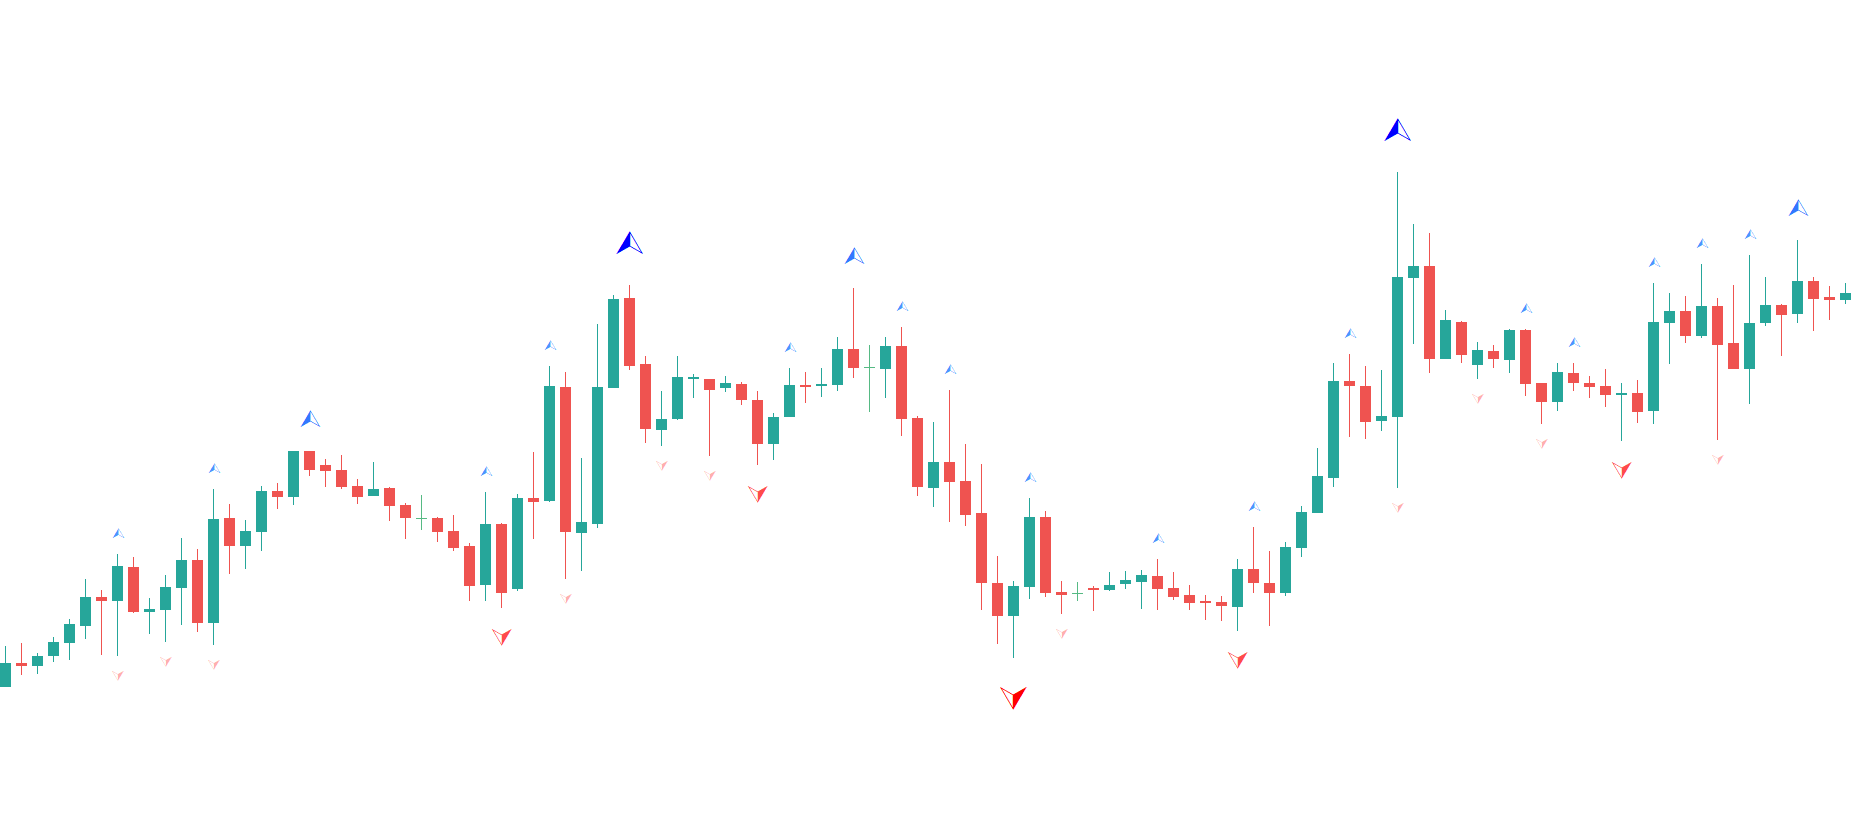
MultiFractal ist ein modifizierter Fraktalindikator von Bill Williams, ergänzt durch Fraktale höherer Ordnung, deren Unterschied vier beträgt, ähnlich wie bei einer Änderung des Zeitrahmens.

Vorteile gegenüber der Original-Terminalanzeige:

  • Bequemlichkeit
  • Sichtweite
  • Informationsgehalt

Der Indikator ist praktisch, da Sie beim Arbeiten nicht zwischen verschiedenen Zeitrahmen wechseln müssen.

Sichtbarkeit – in einem Diagramm können Sie die Struktur des Diagramms von kleineren über mittlere bis hin zu großen Marktbewegungen sehen.

Informationsgehalt – visuell erhalten wir mehr Informationen über die Grafiken.

Jetzt verfügen alle Handelsstrategien, die auf dem MultiFractal-Indikator basieren oder darauf basieren, über ein zusätzliches Signal.
Darüber hinaus können Fraktale, wie Sie wissen, als Unterstützungs- und Widerstandsniveaus fungieren. Und in einigen Handelsstrategien zeigen Sie Liquiditätsniveaus an.

Ich wünsche Ihnen große Gewinne beim Trading.

Empfohlene Produkte
Contact me for instruction, any questions! Introduction The Elliott Wave in technical analysis describes price movements in the financial market that are related to changes in trader sentiment and psychology. The 5 W Pattern (Known as 3 Drives) is an Elliott Wave pattern that is formed by 5 consecutive symmetrical moves up or down. In its bullish form, the market is making 5 drives to a bottom before an uptrend forms. In a bearish 5-drive, it is peaking before the bears take over.  5W Pattern S
The rubdfx divergence indicator is a technical analysis tool that compares a security's price movement. It is used to identify potential changes in the price trend of a security. The indicator can be applied to any type of chart, including bar charts and candlestick charts. The algorithm is based on MACD, which has been modified to detect multiple positive and negative divergences. Settings  ___settings___ * fastEMA * slowEMA * signalSMA *Alerts:   True/False     #Indicator Usage B
Market Entropy
Elian Isaac Rodrigues Oliveira
The Market Entropy indicator was created to measure the order of price changes over time. consists of two lines and a histogram where the lines are responsible for measuring the price movement and the histogram measures the strength of the analyzed movement. It can be used to find a trend (Image 2) or price reversal (Image 3). Blue Line: Buy Entropy Red Line: Sell Entropy Historgram: Market Entropy Interpretation: Buy Line above the Sell Line indicates that in the analyzed period buyers wer
"GoldenSwing" is a comprehensive MetaTrader 5 indicator meticulously crafted by Southern Star Trading, designed to enhance your trading strategies with precision swing high and swing low identification. Harnessing the power of swing analysis, this indicator provides traders with invaluable insights into market reversals and trend continuations, enabling them to make informed trading decisions. With its advanced algorithm, GoldenSwing detects significant swing highs and swing lows in real-time
This indicator scans the 1-3 Trendline pattern . The indicator is a 100 % non repaint low risk breakout system . The patterns are formed around swing high and swing lows which make them a low risk pattern with high reward. PATTERN BACKGROUND The 1-3 Trendline Breakout pattern is formed by four(4) points which are composed of three (3) primary points and the pattern neck. A trendline is always formed by the point 1 and the neck of the pattern . When price breaks out of the trendline formed ,
Технический индикатор Universal Oscillator является комбинацией торговых сигналов самых популярных и широко используемых осцилляторов. Индикатор представлен гистограммами, а также линиями fast и slow MA, что позволяет расширить список получаемых торговых рекомендаций и работать как по тренду, так и в боковом движении рынка. Таким образом, гистограммы позволяют определить момент пробоя ценовых значений и движение в новой фазе рынка, а линии указывают на зоны перекупленности и перепроданности.  Ос
Linear Regressions Convergence Divergence is an oscillator indicator of a directional movement plotted as a difference of two linear regressions with lesser and greater periods. This is a further development of the ideas implemented in the standard MACD oscillator. It has a number of advantages due to the use of linear regressions instead of moving averages. The indicator is displayed in a separate window as a histogram. The signal line is a simple average of the histogram. The histogram value a
Liga
Andriy Sydoruk
The indicator connects the price in a cyclical-wave relationship. Thus, all intersection points will be optimal points at which the movement changes taking into account the indicator period. Crossing points can be used as potential market reversal points. But do not forget that the approach must be complex, the indicator signals require additional information to enter the market. Suitable for forex, futures and binary options without redrawing. It gives a lot of signals, which requires additi
The SuperTrend indicator is great for trend trading, determining price levels and patterns, and allows you to find the trend reversal point in a timely manner. This indicator is an analog of the Tradingview platform indicator of the Pine Script language. It can be used both as the main tool in the strategy, and together with other indicators. Input parameters: input int       AtrPeriod = 10 ; input double    Factor    = 3.0 ;
FREE
The indicator is similar to https://www.mql5.com/en/market/product/12330 . However, it considers the MQL5 platform features. Peaks and bottoms are calculated based solely on external bars. After a swing is formed, the indicator does not redraw providing opportunities for traders working on horizontal level breakthroughs. Traffic can be reduced by changing the amount of calculated bars in the MinBars variable (default value is 500). All you need is to select the output options, so that you can se
The Trend Complete indicator is a signal indicator and has interesting properties. It should be taken into account that this indicator reflects extremes and should be used as an additional one, and another instrument should be used for the entry point. Searches for and displays pivot points on the price chart. Trend indicators are one of the main tools for analyzing trends in the Forex market. The indicator is able to transmit all types of signals to the user: messages, E-mail and Push! The g
神奇九转, 顾名思义就是每当出现数字9时,行情就很大的几率会发生逆转,这时应该注意止盈。是一个很有效的指标。 在序列显示和形成过程中,一旦出现不符合触发条件的情况,则前面序列数字消失,本次九转序列结构不存在。如果连续九天都达到触发条件,九转序列结构形成,价格走势可能发生反转。 九转序列可分为上升九转结构和下降九转结构,也就是九转序列在买多和买空以及判断各种走势反转是都可以使用。 九转序列买入建仓,即下降九转序列结构形成时,价格走势将要发生转变,考虑建仓买入。 买入条件:连续出现九根K线,并且满足收盘价都低于前一根K线收盘价,当第8、9根K线满足上述条件时,九转序列形成,投资者准备买入建仓。 使用分时九转时需要注意两点: 1、极端行情时(连续上涨或下跌),九转序列失效; 2、当九转序列完全形成时,再进场操作(尤其不用刚出现数字8或9就入场,一定要完全形成之后才可以。)
Fib Auto Trendline
Nhlanhla Brilliant Mashavha
INTRODUCTION The  Fib Autotrendline   is a basic tool that analysts use to find out when a security's trend is reversing. By determining the   support and resistance areas , it helps to identify significant changes in price while filtering out short-term fluctuations, thus eliminating the noise of everyday market conditions. It is an excellent tool for any trader who follows indicators that use   swing highs  and   swing lows . How to Use the fib Auto Trendline Indicator The Fib Auto Trendline
With this easy to set up indicator you can display and set alerts for the following candlestick formations: Bull Breakout, Bear Breakout, Hammer, Pin, Bullish Engulfing, Bearish Engulfing. Input parameters: ShortArrowColor: The color of the Arrows, displaying a Bearish candle formation LongArrowColor: The color of the Arrows displaying a Bullish candle formation BullishEngulfing: Disabled/Enabled/EnabledwithAlert BearishEngulfing: Disabled/Enabled/EnabledwithAlert Pin:  Disabled/Enabled/Enabledw
FREE
DWMACD
Roman Sukhorukov
DWMACD - Divergence Wave MACD . The indicator displays divergences by changing the color of the MACD histogram. The indicator is easy to use and configure. For the calculation, a signal line or the values ​​of the standard MACD histogram can be used. You can change the calculation using the UsedLine parameter. It is advisable to use a signal line for calculation if the histogram often changes directions and has small values, forming a kind of flat. To smooth the histogram values ​​set the signa
The indicator determines the state of the market: trend or flat. The state of the market is determined by taking into account volatility. The flat (trading corridor)is displayed in yellow. The green color shows the upward trend. The red color shows the downward trend. The height of the label corresponds to the volatility in the market. The indicator does not redraw . Settings History_Size   - the amount of history for calculation. Period_Candles  - the number of candles to calculate the
This indicator watch the Fibonacci retracement for levels and timeframes selected by the trader. In the workload of day trading, having your eyes on all the timeframes to validate some information, for Fibonacci traders, is really time consuming and requires constant focus.  With this in mind, this tool allows you to have your attention on other trading details while this one monitors the retracements of each timeframe in real time. In the charts, this indicator data (retracement %, age of the r
An customize Indicator by which you can have Triple moving averages at close prices and send push notification on each crossing.  This indicator is especially useful when you are doing manual trading. Notes: Cation: forex trading is a very risky business,...              don't invest the money you cannot bear to lose.             the probability of losing is high ... more high aaaand exponentially high.... something like EMA enjoy losing with us...
Indicator Name : Fourier Transform Curve Indicator Description : The Fourier Transform Curve Indicator for MetaTrader 5 is a powerful tool that leverages Fourier analysis to depict curves directly on your price chart. It is designed to provide valuable insights into the underlying harmonic components of the price data. Parameters : Input Candle Count : This parameter allows you to specify the number of candles to include in the Fourier transformation calculation. A higher value will capture lon
This is a well-known ZigZag indicator. But it differs by the fact that its plot is based on values of the middle line which is set by a user. It can display Andrews’ Pitchfork and standard or Bobokus Fibo levels. NO REPAINTING. Parameters Period МА — middle line period. Default value is 34. Minimum value is 4. Maximum value is set at your discretion. Used to calculate price — type of price used for the midline calculations. The averaging method — type of smoothing for the middle line. Turning
Renko System
Marco Montemari
This indicator can be considered as a trading system. It offers a different view to see the currency pair: full timeless indicator, can be used for manual trading or for automatized trading with some expert advisor. When the price reaches a threshold a new block is created according to the set mode. The indicator beside the Renko bars, shows also 3 moving averages. Features renko mode median renko custom median renko 3 moving averages wicks datetime indicator for each block custom notificatio
Price Stelar
Ignacio Agustin Mene Franco
Price Stellar! is a bot that has the strategy of grabbing rebounds on the roofs or floors of the Yellow channel, accompanying an ema to hunt the bullish or bearish trend, It can be seen very clearly in the photo what the strategy is about works for all seasons to scalp and long works for all forex pairs and for the pairs of synthetic indices ! from now to enjoy good profit World Investor.
Trend and Signals MT5  indicator scans  30 trading Instruments (Forex, Metals and Indices).     It uses special algorithm on the  current market   based on   Pure Price Action   and display the overall trend and signal on the dashboard. When signals are produced the indicator sends alert and notification. Strategy for Signals This indicator uses the daily timeframe to determine the direction of the trend. The hourly timeframe is used to identify possible entries. Main trend and is determined by
Gekko MACD Plus
Rodrigo Galeote
3 (3)
Type: Oscillator This is Gekko's Cutomized Moving Average Convergence/Divergence (MACD), a customized version of the famous MACD indicator. Use the regular MACD and take advantage of several entry signals calculations and different ways of being alerted whenever there is potential entry point. Inputs Fast MA Period: Period for the MACD's Fast Moving Average (default 12); Slow MA Period: Period for the MACD's Slow Moving Average (default 26); Signal Average Offset Period: Period for the Signal
Fibonacci sequence is defined by integer sequence: 0, 1, 1, 2, 3, 5, 8, 13, 21, 34, 55, 89, 144, ... By definition, it starts from 0 and 1, the next number is calculated as a sum of two previous numbers. Instead of the standard moving average, the indicator uses the following calculation of average price: Bar0 + Bar1 + Bar2 + Bar3 + Bar5 + Bar8 + Bar13 + Bar21 + ... Input parameters: fiboNum - numbers in the following integer sequence for Fibo Moving Average 1. 5 on default. fiboNum2 - numbers i
The new update makes this indicator a complete tool for studying, analyzing and operating probabilistic patterns. It includes: On-chart Multi-asset percentage monitor. Configurable martingales. Twenty-one pre-configured patterns, including Mhi patterns and C3. An advanced pattern editor to store up to 5 custom patterns. Backtest mode to test results with loss reports. Trend filter. Hit operational filter. Martingale Cycles option. Various types of strategies and alerts. Confluence between patter
Hunter trend
Yaroslav Varankin
Hunter Trend: Arrow Indicator for Binary Options Trading Hunter Trend is an arrow indicator designed for trading binary options (turbo options) on the M1 timeframe, allowing for short-term trading opportunities. How to Trade with this Tool: Signals may appear when a candlestick forms. Once such a signal appears, wait for the closure of that candlestick. Upon the opening of a new candlestick, open a trade for 1-2 candlesticks in the indicated direction. In this case, for 1-2 minutes. A blue dot
Секвента Демарка (Sequential) - индикатор, демонстрирующий развитие тренда, его структуру. Довольно точно отображает начальную и конечную точки, важные точки перелома. Срабатывает по открытию свечи, поэтому перерисовок не будет никогда. Здесь нет сложных формул, только статистика, отсчёт свечей, выбранных по определённым критериям. При этом индикатор может давать очень точные сигналы для входа, особенно при поддержке какого-нибудь индикатора уровней, например, этого . Алгоритм нахождения сигнал
Description The base of this indicator is an ZigZag algorithm based on ATR and Fibo retracement. The ZigZag can be drawn like a classic ZigZag or like Arrows or needn't be drawn at all. This indicator is not redrawing in sense that the ZigZag's last shoulder is formed right after the appropriate conditions occur on the market. The shoulder doesn't change its direction afterwards (can only continue). There are some other possibilities to show advanced information in this indicator: Auto Fibo on
Volume Waves
Paulo Henrique Faquineli Garcia
One of the best tools for analyzing volume, Weis Wave was devised by David Weis to facilitate reading the directional flow. For the disciples of the Wyckoff method, this means an evolution, facilitating a predictive reading of the market, always looking for Accumulation and Distribution zones for traded assets. For better understanding, in this indicator we try to cover every reading of EFFORT (traded volume) versus RESULT (price change). Thus, you can apply the indicator on the chart twice
Käufer dieses Produkts erwarben auch
Zunächst einmal ist es wichtig zu betonen, dass dieses Handelssystem ein Nicht-Repainting-, Nicht-Redrawing- und Nicht-Verzögerungsindikator ist, was es sowohl für manuelles als auch für automatisches Trading ideal macht. Das "Smart Trend Trading System MT5" ist eine umfassende Handelslösung, die für neue und erfahrene Trader maßgeschneidert ist. Es kombiniert über 10 Premium-Indikatoren und bietet mehr als 7 robuste Handelsstrategien, was es zu einer vielseitigen Wahl für verschiedene Marktbe
Atomic Analyst MT5
Issam Kassas
4.82 (11)
Zunächst einmal ist es erwähnenswert, dass dieser Handelsindikator nicht neu malt, nicht neu zeichnet und keine Verzögerung aufweist, was ihn sowohl für manuellen als auch für Roboterhandel ideal macht. Der Atom-Analyst ist ein PA-Preisaktionsindikator, der die Stärke und das Momentum des Preises nutzt, um einen besseren Vorteil auf dem Markt zu finden. Ausgestattet mit fortschrittlichen Filtern, die helfen, Rauschen und falsche Signale zu entfernen, und das Handelspotenzial zu erhöhen. Durch
FX Volume MT5
Daniel Stein
4.94 (17)
Erhalten Sie Ihr tägliches Marktupdate mit Details und Screenshots über unser Morning Briefing hier auf mql5 und auf Telegram ! FX Volume ist der ERSTE und EINZIGE Volumenindikator, der einen ECHTEN Einblick in die Marktstimmung aus Sicht eines Brokers bietet. Es bietet fantastische Einblicke in die Positionierung von institutionellen Marktteilnehmern, wie z.B. Brokern, auf dem Forex-Markt, viel schneller als COT-Berichte. Diese Informationen direkt auf Ihrem Chart zu sehen, ist der wahre Game
Quantum Trend Sniper
Bogdan Ion Puscasu
5 (37)
Wir stellen vor       Quantum Trend Sniper Indicator   , der bahnbrechende MQL5-Indikator, der die Art und Weise, wie Sie Trendumkehrungen erkennen und handeln, verändert! Entwickelt von einem Team erfahrener Händler mit über 13 Jahren Handelserfahrung,       Quantum Trend Sniper-Indikator       wurde entwickelt, um Ihre Trading-Reise mit seiner innovativen Methode zur Identifizierung von Trendumkehrungen mit extrem hoher Genauigkeit auf ein neues Niveau zu heben. ***Kaufe Quantum Trend Snipe
Trend Screener Pro MT5
STE S.S.COMPANY
4.89 (61)
Nutzen Sie die Macht des Trendhandels mit Trend Screener Indicator: Ihrer ultimativen Trendhandelslösung, die auf Fuzzy-Logik und einem System mit mehreren Währungen basiert! Steigern Sie Ihren Trendhandel mit Trend Screener, dem revolutionären Trendindikator mit Fuzzy-Logik. Es handelt sich um einen leistungsstarken Trendfolgeindikator, der über 13 Premium-Tools und -Funktionen sowie 3 Handelsstrategien kombiniert und ihn zu einer vielseitigen Wahl macht, um Ihren Metatrader in einen Trendanaly
FX Power MT5 NG
Daniel Stein
5 (4)
Erhalten Sie Ihr tägliches Marktupdate mit Details und Screenshots über unser Morning Briefing hier auf mql5 und auf Telegram ! FX Power MT5 NG ist die nächste Generation unseres langjährig sehr beliebten Währungsstärkemessers FX Power. Und was bietet dieser Stärkezähler der nächsten Generation? Alles, was Sie am ursprünglichen FX Power geliebt haben PLUS GOLD/XAU-Stärkeanalyse Noch präzisere Berechnungsergebnisse Individuell konfigurierbare Analysezeiträume Anpassbares Berechnungslimit für noc
Dies ist ein Indikator für MT5, der genaue Signale für den Einstieg in einen Handel ohne Repainting (Neuzeichnen) liefert. Er kann auf alle Finanzwerte angewendet werden: Forex, Kryptowährungen, Metalle, Aktien, Indizes. Er liefert ziemlich genaue Schätzungen und sagt Ihnen, wann es am besten ist, eine Position zu eröffnen und zu schließen. Sehen Sie sich das Video (6:22) mit einem Beispiel für die Verarbeitung nur eines Signals an, das sich für den Indikator gelohnt hat! Die meisten Händler ver
Zunächst einmal ist es wichtig zu betonen, dass dieses Handelstool ein Nicht-Repaint-, Nicht-Redraw- und Nicht-Verzögerungsindikator ist, was es ideal für professionelles Trading macht. Der Smart Price Action Concepts Indikator ist ein sehr leistungsstarkes Werkzeug sowohl für neue als auch erfahrene Händler. Er vereint mehr als 20 nützliche Indikatoren in einem und kombiniert fortgeschrittene Handelsideen wie die Analyse des Inner Circle Traders und Strategien des Smart Money Concepts. Diese
RelicusRoad Pro MT5
Relicus LLC
4.82 (22)
Jetzt 147 US -Dollar (nach ein paar Aktualisierungen auf 499 US -Dollar) - Unbegrenzte Konten (PCs oder MACs) RelicusRoad Benutzerhandbuch + Schulungsvideos + Zugang zur privaten Discord-Gruppe + VIP-Status EINE NEUE ART, DEN MARKT ZU BETRACHTEN RelicusRoad ist der weltweit leistungsstärkste Handelsindikator für Forex, Futures, Kryptowährungen, Aktien und Indizes und gibt Händlern alle Informationen und Tools, die sie benötigen, um profitabel zu bleiben. Wir bieten technische Analysen un
Auto Order Block with break of structure based on ICT and Smart Money Concepts Futures Break of Structure ( BoS )             Order block ( OB )            Higher time frame Order block / Point of Interest ( POI )    shown on current chart           Fair value Gap ( FVG ) / Imbalance   ,  MTF      ( Multi Time Frame )    Volume Imbalance     ,  MTF          vIMB Gap’s Equal High / Low’s     ,  MTF             EQH / EQL Liquidity               Current Day High / Low           HOD /
XQ Indicator MetaTrader 5
Marzena Maria Szmit
5 (1)
Step into the realm of Forex trading with confidence and precision using XQ, a cutting-edge Forex indicator designed to elevate your trading game to unprecedented heights. Whether you're a seasoned trader or just stepping into the world of currency exchange, XQ Forex Indicator empowers you with the insights and signals needed to make informed trading decisions. The signal conditions are a combination of three indicators, and XQ Forex Indicator only display  medium and long-term trends . The ind
Blahtech Supply Demand MT5
Blahtech Limited
4.57 (14)
Was: $299  Now: $99   Supply Demand uses previous price action to identify potential imbalances between buyers and sellers. The key is to identify the better odds zones, not just the untouched ones. Blahtech Supply Demand indicator delivers functionality previously unavailable on any trading platform. This 4-in-1 indicator not only highlights the higher probability zones using a multi-criteria strength engine, but also combines it with multi-timeframe trend analysis, previously confirmed swings
Advanced Supply Demand MT5
Bernhard Schweigert
4.53 (15)
Derzeit 33% Rabatt! Die beste Lösung für jeden Anfänger oder erfahrenen Händler! Dieser Indikator ist ein einzigartiges, qualitativ hochwertiges und erschwingliches Trading-Tool, da wir eine Reihe von proprietären Funktionen und eine neue Formel integriert haben. Mit diesem Update werden Sie in der Lage sein, doppelte Zeitrahmenzonen anzuzeigen. Sie können nicht nur einen höheren TF (Zeitrahmen) anzeigen, sondern sowohl den Chart-TF als auch den höheren TF: SHOWING NESTED ZONES. Alle Supply Dema
AW Trend Predictor MT5
AW Trading Software Limited
4.76 (54)
Die Kombination von Trend- und Aufschlüsselungsebenen in einem System. Ein fortschrittlicher Indikatoralgorithmus filtert Marktrauschen, bestimmt den Trend, Einstiegspunkte sowie mögliche Ausstiegsniveaus. Indikatorsignale werden in einem Statistikmodul aufgezeichnet, das es Ihnen ermöglicht, die am besten geeigneten Tools auszuwählen, die die Wirksamkeit der Signalhistorie zeigen. Der Indikator berechnet Take-Profit- und Stop-Loss-Marken. Handbuch und Anleitung ->   HIER   / MT4-Version ->   H
ICT, SMC, SMART MONEY CONCEPTS, SMART MONEY, Smart Money Concept, Support and Resistance, Trend Analysis, Price Action, Market Structure, Order Blocks, BOS/CHoCH,   Breaker Blocks ,  Momentum Shift,   Supply&Demand Zone/Order Blocks , Strong Imbalance,   HH/LL/HL/LH,    Fair Value Gap, FVG,  Premium  &   Discount   Zones, Fibonacci Retracement, OTE, Buy Side Liquidity, Sell Side Liquidity, BSL/SSL Taken, Equal Highs & Lows, MTF Dashboard, Multiple Time Frame, BigBar, HTF OB, HTF Market Structure
TPSpro TRENDPRO  - is a trend indicator that automatically analyzes the market and provides information about the trend and each of its changes, as well as giving signals for entering trades without redrawing! The indicator uses each candle, analyzing them separately. referring to different impulses - up or down impulse. Exact entry points into transactions for currencies, crypto, metals, stocks, indices!  -  Version MT4                  DETAILED DESCRIPTION        /       TRADING SETUPS       
Der Gann Square Indikator ist ein leistungsstolles Marktanalyse-Tool, das auf dem Artikel "Mathematische Formel für Marktvorhersagen" von W.D. Gann basiert. Dieses Tool verwendet mathematische Konzepte und Gann-Theorien für eine präzise Marktanalyse. Es beinhaltet Quadratwerte von 144, 90, 52 und auch das Quadrat von 9. Darüber hinaus integriert es die Methode von  zur Quadratwurzel von 9 und deren Beziehung zu Kanälen und dem Sternmuster. Benutzerhandbuch und Anwendung: Vor der Verwendung diese
Werden Sie Breaker Trader und profitieren Sie von Änderungen der Marktstruktur, wenn sich der Preis umkehrt. Der Order Block Breaker Indikator zeigt an, wann sich eine Trend- oder Preisbewegung der Erschöpfung nähert und bereit ist, sich umzukehren. Es weist Sie auf Änderungen in der Marktstruktur hin, die normalerweise auftreten, wenn eine Umkehrung oder ein größerer Rückzug bevorsteht. Der Indikator verwendet eine proprietäre Berechnung, die Ausbrüche und Preisdynamik identifiziert. Jedes
Zeichnen Sie automatisch Unterstützungs- und Widerstandsniveaus PLUS Antriebskerzenlücken auf Ihrem Chart ein, so dass Sie sehen können, wohin sich der Preis wahrscheinlich als Nächstes bewegen und/oder möglicherweise umkehren wird. Dieser Indikator wurde entwickelt, um als Teil der Positionshandelsmethodik verwendet zu werden, die auf meiner Website (The Market Structure Trader) gelehrt wird, und zeigt Schlüsselinformationen für die Zielsetzung und potenzielle Einstiege an. MT4 Version:  htt
A key element in trading is zones or levels from which decisions to buy or sell a trading instrument are made. Despite attempts by major players to conceal their presence in the market, they inevitably leave traces. Our task was to learn how to identify these traces and interpret them correctly. Reversal First Impulse levels (RFI)   -  Version MT4                  INSTRUCTIONS                 RUS                 ENG                         R ecommended to use with an indicator   -  TREND PRO  
Wir stellen vor       Quantum Breakout PRO   , der bahnbrechende MQL5-Indikator, der die Art und Weise, wie Sie mit Breakout-Zonen handeln, verändert! Entwickelt von einem Team erfahrener Händler mit über 13 Jahren Handelserfahrung,       Quantum Breakout PRO       ist darauf ausgelegt, Ihre Handelsreise mit seiner innovativen und dynamischen Breakout-Zone-Strategie auf ein neues Niveau zu heben. Der Quantum Breakout Indicator zeigt Ihnen Signalpfeile auf Breakout-Zonen mit 5 Gewinnzielzone
The Volume by Price Indicator for MetaTrader 5 features Volume Profile and Market Profile TPO (Time Price Opportunity). Get valuable insights out of currencies, equities and commodities data. Gain an edge trading financial markets. Volume and TPO histogram bar and line charts. Volume Footprint charts. TPO letter and block marker charts including split structures. Versatile segmentation and compositing methods. Static, dynamic and flexible ranges with relative and/or absolute visualizations. Lay
Owl Smart Levels MT5
Sergey Ermolov
4.47 (36)
MT4-Version  |  FAQ Der Owl Smart Levels Indikator ist ein komplettes Handelssystem innerhalb eines Indikators, der so beliebte Marktanalysetools wie die fortschrittlichen Fraktale von Bill Williams , Valable ZigZag, das die richtige Wellenstruktur des Marktes aufbaut, und Fibonacci-Levels , die die genauen Einstiegslevels markieren, enthält in den Markt und Orte, um Gewinne mitzunehmen. Detaillierte Strategiebeschreibung Anleitung zur Verwendung des Indikators Berater-Assistent im Handel Owl H
TrendLine PRO MT5
Evgenii Aksenov
4.78 (49)
The Trend Line PRO indicator is an independent trading strategy. It shows the trend change, the entry point to the transaction, as well as automatically calculates three levels of Take Profit and Stop Loss protection Trend Line PRO is perfect for all Meta Trader symbols: currencies, metals, cryptocurrencies, stocks and indices Advantages of Trend Line PRO Never redraws its signals The possibility of using it as an independent strategy It has three automatic levels Take Profit and Stop Loss lev
Gartley Hunter Multi
Siarhei Vashchylka
5 (5)
Gartley Hunter Multi - An indicator for searching for harmonic patterns simultaneously on dozens of trading instruments and on all classic timeframes: (m1, m5, m15, m30, H1, H4, D1, Wk, Mn). Manual (Be sure to read before purchasing) | Version for MT4 Advantages 1. Patterns: Gartley, Butterfly, Shark, Crab. Bat, Alternate Bat, Deep Crab, Cypher 2. Simultaneous search for patterns on dozens of trading instruments and on all classic timeframes 3. Search for patterns of all possible sizes. Fr
Trend Line Map Pro MT5
STE S.S.COMPANY
4.67 (9)
Trend Line Map Indicator ist ein Add-On für Trend Screener Indicator. Es arbeitet als Scanner für alle Signale, die vom Trendscreener (Trendliniensignale) erzeugt werden. Es ist ein Trend Line Scanner basierend auf dem Trend Screener Indicator. Wenn Sie keinen Trend Screener Pro Indicator haben, funktioniert die Trend Line Map Pro nicht. It's a Trend Line Scanner based on Trend Screener Indicator. If you don't have Trend Screener Pro Indicator,     the Trend Line Map Pro will not work .
TrendDecoder Premium MT5
Christophe, Pa Trouillas
5 (1)
Top bewertet auf anderem MarketPlace -  Jetzt verfügbar auf METATRADER Identifizieren Sie Bereiche und die nächsten wahrscheinlichen Bewegungen     |    Erhalten Sie früheste Signale und die Stärke von Trends     |    Klare Ausstiegssignale vor Umkehrung     |    Erkennen Sie die Fibo-Levels, die der Kurs testen wird    |  Indikator, der nicht zurückverfolgt, nicht verzögert - ideal für den manuellen und automatisierten Trading - geeignet für alle Vermögenswerte und Zeiteinheiten - 50% Rabatt  
MetaBands M5
Vahidreza Heidar Gholami
4.67 (3)
MetaBands verwendet leistungsstarke und einzigartige Algorithmen, um Kanäle zu zeichnen und Trends zu erkennen, sodass es Tradern potenzielle Punkte für den Einstieg und Ausstieg aus Trades bieten kann. Es ist ein Kanalindikator sowie ein leistungsstarker Trendindikator. Es umfasst verschiedene Arten von Kanälen, die einfach durch Verwendung der Eingabeparameter zusammengeführt werden können. MetaBands verwendet alle Arten von Warnmeldungen, um Benutzer über Marktereignisse zu informieren. Funkt
Was: $249  Now: $99   Market Profile defines a number of day types that can help the trader to determine market behaviour. A key feature is the Value Area, representing the range of price action where 70% of trading took place. Understanding the Value Area can give traders valuable insight into market direction and establish the higher odds trade. It is an excellent addition to any system you may be using. Inspired by Jim Dalton’s book “Mind Over Markets”, this indicator is designed to suit the
Der Forex TPA Indikator deckt die wahren Aktionen der Marktmacher auf, immer dann wenn sie passieren. "Kämpfe nicht gegen die Marktmacher an, sondern folge ihnen", ist wohl der beste Rat, den ein Trader bekommen kann. Der TPA Indikator zeigt jedesmal seine Signale an wenn die Bullen definitiv stärker sind als die Bären und umgekehrt. Dieser Indikator wurde VON Tradern FÜR Trader gemacht und ist 100% NICHT NACHZEICHNEND! Signale werden STRENG am Schluss einer Kerze  generiert. Das sagen unsere Ku
Weitere Produkte dieses Autors
TimeBar
Ivan Butko
5 (1)
TimeBar TimeBar ist ein einfacher Informationsindikator, der die verbleibende Zeit bis zum Schließen des Balkens sowie die seit dem Öffnen des Balkens verstrichene Zeit und die aktuelle Uhrzeit anzeigt. Zur besseren Übersichtlichkeit wurden zwei Arten von Anzeigemodi hinzugefügt: in Form eines Kommentars in der oberen linken Ecke des Diagramms oder in Form eines grafischen Objekts. Vorteile Auswahl der Schriftart Schriftgröße. Sie können eine beliebige festlegen. Beim Kommentieren ist es zu k
FREE
Der Palantir-Indikator sagt eine Preisumkehr um die vom Benutzer in den Einstellungen angegebene Anzahl von Punkten voraus. Sie wählen die Größe des Trends aus, an dem Sie interessiert sind, und der Indikator sagt voraus, mit welcher Wahrscheinlichkeit sich der Preis um die angegebene Anzahl von Punkten vom nächstgelegenen Extrem in die entgegengesetzte Richtung bewegen wird. Die Funktionsweise des Indikators basiert auf der statistischen Berechnung historischer Trends. Palantir analysiert hi
Market Noise Market Noise ist ein Indikator, der Marktphasen auf einem Preisdiagramm bestimmt und außerdem klare, glatte Trendbewegungen von lauten, flachen Bewegungen unterscheidet, wenn eine Akkumulations- oder Verteilungsphase auftritt. Jede Phase ist für ihre eigene Art des Handels gut: Trend für trendfolgende Systeme und flach für aggressive Systeme. Wenn der Marktlärm beginnt, können Sie sich entscheiden, aus dem Handel auszusteigen. Auf die gleiche Weise und umgekehrt müssen Sie aggressi
Currency Strength Dynamic Die Währungsstärkedynamik ist ein Indikator für die Währungsstärke. Unter Währungsstärke versteht man die Trendrichtung der meisten oder aller Währungspaare, zu denen eine Währung gehört. Der Indikator basiert auf Messwerten der Differenz zwischen gleitenden Durchschnitten, ähnlich dem MACD-Indikator, für die 28 beliebtesten Währungspaare: Haupt- und Nebenwährungspaare. Vorteile Einzigartige Schwingungsberechnungsmethode Verfügbarkeit von Schaltflächen zum Deaktivi
Auswahl:
Keine Bewertungen
Antwort auf eine Rezension
Version 1.2 2023.11.05
Technical fixes