• Übersicht
  • Bewertungen (4)
  • Diskussion (1)
  • Neue Funktionen

Rule Plotter

5

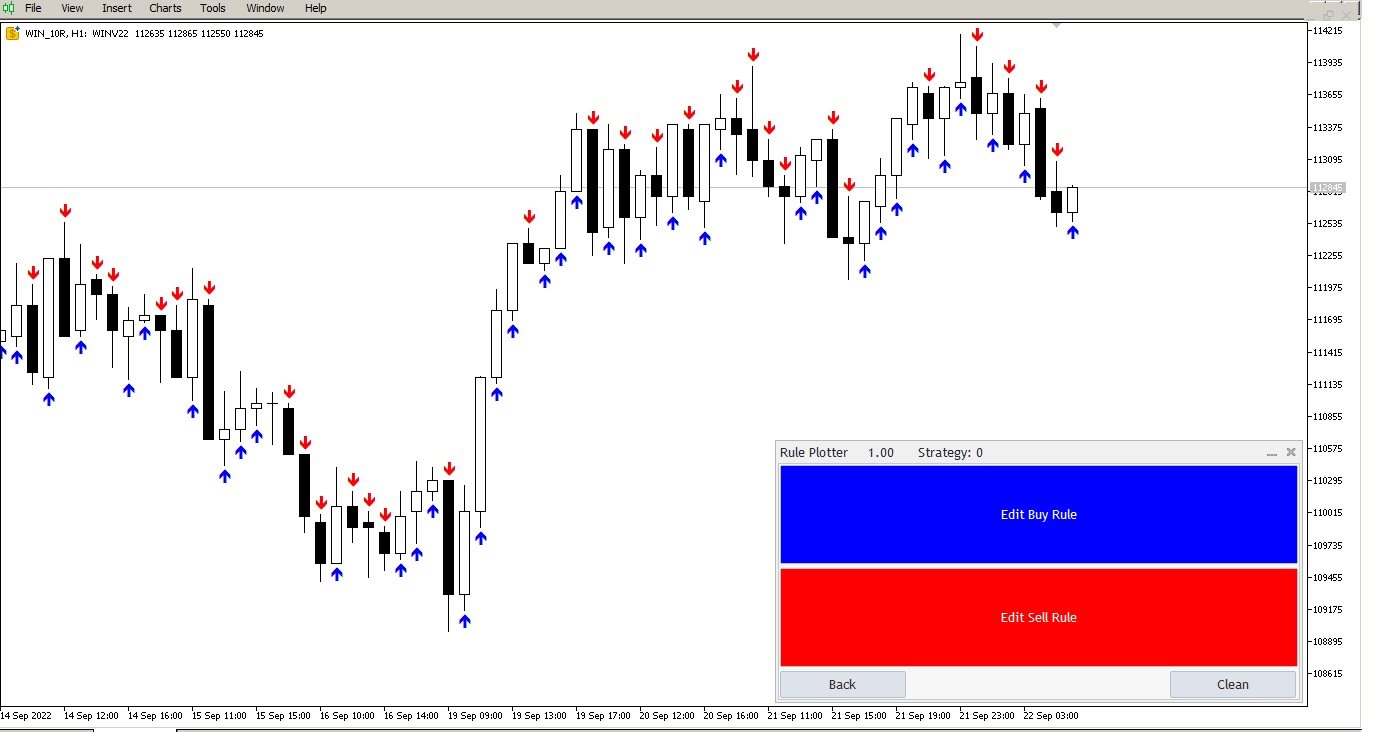
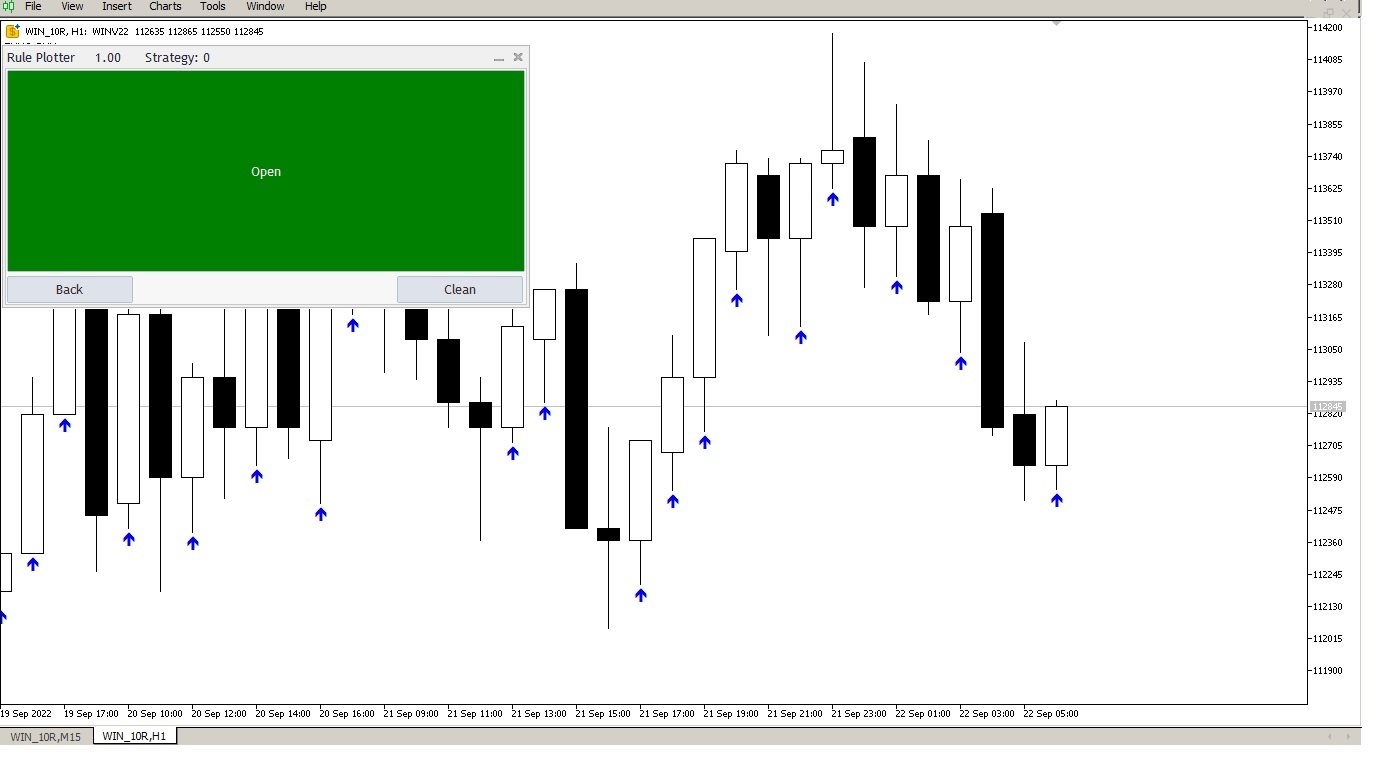
Erstellen Sie Ihre Strategie selbst

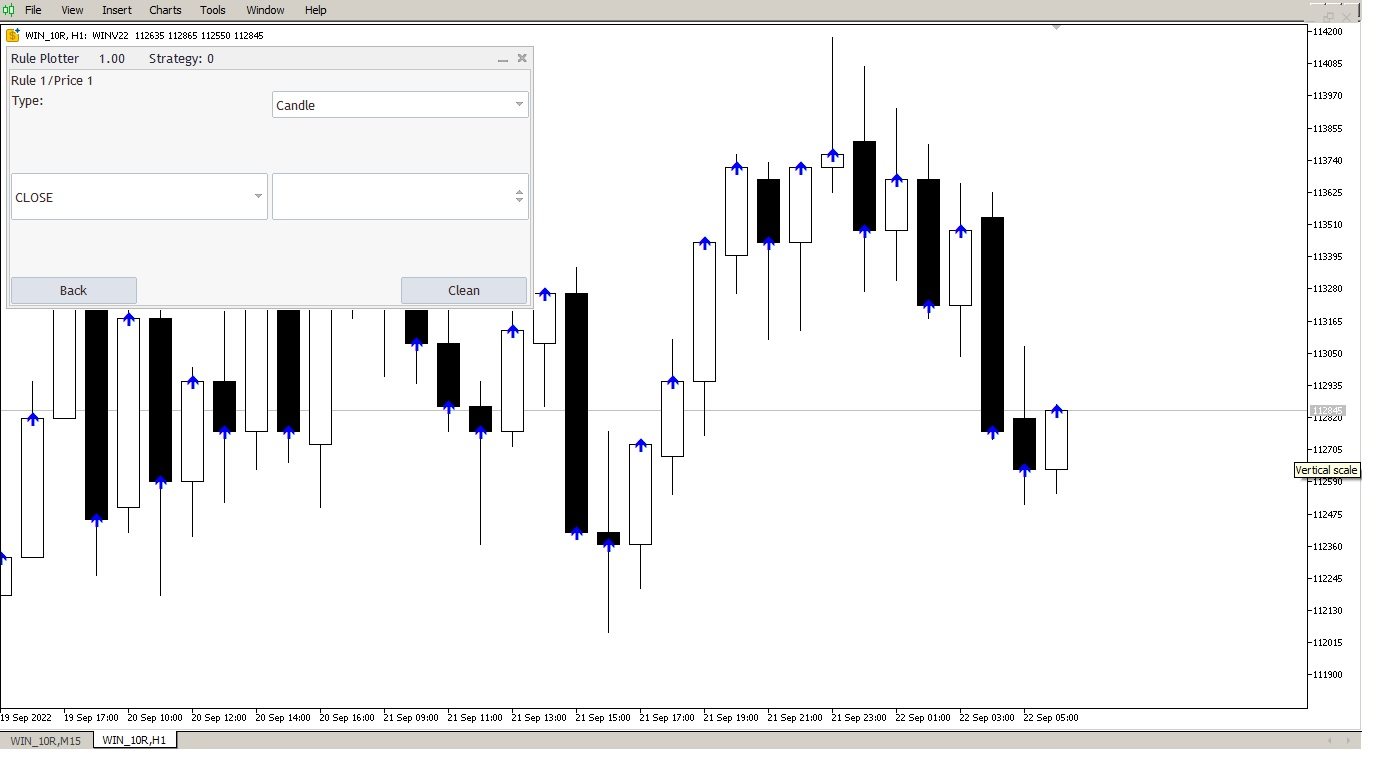
Dieses Tool ermöglicht es Ihnen, Ihre Strategien mit allen nativen Indikatoren in MetaTrader und allen aus dem Internet heruntergeladenen Indikatoren zu entwickeln, die Puffer verwenden, um Daten auf dem Bildschirm anzuzeigen.

Dieses Tool ist ein weiterer Grund, MetaTrader in Betracht zu ziehen, um Ihre Handelsstrategien zu automatisieren. Damit können Sie Ihre eigenen Strategiesignale auf einfache und intuitive Weise erstellen, indem Sie jeden MetaTrader-Indikator verwenden.

Wie weiß ich, ob mein aus dem Internet heruntergeladener Indikator Puffer verwendet?

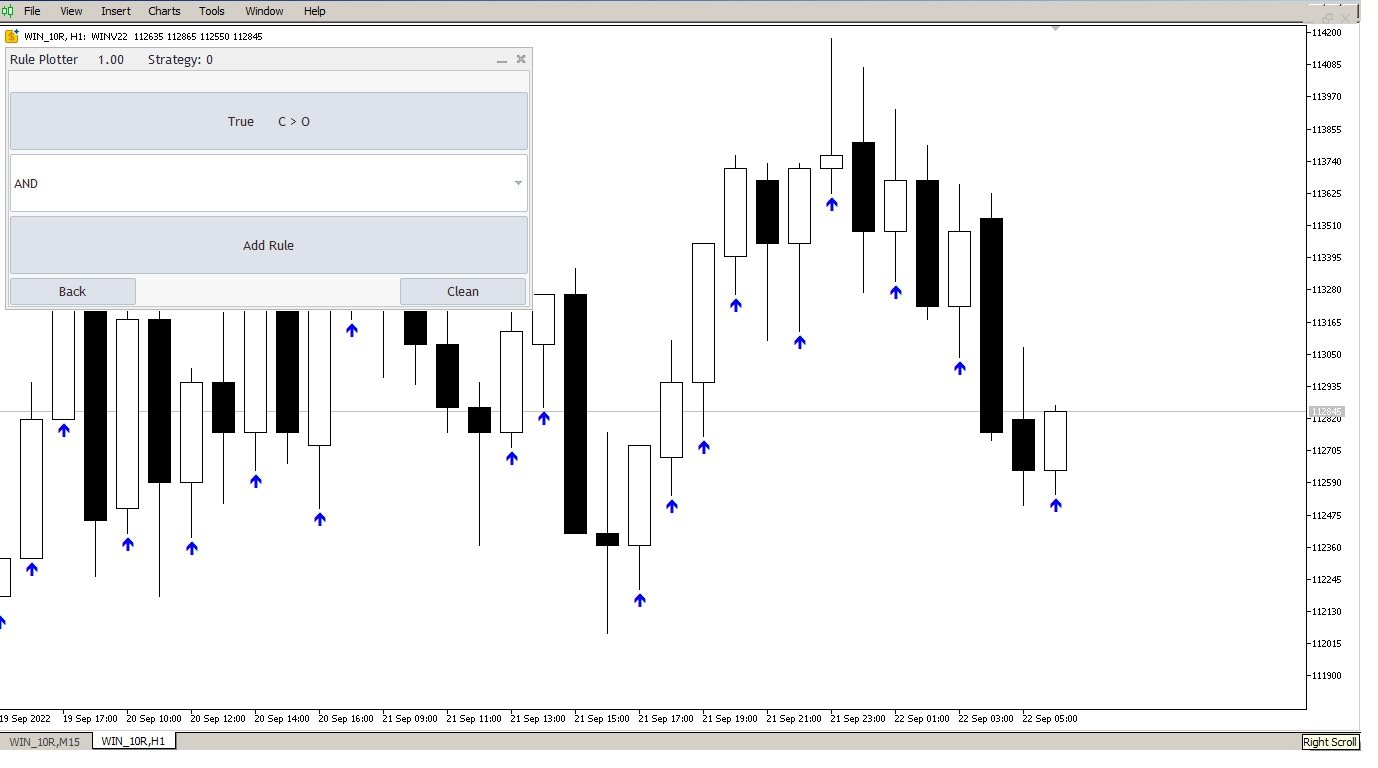
Es ist einfach, führen Sie einfach dieses Tool aus, und es erkennt automatisch alle Puffer, die Ihr Indikator hat, und macht sie für Sie verfügbar, um Ihre Strategien basierend darauf zu erstellen.

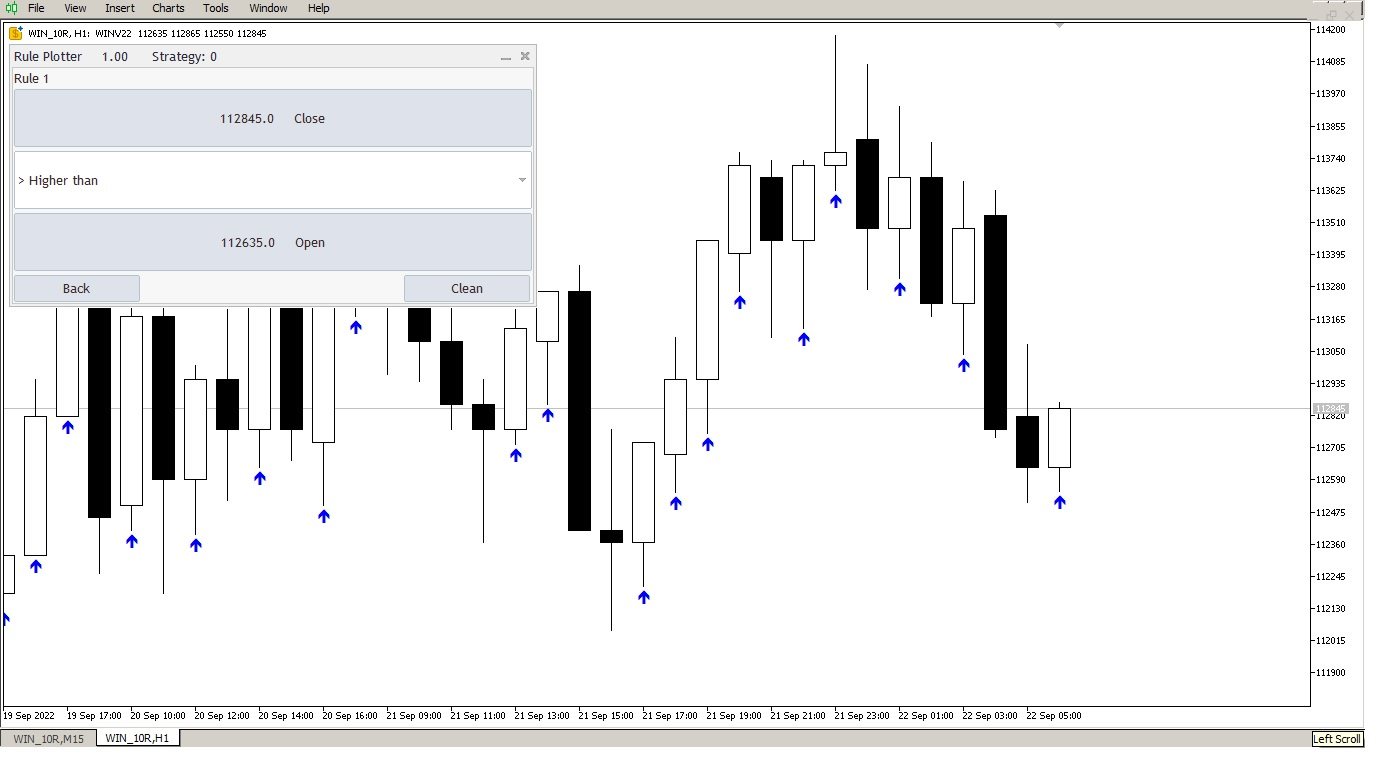
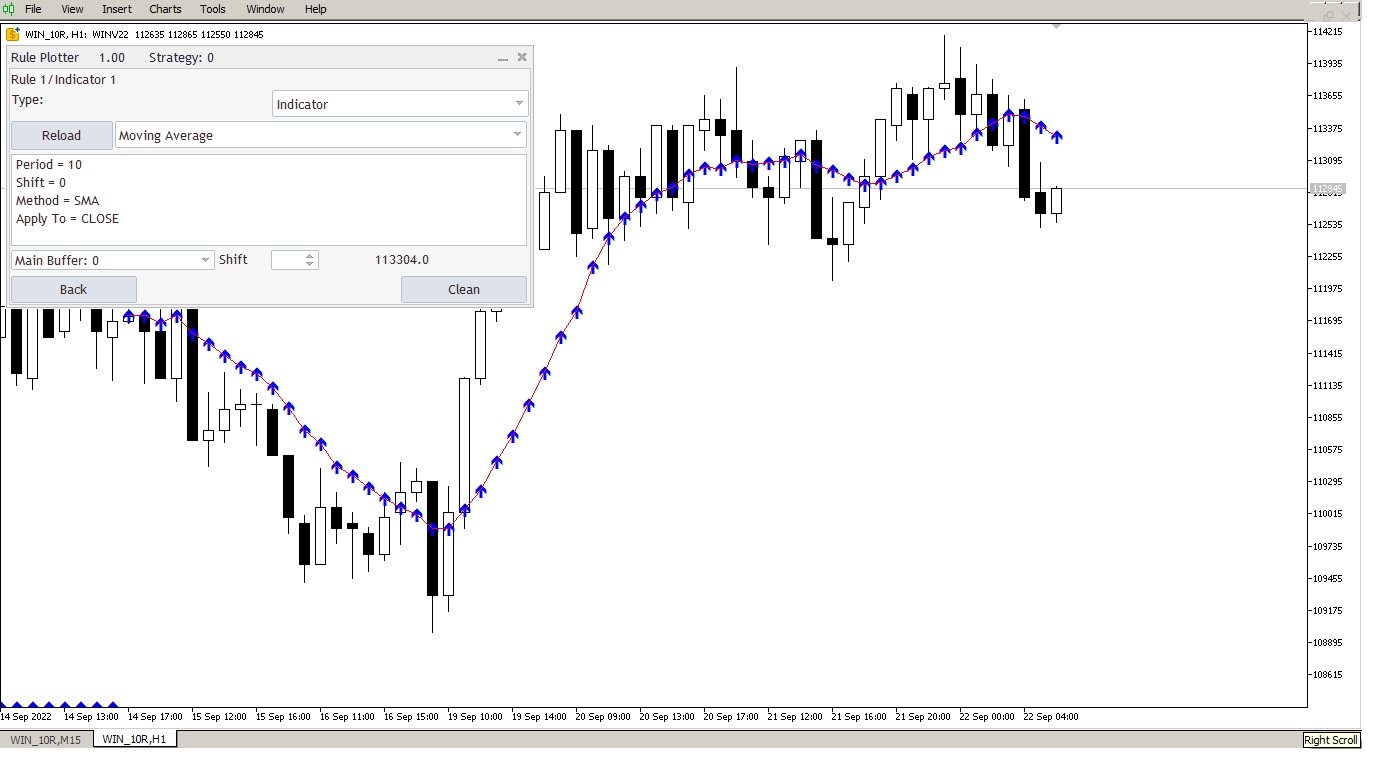
Dieses Tool kann automatisch erkennen, ob Ihre Indikatoren Puffer haben und wie viele Datenpuffer sie haben. Alles, was Sie tun müssen, ist, die Puffer mit den richtigen Werten zu verknüpfen.

Native MetaTrader-Indikatoren wie der gleitende Durchschnitt, RSI, Stochastik und MACD usw. sind unglaublich einfach zu verwenden, da sie bereits integrierte Puffer haben. Wenn es jedoch um benutzerdefinierte aus dem Internet heruntergeladene Indikatoren geht, ist es wichtig zu wissen, welcher Puffer zu welchen Daten gehört. Lassen Sie uns von vorne anfangen.

Lernen Sie die Verwendung von nativen MetaTrader-Tastenkombinationen:

Tastenkombination Beschreibung
STRG+F Um das Fadenkreuz auf Ihrer Maus zu aktivieren und genau zu erkennen, auf welche Kerze Sie sich beziehen.
STRG+D Um das Datenfenster der Indikatorpuffer anzuzeigen.
STRG++ Um in die Kerzen hineinzuzoomen.
STRG+G Um das Raster auf dem MetaTrader-Chart anzuzeigen. Dies funktioniert perfekt in Verbindung mit der maximalen Vergrößerung des Charts und ermöglicht es Ihnen, genau zu wissen, auf welche Kerze der Puffer sich bezieht.

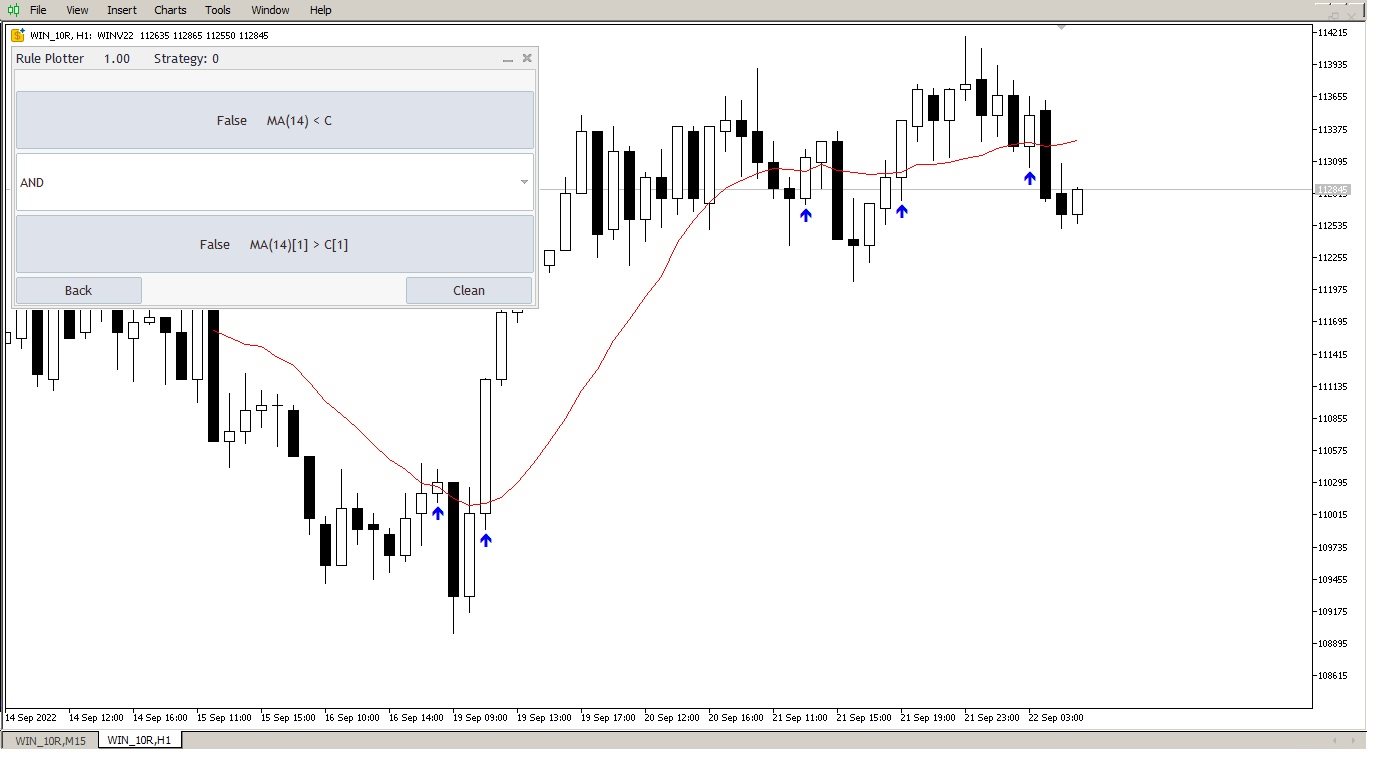
Jetzt, da Sie mit den MetaTrader-Tastenkombinationen vertraut sind, wird es einfacher sein, zu erkennen, auf welchen Puffer Ihr Indikator sich bezieht. Mit dem Datenfenster (STRG+D) geöffnet, können Sie die Daten leicht mit jedem Puffer verknüpfen.

Es mag zu Beginn kompliziert erscheinen, aber mit Geduld bei der Verknüpfung von Puffern und Werten können Sie mit allen Puffern aller Internet-Indikatoren arbeiten, einschließlich versteckter Puffer wie Farbpuffer und Indikatorberechnungspuffer.

Erstellen Sie so viele Strategien, wie Sie möchten.

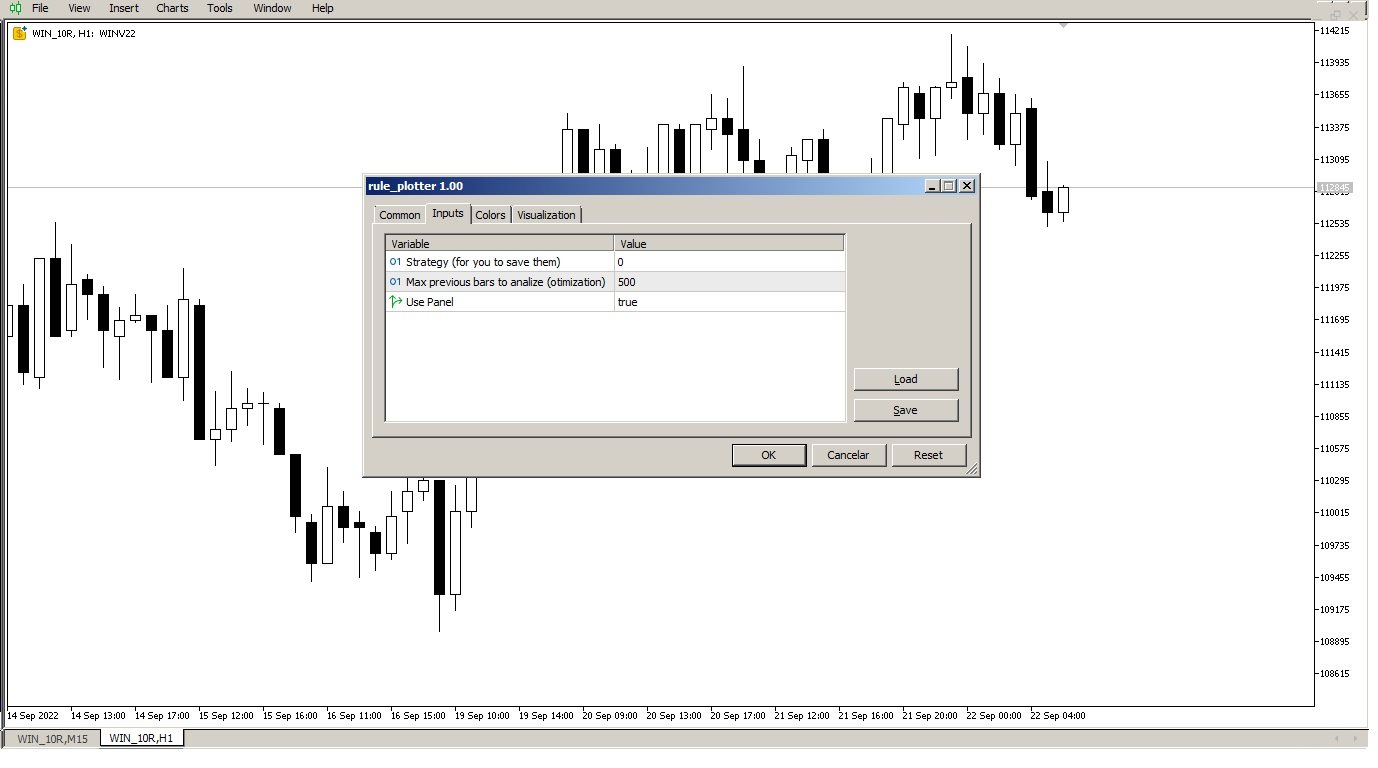
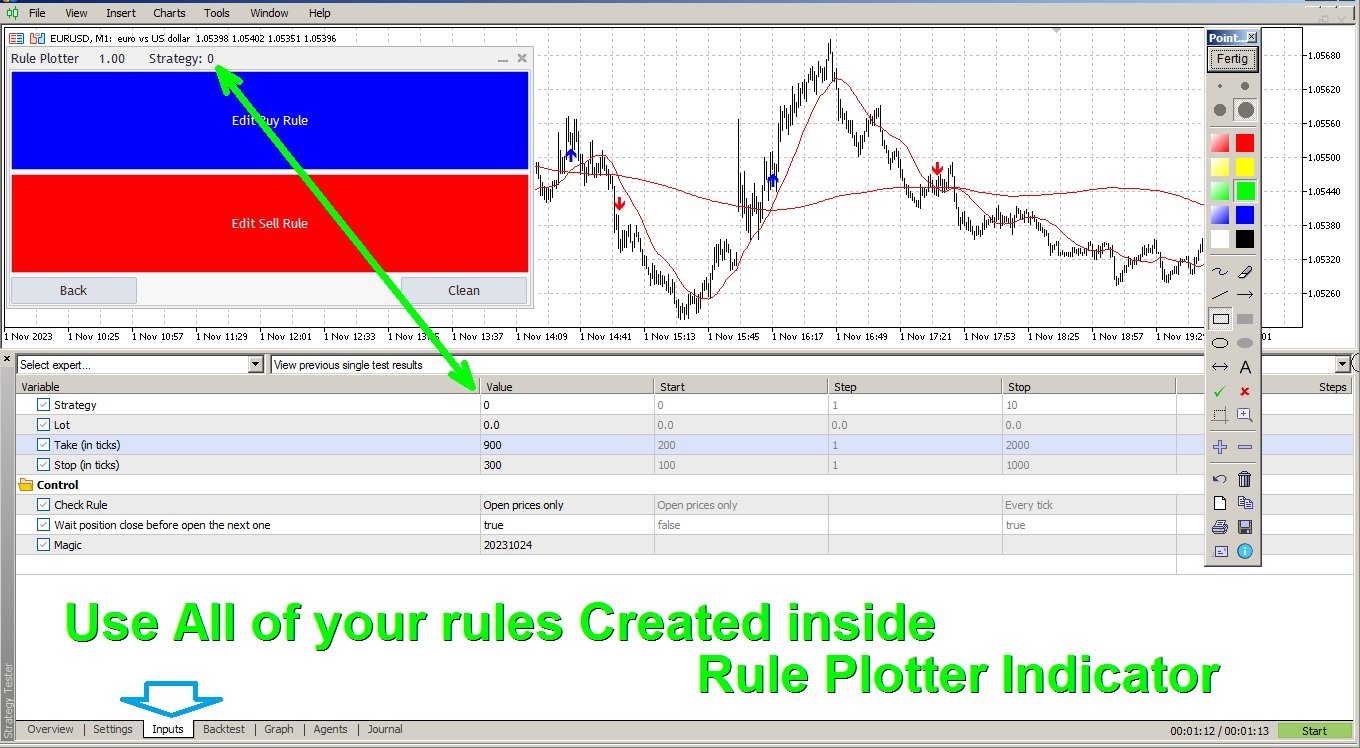
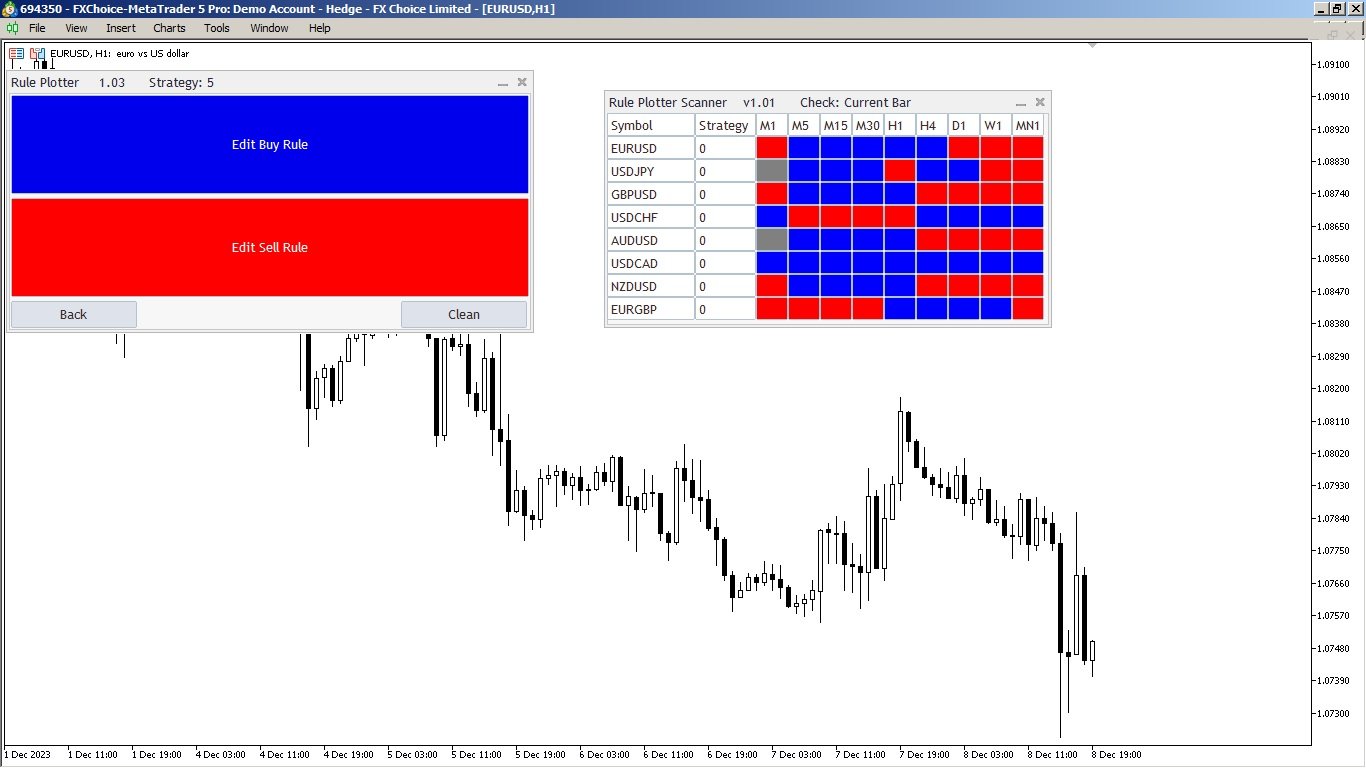
Unser Tool ermöglicht es Ihnen, so viele Strategien einzurichten, wie Sie möchten, indem Sie sie mit Zahlen verknüpfen, wie die Standardstrategie (Nummer 0), aber Sie können andere Strategien auf den Nummern 1, 2, 3, 4 usw. aufzeichnen. Beschränken Sie sich nicht auf eine einzelne Strategie. Viel Spaß beim Aufbau Ihrer persönlichen Strategiebasis.

Sie können jetzt sofort beginnen, und Ihre Strategien werden in einem Expert Advisor verwendet, den wir noch entwickeln. Daher möchten wir, dass Sie uns folgen, um über den Start des Expert Advisors informiert zu bleiben, mit dem Sie alle Ihre in der großartigen MetaTrader-Strategietester erstellten Strategien verwenden können.


Lassen Sie mich in den Kommentaren wissen, ob dieses Tool einfach oder schwierig zu verwenden ist.

Link zu meinem Profil: Rule Plotter Entwickler Francisco Gomes.

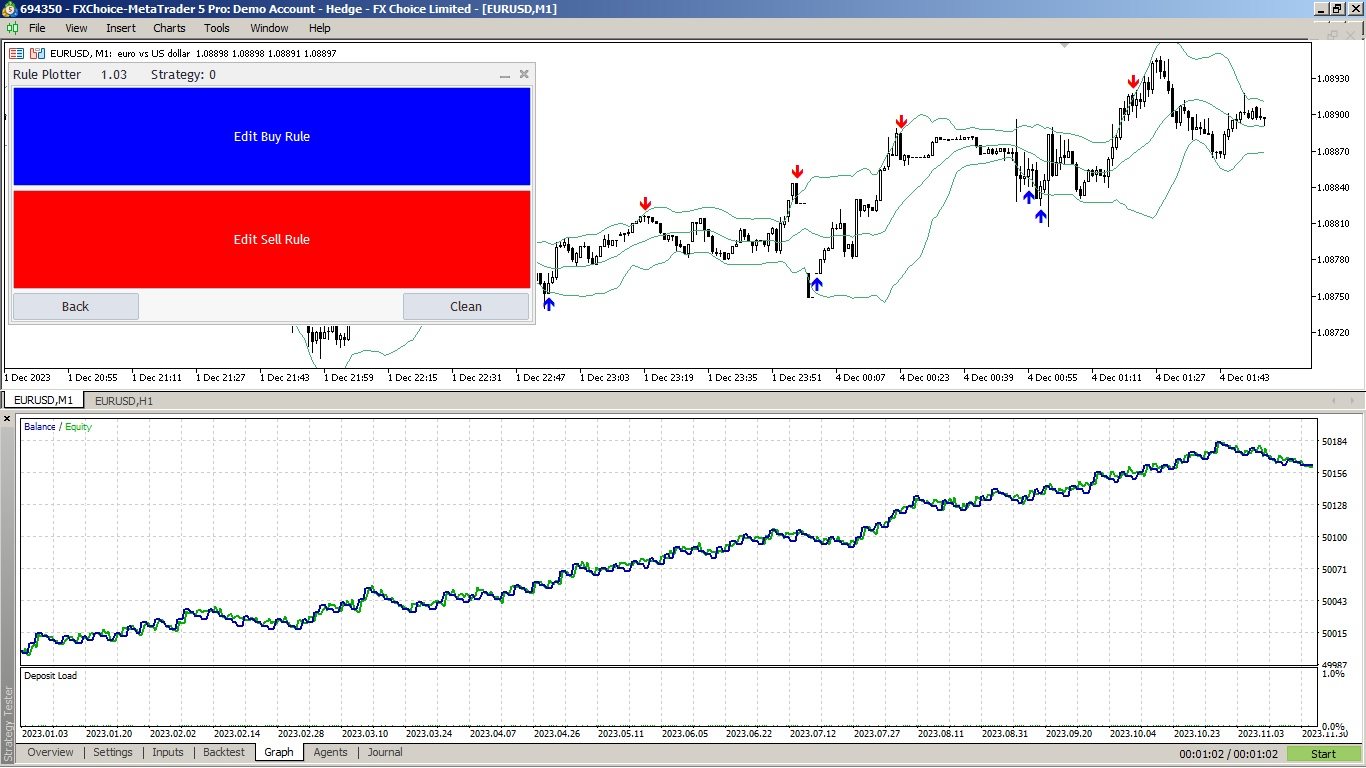
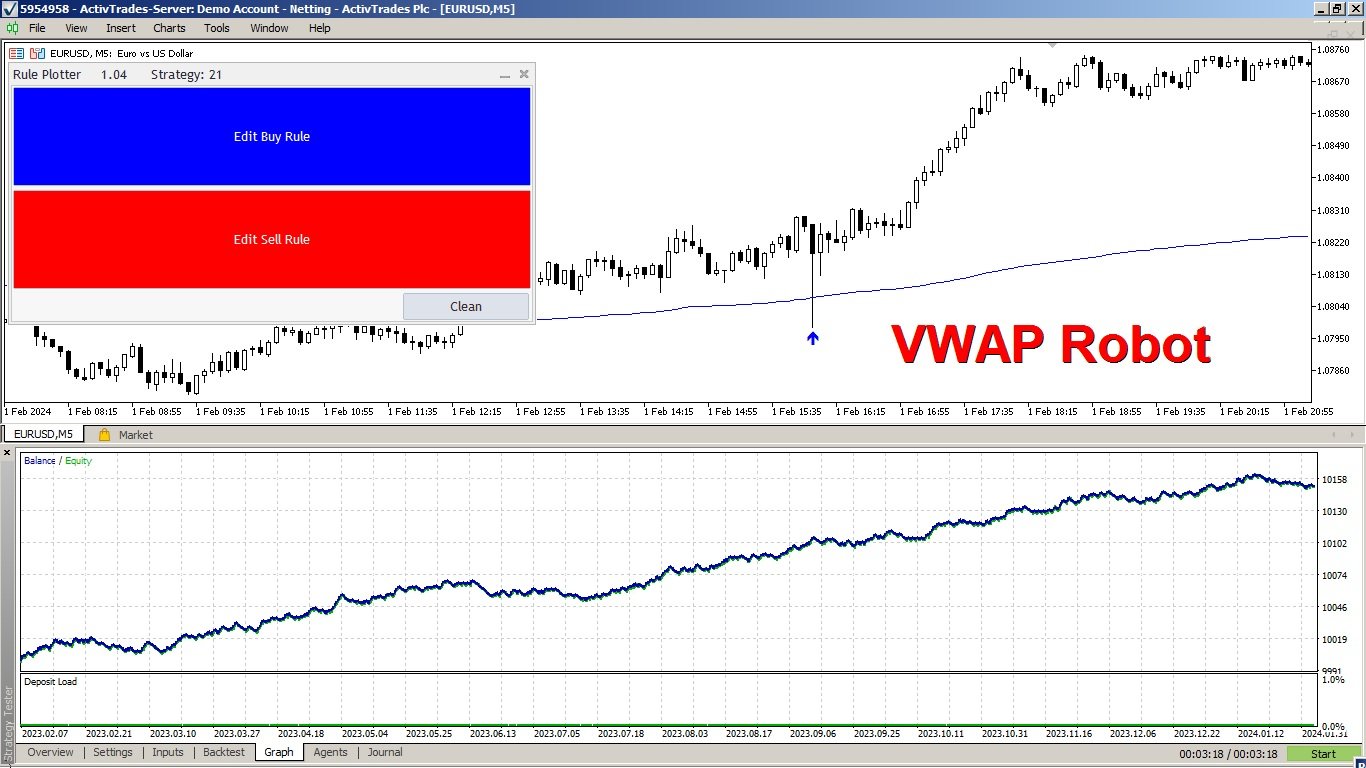
Testen Sie Ihre Strategie im Strategietester mit dem Rule Plotter Expert

Bewertungen 4
Elsier Jimenez
36
Elsier Jimenez 2024.04.07 23:29 
 

Excelente herramienta para automatizar una estrategia. Felicitaciones al desarrollador.

Moeen Ghiyas
299
Moeen Ghiyas 2024.03.10 09:30 
 

It's an excellent indicator, though difficult to understand initially as it took me a few days to comprehend. Anyhow your effort and idea are highly appreciated. ...... It needs little improvement as at present it does not provide nesting (use of parenthesis within rules for logical AND /OR operations), the same is available in Math Operation but misses logical AND / OR operation there as well. Suggested improvement will make it awesome, but I will still give it 5-star rating based on your idea and effort.

MickeBo
120
MickeBo 2024.03.02 19:35 
 

I highly recommend this tool and I'm glad to be able to use it! The purpose of this tool is to enter and save an existing strategy in order to then receive current entry signals in the form of arrows during operation according to the parameters I previously entered. It took me a while at the beginning to understand how to enter the parameters and I had a lot of help from Francisco, thank you very much for that! Once everything was entered and saved, everything worked perfectly. I receive entry arrows according to my strategy and I am very happy about this as it makes trading much clearer and easier for me. I don't want to miss it anymore, a really great tool that's worth trying. It is also possible to do a backtest with the saved parameters using the Rule Plotter EA and thus test the entered strategy - what more could you want? I can also highly recommend Francisco, his programming is flawless, he is very helpful and patient and I will always be happy to come back to him if there is a need for an indicator or an EA. Thank you, Francisco, for everything!!

Empfohlene Produkte
General Clock
Fernando Lahude Ritter
A Simple clock that on the left side "Time" shows r espectively the TimeCurrent, followed beneath by the TimeLocal. On the right hand side we have the remaining minutes and seconds of the current candle. TimeLocal is synced every 500 miliseconds however, the TimeCurrent and the time left on the candle are synced every tick, so this can lead to inconsistencies on the readings so keep that in mind. This indicator have no plots or buffers so it cannot be used in any time based EA.
FREE
Nyse Usdxy
Mitchell Dean Ede
Displays a USD DXY chart in a seperate window below the main chart. YOUR BROKER MUST HAVE THESE SYMBOLS FOR THE INDICATOR TO WORK Based on EUR/USD, USD/JPY, GBP/USD, USD/CAD, USD/CHF and USD/SEK All these pairs must be added to Market Watch for the indicator to work correctly As this is calculated using a formula based on the 6 pairs it will only work when the market is open. YOUR BROKER MUST HAVE THESE SYMBOLS FOR THE INDICATOR TO WORK Displays a USD DXY chart in a seperate window below the
FREE
Color Trend
Bruno Goncalves Mascarenhas
Combining the best of Price Action , Directional Movement , and Divergence / Convergence analysis, the Candle Color Trend is the easy and reliable way to identify the direction of the trend. The indicator automatically paints the candles according to the premise that the upward trend is defined by prices that form a series of ascending tops and bottoms. On the other hand, the downward trend is defined by prices that form a series of descending tops and bottoms. Color Trend is certainly one
FREE
Standard PVSR
Ashok Kumar Singha
Standard PVSR is based on Pivot Points. Steps to Setup the Indicator: Install the Custom Indicator; Set all the Lines Color, Width and Styles; Set visualization to All Timeframe; and DONE It can be used for: All Pairs: Forex, Cryptocurrencies, Metals, Stocks, Indices etc. All Timeframe All Brokers All type of Trading Style like Scalping, Swing, Intraday, Short-Term, Long-Term etc. Multiple Chart -->> For any Type of Support, Guidance, Setup Issue, EA Optimization, Input Setup etc.
FREE
This indicator uses a different approach from the previous version to get it's trendlines. This method is derived from Orchard Forex, and the process of making the indicator is demonstrated in there video   https://www.youtube.com/watch?v=mEaiurw56wY&t=1425s . The basic idea behind this indicator is it draws a   tangent line   on the highest levels and lowest levels of the bars used for calculation, while ensuring that the lines don't intersect with the bars in review (alittle confusing? I kno
FREE
The indicator is designed for displaying the following price levels on the chart: Previous day's high and low. Previous week's high and low. Previous month's high and low. Each of the level types is customizable. In the indicator settings, you set line style, line color, enable or disable separate levels. Configurations ----Day------------------------------------------------- DayLevels   - enable/disable previous day's levels. WidthDayLines   - line width of daily levels. ColorDayLines   - lin
FREE
Der Trendfänger: Die Strategie des Trendfängers mit Alarmindikator ist ein vielseitiges technisches Analysewerkzeug, das Händlern hilft, Markttrends und potenzielle Ein- und Ausstiegspunkte zu identifizieren. Sie verfügt über eine dynamische Trendfängerstrategie, die sich den Marktbedingungen anpasst, um eine klare visuelle Darstellung der Trendrichtung zu ermöglichen. Händler können die Parameter an ihre Vorlieben und Risikotoleranz anpassen. Der Indikator hilft bei der Trendidentifikation,
FREE
This Mt5 Indicator Signals when there is two opposite direction bars engulfed by current bar.  has a recent Exponential Moving Average Cross and past bar was oversold/bought Expert Advisor Available in Comments  Free Version Here : https://www.mql5.com/en/market/product/110114?source=Site&nbsp ; Full Alerts for mt5 terminal , phone , email, print to file, print to journal  Buy Signal ( blue line ) Past ema cross ( set at 30 bars back ) Past bar rsi is oversold ( level 40  ) Engulfing bar closes
FREE
"Hunttern harmonic pattern finder" base on the dynamic zigzag with the notification and prediction mode This version of the indicator identifies 11 harmonic patterns and predicts them in real-time before they are completely formed. It offers the ability to calculate the error rate of Zigzag patterns depending on a risk threshold. It moreover sends out a notification once the pattern is complete. The supported patterns: ABCD BAT ALT BAT BUTTERFLY GARTLEY CRAB DEEP CRAB CYPHER SHARK THREE
FREE
Sessions are very important in trading and often good area where to look for setup. In SMC, ICT we will look for Asian session to serve as liquidity This indicator displays: High & Low of the Asia session Midnight New York time opening line Congifuration Line Style, color Label position, size, color Start of the level (Start of the day, Start of the session, Highest or Lowest point in the session) Any questions or comments, send me a direct message here  https://www.mql5.com/en/users/mvonl
FREE
HammerStar
Arismario Verissimo Neves
3.14 (7)
The HammerStar indicator is designed to search for the Hammer and Shooting Star patterns on charts of any currency pairs. Hammer Downward trend. The lower shadow is not less than 2 and no more than 3 times larger than the body. There is no upper shadow, or it is very short (no more than 10% of the candlestick range). The color of the body in the long game is not important, with the short - white hammer is much stronger than the black one. Confirmation is suggested. Shooting Star Uptrend.
FREE
Trend Strength Analyzer
Andrey Sorokin
4.8 (5)
The technical indicator Trend Strength Analyzer measures the deviation of the price of an instrument from average values ​​over a specific period of time. A comparative analysis of the relative strength of bulls and bears underlies the indicator. If bulls prevail, an upward trend. If bears are stronger - a downward trend.      Settings: Strike Energy (2 solid lines) = 14. Influence Power (2 dotted lines) = 50. The TSA oscillator is effective in an active market. The most commonly used indica
FREE
Reversal Composite Candles
MetaQuotes Ltd.
3.43 (23)
The idea of the system is to indentify the reversal patterns using the calculation of the composite candle. The reversal patterns is similar to the "Hammer" and "Hanging Man" patterns in Japanese candlestick analysis. But it uses the composite candle instead the single candle and doesn't need the small body of the composite candle to confirm the reversal. Input parameters: Range - maximal number of bars, used in the calculation of the composite candle. Minimum - minimal size of the composite can
FREE
Dark Bands MT5
Marco Solito
4.88 (191)
Dark Bands   is an Indicator for intraday trading. This Indicator is based on Counter Trend  strategy but use also Volatility. We can enter in good price with this Indicator, in order to follow the inversions on the current instrument. Key benefits Easily visible take profit/stop loss lines Reliable bands lines with futuristic colors, and  Intuitive directional arrows Useful statistics , which indicate the win rate of the signals Plus Package  available, leave a feedback to receive it for
FREE
Blahtech Moving Average indicator is a multitimeframe version of the standard Moving Average indicator. It is also enhanced with customisable alerts, period breaks and other configuration options. The 50 day and 200 day moving averages are widely followed by investors and traders, with breaks above and below the MA lines considered to be signals of interest. Links [  Install  |  Update  |   Training   |   All Products  ] Feature Highlights Up to three timeframes Configurable calculation variab
FREE
Free automatic Fibonacci is an indicator that automatically plots a Fibonacci retracement based on the number of bars you select on the BarsToScan setting in the indicator. The Fibonacci is automatically updated in real time as new highest and lowest values appears amongst the selected bars. You can select which level values to be displayed in the indicator settings. You can also select the color of the levels thus enabling the trader to be able to attach the indicator several times with differe
FREE
Inside Bar Radar
Flavio Javier Jarabeck
4.67 (6)
The Inside Bar pattern is a very well known candlestick formation used widely by traders all over the world and in any marketplace. This approach is very simple and adds a little confirmation candle, so it adds a third past candlestick to the count to confirm the direction of the move (upward or downward). Obviously, there is no power on this candlestick formation if the trader has no context on what it is happening on the market he/she is operating, so this is not magic, this "radar" is only a
FREE
QuantumAlert Stoch Navigator is a free indicator available for MT4/MT5 platforms, its work is to provide "alerts" when the market is inside "overbought and oversold" regions in the form of "buy or sell" signals. This indicator comes with many customization options mentioned in the parameter section below, user can customise these parameters as needful. Join our   MQL5 group , where we share important news and updates. You are also welcome to join our private channel as well, contact me for the p
FREE
QuantumAlert CCI Navigator is a free indicator available for MT4/MT5 platforms, its work is to provide "alerts" when the market is inside "overbought and oversold" regions in the form of "buy or sell" signals. This indicator comes with many customization options mentioned in the parameter section below, user can customise these parameters as needful. Join our   MQL5 group , where we share important news and updates. You are also welcome to join our private channel as well, contact me for the pri
FREE
PZ Three Drives MT5
PZ TRADING SLU
3.11 (9)
This indicator finds Three Drives patterns. The Three Drives pattern is a 6-point reversal pattern characterised by a series of higher highs or lower lows that complete at a 127% or 161.8% Fibonacci extension. It signals that the market is exhausted and a reversal can happen. [ Installation Guide | Update Guide | Troubleshooting | FAQ | All Products ] Customizable pattern sizes Customizable colors and sizes Customizable breakout periods Customizable 1-2-3 and 0-A-B ratios It implements visua
FREE
TilsonT3
Jonathan Pereira
Tillson's T3 moving average was introduced to the world of technical analysis in the article ''A Better Moving Average'', published in the American magazine Technical Analysis of Stock Commodities. Developed by Tim Tillson, analysts and traders of futures markets soon became fascinated with this technique that smoothes the price series while decreasing the lag (lag) typical of trend-following systems.
FREE
Envelopes Clouds
Samuel Manoel De Souza
The Indicator indicator draws 2 clouds based on Envelopes indicator values. The upper cloud is formed by the upper lines values and the lower cloud by the lowers lines values. The indicator allows to change the Envelopes parameters and the clouds colors the period of the base line and the deviations of each Envelopes instance. The indicator holds 5 buffer index as follow: [0] - Outer values of the upper cloud [1]  - Inner values of the upper cloud [2]  - Base/Center line values [3]  - Inner valu
FREE
PANEL OF TOPOS AND HISTORICAL BACKGROUNDS   This is a panel that does not open orders only manages all Symbols and calculates the tops and bottoms and presents the calculation in relation to the top and bottom in 5 Years, 2 Months and 1 Week. It is ideal for filtering the pairs that are in the good regions to operate. You can filter the range and choose whether to consider the body or shadow of the candle in the monthly. Good luck...
FREE
Virtual Targets MT5
Hoang Van Dien
4.71 (7)
This indicator is very useful for day traders or short term traders. (MT5 version) No need to calculate the number of pips manually, just look at the chart and you will see the Virtual Take Profit / Virtual Stop Loss target line and evaluate whether the entry point is feasible to reach the intended target or not. Enter the intended   Take Profit / Stop Loss   pips for your trade. The indicator will display   Virtual Take Profit / Virtual Stop Loss   lines for you to easily see if the target i
FREE
Supertrend Line
Flavio Javier Jarabeck
4.86 (14)
The Supertrend indicator was originally created by a french fellow named Olivier Seban , and its goal is to identify the Primary Trend of prices . Its calculation is easy and based on the average of Highs and Lows and then we add the volatility of a custom period, plus a multiplier. This way we get the Supertrend Line. You can find in the web several approaches and trading strategies using this very useful indicator. HOW TO "READ" THIS INDICATOR If the closing prices are above Supertrend Line
FREE
Graphic Alignment Context
Ricardo Alexandre Laurentino
The Graphic Alignment Context (GAC) Technical Indicator measures the vertical difference of the simple average price of a financial instrument in the context of three different timeframes determined by a defined number of bars or candles (periods) to determine the strength of the buy or sell trend. sale. Ascending average prices indicate Buying strength (1), Descending average prices indicate Selling strength (-1) and any scenario different from the previous two conditions indicates Neutrality
FREE
Alert System
Nguyen Thanh Sang
5 (3)
Alert System You use function keys to create horizontal lines for alerts. 1. Allow set horizontal line properties (line color, line style, line width, ...) for alerts. 2. Allow add text to horizotanl line. You can hide or show text when you need. You can change text and its price, but time of text will be set in input named "text_time" (0 is current time, you should test this input with -1, -2, -3 or lower). 3. It has 2 types of alert: above and bellow. You can set key to create them. If price i
FREE
PZ Chart Overlay MT5
PZ TRADING SLU
4.5 (2)
Der Chart-Overlay- Indikator zeigt die Kursbewegungen mehrerer Instrumente auf demselben Chart an, sodass Sie auswerten können, wie unterschiedlich die Währungspaare im Verhältnis zueinander schwanken. [ Installationsanleitung | Update-Anleitung | Fehlerbehebung | FAQ | Alle Produkte ] Finden Sie leicht überkaufte oder überverkaufte Währungspaare Zeichnen Sie bis zu sechs Währungspaare auf ein und demselben Diagramm Zeigen Sie bei Bedarf invertierte Symbole an An Diagrammgröße, Zoom und Zei
FREE
Time Session OPEN-HIGH-LOW-CLOSE This Indicator Will Draw Lines Of OHLC Levels Of Time Session Defined By User. It Will Plot Floating Lines On Current Day Chart. Time Session Can Of Current Day Or Previous Day. You Can Plot Multiple Session Lines By Giving Unique ID To Each Session. It Can Even Show Historical Levels Of Time Session Selected By User On Chart To Do Backdating Test. You Can Write Text To Describe The Lines.
FREE
Description. The basis for the formation of the Renko chart is the price range. If the price goes beyond its limits, the chart shows a box above or below the previous one. As a result, we see price movement without additional "noise" and important support and resistance levels. Features. For use in conjunction with the Expert Advisor, an additional buffer is implemented-a box counter. For convenience and to increase the speed of testing, the user can use the "new box" event, which the indicato
FREE
Käufer dieses Produkts erwarben auch
Zunächst einmal ist es wichtig zu betonen, dass dieses Handelssystem ein Nicht-Repainting-, Nicht-Redrawing- und Nicht-Verzögerungsindikator ist, was es sowohl für manuelles als auch für automatisches Trading ideal macht. Das "Smart Trend Trading System MT5" ist eine umfassende Handelslösung, die für neue und erfahrene Trader maßgeschneidert ist. Es kombiniert über 10 Premium-Indikatoren und bietet mehr als 7 robuste Handelsstrategien, was es zu einer vielseitigen Wahl für verschiedene Marktbe
Atomic Analyst MT5
Issam Kassas
4.82 (11)
Zunächst einmal ist es erwähnenswert, dass dieser Handelsindikator nicht neu malt, nicht neu zeichnet und keine Verzögerung aufweist, was ihn sowohl für manuellen als auch für Roboterhandel ideal macht. Der Atom-Analyst ist ein PA-Preisaktionsindikator, der die Stärke und das Momentum des Preises nutzt, um einen besseren Vorteil auf dem Markt zu finden. Ausgestattet mit fortschrittlichen Filtern, die helfen, Rauschen und falsche Signale zu entfernen, und das Handelspotenzial zu erhöhen. Durch
FX Volume MT5
Daniel Stein
4.94 (17)
Erhalten Sie Ihr tägliches Marktupdate mit Details und Screenshots über unser Morning Briefing hier auf mql5 und auf Telegram ! FX Volume ist der ERSTE und EINZIGE Volumenindikator, der einen ECHTEN Einblick in die Marktstimmung aus Sicht eines Brokers bietet. Es bietet fantastische Einblicke in die Positionierung von institutionellen Marktteilnehmern, wie z.B. Brokern, auf dem Forex-Markt, viel schneller als COT-Berichte. Diese Informationen direkt auf Ihrem Chart zu sehen, ist der wahre Game
Quantum Trend Sniper
Bogdan Ion Puscasu
5 (37)
Wir stellen vor       Quantum Trend Sniper Indicator   , der bahnbrechende MQL5-Indikator, der die Art und Weise, wie Sie Trendumkehrungen erkennen und handeln, verändert! Entwickelt von einem Team erfahrener Händler mit über 13 Jahren Handelserfahrung,       Quantum Trend Sniper-Indikator       wurde entwickelt, um Ihre Trading-Reise mit seiner innovativen Methode zur Identifizierung von Trendumkehrungen mit extrem hoher Genauigkeit auf ein neues Niveau zu heben. ***Kaufe Quantum Trend Snipe
Trend Screener Pro MT5
STE S.S.COMPANY
4.89 (61)
Nutzen Sie die Macht des Trendhandels mit Trend Screener Indicator: Ihrer ultimativen Trendhandelslösung, die auf Fuzzy-Logik und einem System mit mehreren Währungen basiert! Steigern Sie Ihren Trendhandel mit Trend Screener, dem revolutionären Trendindikator mit Fuzzy-Logik. Es handelt sich um einen leistungsstarken Trendfolgeindikator, der über 13 Premium-Tools und -Funktionen sowie 3 Handelsstrategien kombiniert und ihn zu einer vielseitigen Wahl macht, um Ihren Metatrader in einen Trendanaly
Gold Stuff mt5
Vasiliy Strukov
4.89 (166)
Gold Stuff mt5-Ein Trendindikator, der speziell für Gold entwickelt wurde, kann auch auf allen Finanzinstrumenten verwendet werden. Der Indikator wird nicht neu gezeichnet und verzögert sich nicht. Empfohlener Zeitrahmen H1. WICHTIG! Kontaktieren Sie mich sofort nach dem Kauf, um Anweisungen und Bonus zu erhalten! DATEN Draw Arrow - inkl.aus. zeichnen von Pfeilen in einem Diagramm. Alerts-inkl.aus.akustische Warnungen. E - mail notification-inkl.aus. benachrichtigungen per E-Mail. Puch-
Zunächst einmal ist es wichtig zu betonen, dass dieses Handelstool ein Nicht-Repaint-, Nicht-Redraw- und Nicht-Verzögerungsindikator ist, was es ideal für professionelles Trading macht. Der Smart Price Action Concepts Indikator ist ein sehr leistungsstarkes Werkzeug sowohl für neue als auch erfahrene Händler. Er vereint mehr als 20 nützliche Indikatoren in einem und kombiniert fortgeschrittene Handelsideen wie die Analyse des Inner Circle Traders und Strategien des Smart Money Concepts. Diese
Dies ist ein Indikator für MT5, der genaue Signale für den Einstieg in einen Handel ohne Repainting (Neuzeichnen) liefert. Er kann auf alle Finanzwerte angewendet werden: Forex, Kryptowährungen, Metalle, Aktien, Indizes. Er liefert ziemlich genaue Schätzungen und sagt Ihnen, wann es am besten ist, eine Position zu eröffnen und zu schließen. Sehen Sie sich das Video (6:22) mit einem Beispiel für die Verarbeitung nur eines Signals an, das sich für den Indikator gelohnt hat! Die meisten Händler ver
FX Power MT5 NG
Daniel Stein
5 (4)
Erhalten Sie Ihr tägliches Marktupdate mit Details und Screenshots über unser Morning Briefing hier auf mql5 und auf Telegram ! FX Power MT5 NG ist die nächste Generation unseres langjährig sehr beliebten Währungsstärkemessers FX Power. Und was bietet dieser Stärkezähler der nächsten Generation? Alles, was Sie am ursprünglichen FX Power geliebt haben PLUS GOLD/XAU-Stärkeanalyse Noch präzisere Berechnungsergebnisse Individuell konfigurierbare Analysezeiträume Anpassbares Berechnungslimit für noc
RelicusRoad Pro MT5
Relicus LLC
4.82 (22)
Jetzt 147 US -Dollar (nach ein paar Aktualisierungen auf 499 US -Dollar) - Unbegrenzte Konten (PCs oder MACs) RelicusRoad Benutzerhandbuch + Schulungsvideos + Zugang zur privaten Discord-Gruppe + VIP-Status EINE NEUE ART, DEN MARKT ZU BETRACHTEN RelicusRoad ist der weltweit leistungsstärkste Handelsindikator für Forex, Futures, Kryptowährungen, Aktien und Indizes und gibt Händlern alle Informationen und Tools, die sie benötigen, um profitabel zu bleiben. Wir bieten technische Analysen un
Auto Order Block with break of structure based on ICT and Smart Money Concepts Futures Break of Structure ( BoS )             Order block ( OB )            Higher time frame Order block / Point of Interest ( POI )    shown on current chart           Fair value Gap ( FVG ) / Imbalance   ,  MTF      ( Multi Time Frame )    Volume Imbalance     ,  MTF          vIMB Gap’s Equal High / Low’s     ,  MTF             EQH / EQL Liquidity               Current Day High / Low           HOD /
XQ Indicator MetaTrader 5
Marzena Maria Szmit
5 (1)
Step into the realm of Forex trading with confidence and precision using XQ, a cutting-edge Forex indicator designed to elevate your trading game to unprecedented heights. Whether you're a seasoned trader or just stepping into the world of currency exchange, XQ Forex Indicator empowers you with the insights and signals needed to make informed trading decisions. The signal conditions are a combination of three indicators, and XQ Forex Indicator only display  medium and long-term trends . The ind
Blahtech Supply Demand MT5
Blahtech Limited
4.57 (14)
Was: $299  Now: $99   Supply Demand uses previous price action to identify potential imbalances between buyers and sellers. The key is to identify the better odds zones, not just the untouched ones. Blahtech Supply Demand indicator delivers functionality previously unavailable on any trading platform. This 4-in-1 indicator not only highlights the higher probability zones using a multi-criteria strength engine, but also combines it with multi-timeframe trend analysis, previously confirmed swings
Advanced Supply Demand MT5
Bernhard Schweigert
4.53 (15)
Derzeit 33% Rabatt! Die beste Lösung für jeden Anfänger oder erfahrenen Händler! Dieser Indikator ist ein einzigartiges, qualitativ hochwertiges und erschwingliches Trading-Tool, da wir eine Reihe von proprietären Funktionen und eine neue Formel integriert haben. Mit diesem Update werden Sie in der Lage sein, doppelte Zeitrahmenzonen anzuzeigen. Sie können nicht nur einen höheren TF (Zeitrahmen) anzeigen, sondern sowohl den Chart-TF als auch den höheren TF: SHOWING NESTED ZONES. Alle Supply Dema
ICT, SMC, SMART MONEY CONCEPTS, SMART MONEY, Smart Money Concept, Support and Resistance, Trend Analysis, Price Action, Market Structure, Order Blocks, BOS/CHoCH,   Breaker Blocks ,  Momentum Shift,   Supply&Demand Zone/Order Blocks , Strong Imbalance,   HH/LL/HL/LH,    Fair Value Gap, FVG,  Premium  &   Discount   Zones, Fibonacci Retracement, OTE, Buy Side Liquidity, Sell Side Liquidity, BSL/SSL Taken, Equal Highs & Lows, MTF Dashboard, Multiple Time Frame, BigBar, HTF OB, HTF Market Structure
Der Gann Square Indikator ist ein leistungsstolles Marktanalyse-Tool, das auf dem Artikel "Mathematische Formel für Marktvorhersagen" von W.D. Gann basiert. Dieses Tool verwendet mathematische Konzepte und Gann-Theorien für eine präzise Marktanalyse. Es beinhaltet Quadratwerte von 144, 90, 52 und auch das Quadrat von 9. Darüber hinaus integriert es die Methode von  zur Quadratwurzel von 9 und deren Beziehung zu Kanälen und dem Sternmuster. Benutzerhandbuch und Anwendung: Vor der Verwendung diese
AW Trend Predictor MT5
AW Trading Software Limited
4.76 (54)
Die Kombination von Trend- und Aufschlüsselungsebenen in einem System. Ein fortschrittlicher Indikatoralgorithmus filtert Marktrauschen, bestimmt den Trend, Einstiegspunkte sowie mögliche Ausstiegsniveaus. Indikatorsignale werden in einem Statistikmodul aufgezeichnet, das es Ihnen ermöglicht, die am besten geeigneten Tools auszuwählen, die die Wirksamkeit der Signalhistorie zeigen. Der Indikator berechnet Take-Profit- und Stop-Loss-Marken. Handbuch und Anleitung ->   HIER   / MT4-Version ->   H
Werden Sie Breaker Trader und profitieren Sie von Änderungen der Marktstruktur, wenn sich der Preis umkehrt. Der Order Block Breaker Indikator zeigt an, wann sich eine Trend- oder Preisbewegung der Erschöpfung nähert und bereit ist, sich umzukehren. Es weist Sie auf Änderungen in der Marktstruktur hin, die normalerweise auftreten, wenn eine Umkehrung oder ein größerer Rückzug bevorsteht. Der Indikator verwendet eine proprietäre Berechnung, die Ausbrüche und Preisdynamik identifiziert. Jedes
The Volume by Price Indicator for MetaTrader 5 features Volume Profile and Market Profile TPO (Time Price Opportunity). Get valuable insights out of currencies, equities and commodities data. Gain an edge trading financial markets. Volume and TPO histogram bar and line charts. Volume Footprint charts. TPO letter and block marker charts including split structures. Versatile segmentation and compositing methods. Static, dynamic and flexible ranges with relative and/or absolute visualizations. Lay
Wir stellen vor       Quantum Breakout PRO   , der bahnbrechende MQL5-Indikator, der die Art und Weise, wie Sie mit Breakout-Zonen handeln, verändert! Entwickelt von einem Team erfahrener Händler mit über 13 Jahren Handelserfahrung,       Quantum Breakout PRO       ist darauf ausgelegt, Ihre Handelsreise mit seiner innovativen und dynamischen Breakout-Zone-Strategie auf ein neues Niveau zu heben. Der Quantum Breakout Indicator zeigt Ihnen Signalpfeile auf Breakout-Zonen mit 5 Gewinnzielzone
TrendLine PRO MT5
Evgenii Aksenov
4.78 (49)
The Trend Line PRO indicator is an independent trading strategy. It shows the trend change, the entry point to the transaction, as well as automatically calculates three levels of Take Profit and Stop Loss protection Trend Line PRO is perfect for all Meta Trader symbols: currencies, metals, cryptocurrencies, stocks and indices Advantages of Trend Line PRO Never redraws its signals The possibility of using it as an independent strategy It has three automatic levels Take Profit and Stop Loss lev
Owl Smart Levels MT5
Sergey Ermolov
4.47 (36)
MT4-Version  |  FAQ Der Owl Smart Levels Indikator ist ein komplettes Handelssystem innerhalb eines Indikators, der so beliebte Marktanalysetools wie die fortschrittlichen Fraktale von Bill Williams , Valable ZigZag, das die richtige Wellenstruktur des Marktes aufbaut, und Fibonacci-Levels , die die genauen Einstiegslevels markieren, enthält in den Markt und Orte, um Gewinne mitzunehmen. Detaillierte Strategiebeschreibung Anleitung zur Verwendung des Indikators Berater-Assistent im Handel Owl H
Gartley Hunter Multi
Siarhei Vashchylka
5 (5)
Gartley Hunter Multi - An indicator for searching for harmonic patterns simultaneously on dozens of trading instruments and on all classic timeframes: (m1, m5, m15, m30, H1, H4, D1, Wk, Mn). Manual (Be sure to read before purchasing) | Version for MT4 Advantages 1. Patterns: Gartley, Butterfly, Shark, Crab. Bat, Alternate Bat, Deep Crab, Cypher 2. Simultaneous search for patterns on dozens of trading instruments and on all classic timeframes 3. Search for patterns of all possible sizes. Fr
Trend Line Map Pro MT5
STE S.S.COMPANY
4.67 (9)
Trend Line Map Indicator ist ein Add-On für Trend Screener Indicator. Es arbeitet als Scanner für alle Signale, die vom Trendscreener (Trendliniensignale) erzeugt werden. Es ist ein Trend Line Scanner basierend auf dem Trend Screener Indicator. Wenn Sie keinen Trend Screener Pro Indicator haben, funktioniert die Trend Line Map Pro nicht. It's a Trend Line Scanner based on Trend Screener Indicator. If you don't have Trend Screener Pro Indicator,     the Trend Line Map Pro will not work .
TrendDecoder Premium MT5
Christophe, Pa Trouillas
5 (1)
Top bewertet auf anderem MarketPlace -  Jetzt verfügbar auf METATRADER Identifizieren Sie Bereiche und die nächsten wahrscheinlichen Bewegungen     |    Erhalten Sie früheste Signale und die Stärke von Trends     |    Klare Ausstiegssignale vor Umkehrung     |    Erkennen Sie die Fibo-Levels, die der Kurs testen wird    |  Indikator, der nicht zurückverfolgt, nicht verzögert - ideal für den manuellen und automatisierten Trading - geeignet für alle Vermögenswerte und Zeiteinheiten - 50% Rabatt  
MetaBands M5
Vahidreza Heidar Gholami
4.67 (3)
MetaBands verwendet leistungsstarke und einzigartige Algorithmen, um Kanäle zu zeichnen und Trends zu erkennen, sodass es Tradern potenzielle Punkte für den Einstieg und Ausstieg aus Trades bieten kann. Es ist ein Kanalindikator sowie ein leistungsstarker Trendindikator. Es umfasst verschiedene Arten von Kanälen, die einfach durch Verwendung der Eingabeparameter zusammengeführt werden können. MetaBands verwendet alle Arten von Warnmeldungen, um Benutzer über Marktereignisse zu informieren. Funkt
TPSpro TRENDPRO  - is a trend indicator that automatically analyzes the market and provides information about the trend and each of its changes, as well as giving signals for entering trades without redrawing! The indicator uses each candle, analyzing them separately. referring to different impulses - up or down impulse. Exact entry points into transactions for currencies, crypto, metals, stocks, indices!  -  Version MT4                  DETAILED DESCRIPTION        /       TRADING SETUPS       
Was: $249  Now: $99   Market Profile defines a number of day types that can help the trader to determine market behaviour. A key feature is the Value Area, representing the range of price action where 70% of trading took place. Understanding the Value Area can give traders valuable insight into market direction and establish the higher odds trade. It is an excellent addition to any system you may be using. Inspired by Jim Dalton’s book “Mind Over Markets”, this indicator is designed to suit the
Zeichnen Sie automatisch Unterstützungs- und Widerstandsniveaus PLUS Antriebskerzenlücken auf Ihrem Chart ein, so dass Sie sehen können, wohin sich der Preis wahrscheinlich als Nächstes bewegen und/oder möglicherweise umkehren wird. Dieser Indikator wurde entwickelt, um als Teil der Positionshandelsmethodik verwendet zu werden, die auf meiner Website (The Market Structure Trader) gelehrt wird, und zeigt Schlüsselinformationen für die Zielsetzung und potenzielle Einstiege an. MT4 Version:  htt
Golden Spikes Detector
Batsirayi L Marango
5 (1)
Golden Spikes Detector This indicator is based on an advanced strategy primarily for trading spikes on Boom and Crash Indices. Complex algorithms were implemented to detect high probability entries only. It alerts on potential Buy and Sell entries. To trade spikes on the Deriv or Binary broker, only take Buy Boom and Sell Cash alerts. It was optimised to be loaded on 5-minute timeframe although multiple timeframe analysis is done in the background. Features ·             Desktop pop up and sound
Weitere Produkte dieses Autors
Supports And Resistances Lines
Francisco Gomes Da Silva
4.78 (40)
Indikator für Unterstützungs- und Widerstandszonen MT5 Dieser Indikator kann Hochs und Tiefs automatisch erkennen. Dieser Unterstützungs- und Widerstandsindikator erstellt Unterstützungslinien und Widerstandslinien basierend auf Hochs und Tiefs. wie man Unterstützungs- und Widerstandslinien erstellt. Dies ist ein Indikator, um automatische Unterstützungs- und Widerstandslinien zu erstellen. wie man das Unterstützungsniveau mit dem Indikator findet. Dieser Indikator findet automatisch Hochs und T
FREE
Sweet VWAP MT5
Francisco Gomes Da Silva
4.36 (14)
Erfahren Sie, wo große Institutionen handeln und optimieren Sie Ihre Investitionen mit dem kostenlosen VWAP Anchor Indicator Dieser Indikator wurde für erfahrene Trader entwickelt, die sich mit VWAP-Anchor-Strategien beschäftigen. Er bietet die nötige Geschwindigkeit, um das Verhalten des VWAP von bestimmten Ankerpunkten aus mit nur dem Mauszeiger zu analysieren. Hauptfunktionen: VWAP-Ankerpunkt: Die Hauptfunktion dieses Indikators besteht darin, zu zeigen, wie sich der VWAP verhalten würde, wen
FREE
Sweet VWAP Anchored MT5
Francisco Gomes Da Silva
5 (3)
Zeit sparen und fundiertere Entscheidungen treffen mit verankerten VWAPs Wenn Sie die Leistung dieses Tools testen möchten, können Sie den kostenlosen Anker-VWAP-Indikator für MT5 herunterladen. Dieser Indikator funktioniert nicht nur unabhängig, sondern ist auch eine Erweiterung der kostenlosen Sweet VWAP-Version. Das liegt daran, dass, wenn Sie auf die kostenlose Version klicken, der VWAP, den Sie am Mauszeiger sehen, fixiert wird. Und zur besseren Verständlichkeit, derjenige, der dort fixiert
Sweet VWAP Aux
Francisco Gomes Da Silva
4.25 (4)
Sparen Sie Zeit und treffen Sie präzisere Entscheidungen mit Sweet VWAP Aux Wenn Sie unser kostenloses VWAP-Indikator für Metatrader 4 noch nicht heruntergeladen haben, tun Sie es jetzt und erleben Sie seine erstaunlichen Fähigkeiten zur Visualisierung von verankertem VWAP. Kommen Sie dann hier zurück und lernen Sie Sweet VWAP Aux kennen - die perfekte Erweiterung für Ihren Sweet VWAP-Indikator. Mit nur einem Klick ermöglicht Ihnen Sweet VWAP, diesen VWAP-Indikator an dem von Ihnen gewählten Pun
Supports And Resistances Lines MTF MT4
Francisco Gomes Da Silva
4.89 (9)
Supports and Resistances wurde entwickelt, um Ihnen dabei zu helfen, Hochs und Tiefs automatisch in mehreren verschiedenen Zeitrahmen zu identifizieren und diese Hochs und Tiefs auf dem aktuellen Chart darzustellen. Kommen wir zur Erklärung der Entstehung von Resistenzen Es gibt ein Regelfeld, in dem Sie definieren können, was oben und unten ist. Die obere Regel ist standardmäßig wie folgt festgelegt: H[ 0 ]<=H[ 1 ] and H[ 1 ]=>H[ 2 ] Wo: Element Beschreibung H  bedeutet   Hoch [0]  bedeut
FREE
VWAP With Alerts
Francisco Gomes Da Silva
5 (2)
Dieser VWAP ist ein einfacher VWAP, aber wir haben Warnungen hinzugefügt, damit Sie wissen, wann der Preis den einfachen VWAP berührt oder den VWAP kreuzt. Dieser Indikator ist ein traditioneller VWAP-Indikator für den MetaTrader 5 (MT5). Die Standardparameter sind die des normalen VWAP, aber Sie haben die Möglichkeit, neue Berechnungen zu verwenden und das Beste daran: Wenn der Preis den VWAP berührt oder kreuzt, werden Sie durch Warnungen, Benachrichtigungen auf dem Handy, E-Mail oder Tonsigna
FREE
Bar Number
Francisco Gomes Da Silva
5 (2)
Kerzenzähler Dieser Indikator zählt Kerzen und zeigt ihre Anzahl basierend auf einem längeren Zeitraum an Langer Zeitraum Sie können den täglichen Zeitrahmen als " Bigger Timeframe " auswählen und ihn auf dem Chart mit dem kleinsten Zeitrahmen ausführen. dass der Zähler die Balken gemäß dem Tages-Chart zählt. Wenn Sie den Zeitrahmen " H1 " als Parameter übergeben, weiß der Indikator, wie Balken im H1-Diagramm zu zählen sind, er muss ihn nur auf Diagrammen mit kleineren Zeitrahmen ausführen. Der
FREE
Paula Bollinger Bands
Francisco Gomes Da Silva
5 (1)
Transformieren Sie Ihre Anlagestrategie mit dem Expert Advisor für den MetaTrader-Investorenroboter. Basierend auf der leistungsstarken Bollinger Bands-Strategie, die von Joe Ross entwickelt und vom renommierten brasilianischen Trader Rodrigo Cohen Paula genannt wurde, haben Sie Zugang zu fortschrittlicher Technologie, die Ihre Gewinne maximiert und Ihre Risiken minimiert. Verschwenden Sie keine Zeit mehr mit alten und ineffizienten Strategien. Mit unserem Anlegerroboter haben Sie Zugriff auf
FREE
OHLC Shifted
Francisco Gomes Da Silva
5 (3)
Schlusskurs des Vortages und Balkenverschiebung für MetaTrader! Der Indikator für den Schlusskurs des Vortages und die Balkenverschiebung ist ein Werkzeug, das entwickelt wurde, um die technische Analyse und Entscheidungsfindung im Trading zu verbessern. Mit diesem Indikator erhalten Sie detaillierte Informationen über die Eröffnungs-, Höchst-, Tiefst- und Schlusskursniveaus jedes Balkens, was eine präzise und umfassende Analyse der Marktbewegungen ermöglicht. Stellen Sie sich vor, Sie könnten e
FREE
Sweet VWAP
Francisco Gomes Da Silva
3.67 (3)
Entdecken Sie, wo große Institutionen handeln und optimieren Sie Ihre Investitionen mit dem kostenlosen VWAP-Anker-Indikator für MetaTrader 4. Entdecken Sie den Preis, zu dem große Institutionen Geschäfte tätigen, mit unserem kostenlosen VWAP-Anker-Indikator für MetaTrader 4! Jetzt können Sie wertvolle Zeit sparen, indem Sie das Plotten Ihrer verankerten VWAPs automatisieren, indem Sie sie an den Tops und Böden des Marktes verankern. Unsere kostenlose Version ermöglicht es Ihnen, die VWAP in Ech
FREE
VWAP With Alerts MT4
Francisco Gomes Da Silva
Dies ist ein einfacher VWAP, aber wir haben Benachrichtigungen eingebaut, die darüber informieren, wenn der Preis die VWAP-Linie erreicht oder durchbricht. Dieser Indikator ist ein traditioneller VWAP-Indikator für MetaTrader 4 (MT4). Die Standardeinstellungen entsprechen denen des normalen VWAP, aber Sie haben die Möglichkeit, die VWAP-Berechnung und das Beste daran zu ändern: Wenn der Preis die VWAP berührt oder durchbricht, werden Sie durch Alarme, Handybenachrichtigungen, E-Mails oder Tonsig
FREE
Auto Anchored VWAPs
Francisco Gomes Da Silva
Ergründen Sie Handels-Einblicke mit Auto Anchored VWAPs: Auto Anchored VWAPs dienen als Ihr leitender Begleiter in der Welt des Handels. Diese Indikatoren ermitteln entscheidende Wendepunkte im Markt und veranschaulichen sie auf Ihrem Chart mit VWAP-Linien. Dies ist ein Game-Changer für Händler, die verankerte VWAP-Strategien verwenden. Wie funktioniert es? Identifizieren von Hochpunkten: Wenn der Höchstkurs der aktuellen Kerze niedriger ist als der Höchstkurs der vorherigen, Und der vorherige H
FREE
Auto Anchored VWAPs MT4
Francisco Gomes Da Silva
5 (1)
Ergründen Sie Handels-Einblicke mit Auto Anchored VWAPs: Auto Anchored VWAPs dienen als Ihr leitender Begleiter in der Welt des Handels. Diese Indikatoren ermitteln entscheidende Wendepunkte im Markt und veranschaulichen sie auf Ihrem Chart mit VWAP-Linien. Dies ist ein Game-Changer für Händler, die verankerte VWAP-Strategien verwenden. Wie funktioniert es? Identifizieren von Hochpunkten: Wenn der Höchstkurs der aktuellen Kerze niedriger ist als der Höchstkurs der vorherigen, Und der vorherige H
FREE
Rule Plotter MT4
Francisco Gomes Da Silva
5 (1)
Wie erstellt man einen automatisierten Handelsroboter mit Rule Plotter Haben Sie sich jemals gefragt, wie mächtig es wäre, Ihre Handelsstrategien mit nur wenigen Mausklicks zu automatisieren? Stellen Sie sich vor, Sie hätten die Freiheit, verschiedene Handelsstrategien zu erstellen und zu testen, ohne sich in komplizierte Codes vertiefen zu müssen. Mit Rule Plotter wird diese Vision zur Realität. Hier zeigen wir Ihnen, wie Sie Ihren eigenen benutzerdefinierten Handelsroboter mit Rule Plotter ers
FREE
Bar Counter MT4
Francisco Gomes Da Silva
5 (6)
Candlestick-Zähler dieser Indikator zählt Kerzen, die sich auf dem Chart eines beliebigen Zeitrahmens befinden eine kostenlose Bartheke, die Sie auf mt4 herunterladen können der Candlestick-Zähler zählt, wie viele Kerzen sich in einem größeren Chart befinden mit diesem Kerzenzähler können Sie die automatische Kerzenzählung durchführen kostenloser Candlestick-Zählindikator zum automatischen Herunterladen und Zählen von Balken bar counter to count the bars count candle counter indicator mt4 count
FREE
OHLC Shifted MT4
Francisco Gomes Da Silva
5 (2)
Schlusskurs des Vortages und Balkenverschiebung für MetaTrader! Der Indikator für den Schlusskurs des Vortages und die Balkenverschiebung ist ein Werkzeug, das entwickelt wurde, um die technische Analyse und Entscheidungsfindung im Trading zu verbessern. Mit diesem Indikator erhalten Sie detaillierte Informationen über die Eröffnungs-, Höchst-, Tiefst- und Schlusskursniveaus jedes Balkens, was eine präzise und umfassende Analyse der Marktbewegungen ermöglicht. Stellen Sie sich vor, Sie könnten e
FREE
My Candle Patterns
Francisco Gomes Da Silva
5 (1)
Dieser Indikator ist eine Demo-Version der vollständigen My Candle, die hier heruntergeladen werden kann: Candle Patterns Creator Mit der Vollversion können Sie Ihre eigenen Candle-Regeln erstellen und ein traditionelles Candle-Muster so anpassen, dass es Ihrer Strategie entspricht. Der Indikator enthält mehrere Beispiele für Candle-Regeln, aber hier werde ich nur einige davon demonstrieren: Pattern Rule Candle Green C > O Candle Red C < O Doji C = O Hammer (C > O and (C-O) *2 < O-L and (C-O) *0
FREE
First Bar
Francisco Gomes Da Silva
TradeSystem Sie wählen an dem Tag einen Balken zum Handeln aus, wenn dieser Balken schließt, sendet der Roboter zwei Orders, eine beim Hoch, die andere beim Tief der Kerze, die wiederum die andere erhält, wird storniert StopLoss Der Stopp liegt beim Kauf einen Tick unter dem Tief oder beim Verkauf einen Tick über dem Hoch Gewinnmitnahme Der Take kann eingestellt werden, wie viel Sie von der Range des StopLoss wollen, er kann in der Strategieoptimierung angepasst werden Optimierung Dieser Roboter
FREE
Paula Bollinger Bands Strategy
Francisco Gomes Da Silva
4 (2)
Bollinger bands out/in strategy A strategy created by Joe Ross, and very useful for finding trades when the market is overloaded. Indicator You don't need to find where there are entries on the chart, this indicator shows them for you. The entrance The trade is confirmed when the price closes outside the bollinger bands on a candle and the candle after the price closes inside the bands. comment I want to improve this indicator, so you can help me sending me your reviews and comments, thanks :).
FREE
Fibonacci on ZigZag
Francisco Gomes Da Silva
4.93 (15)
Mouse You can draw fibonaccis moving the mouse over the zigzag indicator Pin them You can click on fibonacci with this option and it will no longer be deleted unless you click on it again :) Precision The tuned fibonacci gets the precise point in lower timeframes Enjoy it You can ask me for add more features, so please comment and leave your ranting for me to be happy, thank you :)
FREE
Rule Plotter Scanner
Francisco Gomes Da Silva
Hast du schon einmal daran gedacht, einen Scanner zu haben, der alle Strategien durchsucht und die Kauf- und Verkaufspunkte aller Zeiträume für dieses Asset gleichzeitig anzeigt? Genau das macht dieser Scanner. Dieser Scanner wurde entwickelt, um die Kauf- und Verkaufssignale anzuzeigen, die du im Rule Plotter: Strategieersteller ohne Programmierung erstellt hast, und sie in diesem Scanner auf verschiedenen Assets und Zeiträumen auszuführen. Die Standardstrategie des Rule Plotters besteht nur au
FREE
Rule Plotter Expert
Francisco Gomes Da Silva
5 (1)
Dieser Expert Advisor wurde entwickelt, um Ihre in dem Indikator Rule Plotter erstellten Strategien zu testen und auszuführen. Verwendung: Laden Sie den Indikator Rule Plotter - Werkzeug zur Erstellung von Handelssystemen ohne Programmierkenntnisse kostenlos herunter. Entwickeln Sie dann Ihre Strategien mit dem Rule Plotter-Indikator. Führen Sie schließlich Ihre erstellten Strategien mit diesem Expert Advisor aus. Parameter: Strategie: Ihr im Rule Plotter-Indikator erstelltes Handelssystem. Lot:
Trailing on Last Top Bottom
Francisco Gomes Da Silva
5 (1)
Dieses Tool setzt Stopps auf Ihre Positionen Testen Sie schnell mit dem Metatrade Strategy Tester. Im Falle einer Long-Position befindet sich Ihr Stopp am letzten Tiefpunkt Oder Ihr Stopp wird im Falle einer Short-Position ganz oben sein Darüber hinaus verwaltet dieses Tool das Trailing Ihrer offenen Positionen. Setzen Sie Ihren Stopp immer auf das zuletzt gebildete Hoch oder das zuletzt gebildete Tief Um die Hochs und Tiefs zu erstellen, verwende ich den kostenlosen Indikator „Supports an
Trailing on Last Top Bottom MT4
Francisco Gomes Da Silva
5 (1)
Entdecken Sie die Macht des Risikomanagements mit Price Action, um Ihre Stop-Loss-Orders zu positionieren! Haben Sie schon einmal die Situation erlebt, in der Sie genau wissen, wann Sie in einen Trade einsteigen sollen, aber unsicher sind, wann der richtige Zeitpunkt zum Ausstieg ist? Keine Sorge, Sie sind nicht allein! Viele Trader stehen täglich vor dieser Herausforderung. Die gute Nachricht ist, dass unsere auf Price Action basierte Risikomanagement-Tool genau dieses Problem löst. Während Sie
Pattern Wizard
Francisco Gomes Da Silva
Patterns Wizard ist ein Tool zur Erstellung von Kerzenmustern. Mit ihm können Sie verschiedene Muster erstellen und beliebig viele Instanzen dieses Indikators zu Ihrem Chart hinzufügen, jede mit einem anderen Muster. Um das Funktionieren der Erstellung von Formeln besser zu verstehen, können Sie Beispiele von   dem Indikator My Candle verwenden, der mehr als 70 Beispiele für Kerzenmuster enthält . Der Hauptunterschied dieses Indikators besteht darin, dass er über 30 Regelparameter verfügt. Dies
FREE
Rule Plotter Expert MT4
Francisco Gomes Da Silva
5 (1)
Handeln Sie Ihre im Rule Plotter Indikator erstellten Strategien mit dem Rule Plotter Experten: Nun, da Sie Ihre benutzerdefinierten Strategien mit dem Rule Plotter Indikator erstellt und die Pfeile auf dem Chart gesehen haben, die Ein- und Ausstiegspunkte anzeigen, ist es an der Zeit, diesen Strategien auf den Finanzmärkten Leben einzuhauchen. Mit dem Rule Plotter Experten können Sie autonom und präzise handeln, basierend auf diesen Pfeilen, und das volle Potenzial Ihrer Strategien nutzen. Umse
Hide Scale
Francisco Gomes Da Silva
5 (1)
Hide Scale - Tool für Trader, die mehr Platz auf dem Bildschirm benötigen Anweisungen Drücken Sie "T", um die Zeitskala auszublenden, und "P", um die Preis-Skala auszublenden. Sie können diese Tasten anpassen, indem Sie auf die entsprechende Schaltfläche klicken und eine neue Taste auf der Tastatur eingeben. Um beide Skalen gleichzeitig auszublenden, können Sie beiden Optionen dieselbe Taste zuweisen. Um die Skalen wieder anzuzeigen, drücken Sie einfach die entsprechende Taste erneut. Warum wir
FREE
TrendPlator
Francisco Gomes Da Silva
TrendLines Plator: Maximieren Sie Ihre Handelsstrategien mit einem fortschrittlichen Trendprognoseindikator Entdecken Sie das Potenzial unseres innovativen Indikators! Mit der Fähigkeit, Trendlinien auf größeren Zeitebenen direkt in Ihrem aktuellen Zeitrahmen zu analysieren und zu projizieren, bietet er eine strategische Unterstützung, die die Aufmerksamkeit von Händlern auf sich zieht. Diese Punkte werden zu strategischen Unterstützungs- oder Widerstandsniveaus für Ihre Operationen, die Ihre Ha
Hide Scale MT4
Francisco Gomes Da Silva
5 (2)
Hide Scale - Das ideale Tool für Trader, die den Platz auf dem Chart maximieren möchten Wie man Hide Scale verwendet Drücken Sie "T", um die Zeitachse auszublenden, und "P", um die Preisachse auszublenden. Sie können die Tastenkombinationen anpassen, indem Sie auf die entsprechenden Schaltflächen klicken und für jede Funktion eine neue Taste auswählen. Wenn Sie beide Skalen gleichzeitig ausblenden möchten, können Sie für beide Optionen dieselbe Taste zuweisen. Um die Skalen wieder anzuzeigen, dr
FREE
Pattern Wizard MT4
Francisco Gomes Da Silva
Patterns Wizard ist ein Tool zur Erstellung von Kerzenmustern. Mit ihm können Sie verschiedene Muster erstellen und beliebig viele Instanzen dieses Indikators zu Ihrem Chart hinzufügen, jede mit einem anderen Muster. Um das Funktionieren der Erstellung von Formeln besser zu verstehen, können Sie Beispiele von   dem Indikator My Candle verwenden, der mehr als 70 Beispiele für Kerzenmuster enthält . Der Hauptunterschied dieses Indikators besteht darin, dass er über 30 Regelparameter verfügt. Dies
Auswahl:
Elsier Jimenez
36
Elsier Jimenez 2024.04.07 23:29 
 

Excelente herramienta para automatizar una estrategia. Felicitaciones al desarrollador.

Francisco Gomes Da Silva
72737
Antwort vom Entwickler Francisco Gomes Da Silva 2024.04.08 20:49
Muchas gracias por usar y por esta gratificante reseña, Sr. Elsier
Moeen Ghiyas
299
Moeen Ghiyas 2024.03.10 09:30 
 

It's an excellent indicator, though difficult to understand initially as it took me a few days to comprehend. Anyhow your effort and idea are highly appreciated. ...... It needs little improvement as at present it does not provide nesting (use of parenthesis within rules for logical AND /OR operations), the same is available in Math Operation but misses logical AND / OR operation there as well. Suggested improvement will make it awesome, but I will still give it 5-star rating based on your idea and effort.

Francisco Gomes Da Silva
72737
Antwort vom Entwickler Francisco Gomes Da Silva 2024.03.10 14:20
Thank you very much for your 5 star rating and your review Moeen, in fact it is a little difficult to understand initially, as the previous knowledge should be programming logic, but after mastering the tool, we can automate infinite combinations, especially after fix this alignment that you said, even I didn't understand exactly, but perhaps what you said can be resolved by pressing the back button and revisiting the rule by pressing the edit button again, in the current version Rule Plotter 1.7, will make it have more fields available for add more AND/OR logic
MickeBo
120
MickeBo 2024.03.02 19:35 
 

I highly recommend this tool and I'm glad to be able to use it! The purpose of this tool is to enter and save an existing strategy in order to then receive current entry signals in the form of arrows during operation according to the parameters I previously entered. It took me a while at the beginning to understand how to enter the parameters and I had a lot of help from Francisco, thank you very much for that! Once everything was entered and saved, everything worked perfectly. I receive entry arrows according to my strategy and I am very happy about this as it makes trading much clearer and easier for me. I don't want to miss it anymore, a really great tool that's worth trying. It is also possible to do a backtest with the saved parameters using the Rule Plotter EA and thus test the entered strategy - what more could you want? I can also highly recommend Francisco, his programming is flawless, he is very helpful and patient and I will always be happy to come back to him if there is a need for an indicator or an EA. Thank you, Francisco, for everything!!

Francisco Gomes Da Silva
72737
Antwort vom Entwickler Francisco Gomes Da Silva 2024.03.03 20:52
Thank you so much for sharing your experience with Rule Plotter, MickeBo! I truly appreciate your fantastic review and the time you took to provide it. Your feedback means a lot to me, and I am thrilled to hear that you found the tool helpful in your trading journey. I also want to extend our gratitude for your patience and cooperation throughout the process. It's customers like you that motivate us to continually improve and provide the best service possible. If you ever need further assistance or have any questions, please don't hesitate to reach out. We're here to help and support you every step of the way. Thanks again for choosing Rule Plotter, and I wish you continued success in your trading endeavors!
Evgeny Belyaev
87639
Evgeny Belyaev 2023.11.01 00:16 
 

Convenient tool.

Francisco Gomes Da Silva
72737
Antwort vom Entwickler Francisco Gomes Da Silva 2023.11.01 08:54
thank you for your reviews Evgeny Belyaev
Antwort auf eine Rezension
Version 1.9 2024.03.10
+ Saubere Regeln speichern
- Verhindern, dass Strategie Null mit dem Standardwert gefüllt wird
Version 1.7 2024.02.22
Es ist jetzt möglich, eine Signalregel zu definieren, um die Position zu schließen.
Version 1.6 2024.02.19
Kompatibilität mit mehr Indikatoren
Version 1.5 2024.02.06
In dieser Version exportieren wir die Strategie im .txt-Format, da es ein akzeptiertes Format für die Anlage im Forum ist.
Version 1.4 2024.01.31
- Der Wert im Indikatorfenster wird jetzt am Chartpunkt aktualisiert, an dem sich die Maus befindet
Version 1.3 2023.12.02
+ Überprüfen Sie auch nach dem Schließen der Kerze das Kerzen-in-Fortschritt-Alarmsignal erneut.
Version 1.2 2023.11.30
Wenn ein Signalpfeil erscheint:
+ Tonbenachrichtigung
+ Alarm auf MetaTrader
+ Smartphone-Push-Benachrichtigung
+ E-Mail-Benachrichtigung
Version 1.1 2023.11.26
Layout für Import und Export von Strategien