• Übersicht
  • Bewertungen (2)
  • Diskussion
  • Neue Funktionen

Vertical Volume

5

Merkmal


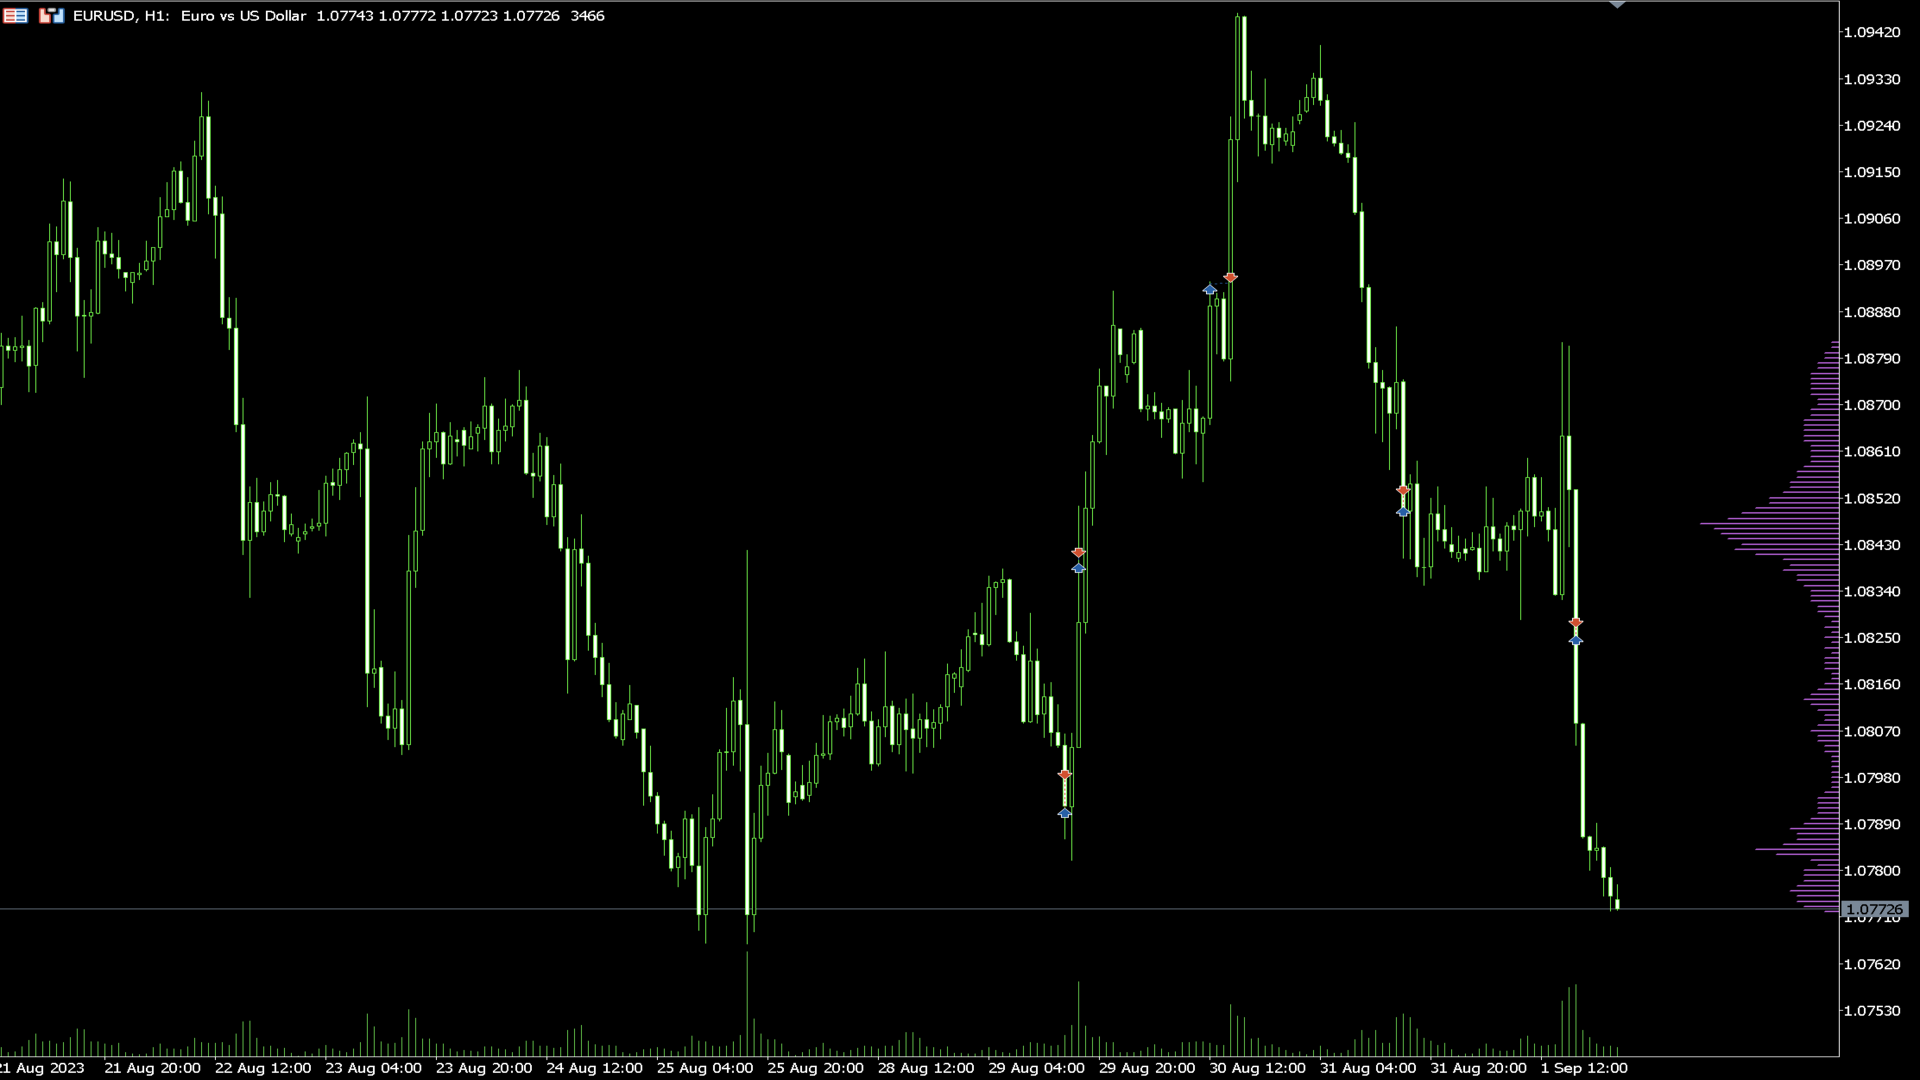
  • Indikator zur Überprüfung des Volumens nach Preis.
  • Funktioniert hauptsächlich für EURUSD, bei anderen Währungspaaren kann es nicht funktionieren oder die Berechnung kann lange dauern.
  • Für reibungslose Verwendung aktivieren Sie die Option "Ende der Diagrammgrenze vom rechten Rand verschieben", wie im Screenshot dargestellt.
  • Wenn eine neue Balken-Daten erscheint, werden die Daten zurückgesetzt.


Variablen

  • COlOR: Einstellung der Farbe des Indikators
  • WIDTH: Einstellung der Breite des Indikators
  • PERIOD: Ermittlung des Zeitraums zur Berechnung der Daten


Bewertungen 2
xlxAxlx
712
xlxAxlx 2024.01.31 17:53 
 

Thank you...

ceseixas
66
ceseixas 2023.10.19 03:31 
 

Olá. Parece bem interessante o indicador. Mas não consigo fazê-lo aparecer na versão demo. Tentei no Mini dólar (WDO) e Mini índice (WIN) no gráfico de 5 minutos. Mas nem abre a tela de configuração. Tem alguma idéia ?

Empfohlene Produkte
Funktionen Indikator für Fibonacci-Retracement-Handel Ein Fibonacci-Diagramm wird basierend auf der vorherigen ausgewählten Kerze von 1H, 4H, 1D und 1W gezeichnet. Wenn der Marktpreis das Fibonacci-Niveau berührt, ändert sich die Farbe und die Berührungszeit wird angezeigt. Das Fibonacci-Diagramm wird bei den Niveaus -23.6, 0, 23.6, 38.2, 50, 61.8, 76.4, 100 und 123.6 gezeichnet und das Diagramm wird aktualisiert, wenn die Kerze aktualisiert wird. Variablen Zeitrahmen: Ein Fibonacci-Diag
FREE
Whether you're an analyst looking for a Fibonacci charting platform for Fibonacci Ratio analysis, or a trader looking for an advanced Fibonacci trading tool, Ultimate Fibonacci  has what you need. Ultimate Fibonacci   has the most advanced and full-featured Fibonacci charting and trading software on the market. GIVE ME A GOOD RATING! Ultimate Fibonacci  measures and calculates Fibonacci projections and Retracement levels for you, as well as Price projections (like Wave 2 vs. 1 or Wave 4 vs. 2
FREE
Fair Value Gap Scanner
Usiola Oluwadamilol Olagundoye
The Fair Value Gap Detector is a MetaTrader 5 indicator designed to identify and draw rectangles on the chart wherever fair value gaps (FVGs) are detected. Fair value gaps occur when there is a significant disparity between the current price and the fair value of an asset. These gaps can provide valuable insights into potential trading opportunities, as they often indicate overbought or oversold conditions in the market. Key Features: FVG Detection: The indicator utilizes a proprietary algorith
FREE
VWAP Simple
Deibson Carvalho
4.03 (33)
The Volume Weighted Average Price is similar to a moving average, except volume is included to weight the average price over a period.    Volume-Weighted Average Price [VWAP] is a dynamic, weighted average designed to more accurately reflect  a security’s true average price over a given period . Mathematically, VWAP is the summation of money (i.e., Volume x Price) transacted divided by the total volume over any time horizon, typically from market open to market close. VWAP reflects the capital
FREE
NakaTrend
Ricardo De Andrade Nakano
"Präsentieren Sie NakaTrend: Ihr ultimativer Trenddetektor für MetaTrader 5! Bereit, Ihr Handelserlebnis zu revolutionieren? Lernen Sie NakaTrend kennen, Ihren zuverlässigen Indikator zur präzisen und einfachen Identifizierung von Trendwechseln. Mit NakaTrend verpassen Sie nie wieder die Gelegenheit, Marktschwankungen zu nutzen. Wenn ein Bullentrend entsteht, signalisiert NakaTrend dies mit einem grünen Dollarzeichen und fordert Sie auf, eine Kauforder zu platzieren. Und wenn sich die Stimm
FREE
Sentiment Liner This is a steroidised Daily-Weakly-Monthly high-low and open, must have indicator. With this stuff user can determine the average of (daily-weakly-montly) open levels. 4 example: if you in day mode switch the average to 5, you get the 5 day sentiment. In weakly mode turn the average to 4, than you get the 4 weak sentiment,...so on. Naturally one can us as a simple day-week-month high and low indikator. S1: high S2: low Pivot: open, Average: averager
FREE
AliPivot Points is a Meta Trader 5 Indicator that draws you the latest pivot points. You can choose from timeframes ranging from 1 Minute to 1 Month. Calculation methods for pivot points includes: Classic Pivot Points Camarilla Pivot Points Fibonacci Pivot Points Woodie Pivot Points You can personalize the line colors, style, and width to suit your preference. The indicator displays values on the right side of the chart. AliPivot Points values can also be utilized by developers for creating Expe
FREE
The selective pin bar is designed to identify reversals. To use the selective pin bar effectively, traders typically look for Strong Rejection: The tail of the pin bar should extend significantly beyond the surrounding price action. It indicates that there was a sharp rejection of higher or lower prices during the trading period. A strong rejection suggests that the market sentiment may be changing.
FREE
TickChart Indicator plots tick line on the main window of MetaTrader. In the Lite version, the number of ticks is limited to 20 and the alert function described below is omitted.  The tick-line shows the most detailed, fastest and real-time activities of the market, which are usually hidden in bars or candles longer than 1 minute. Usually, several new tick-line segments appear while a bar of M1 time frame is completed. After the release of an important economic indicator, the number of ticks pe
FREE
Activity Power
Zoltan Nemet
5 (4)
Multi time frame, multy currency special swing volume indicator with engulfing waves too. Simpler to use compare to Weis Wave. User don't need to adjust wave size. Just use of the basic or the upper time frames. As a multi time frame indikator user can do  very complex time frame analysyses. As well as a multy currency indicator one can make market sector-segment analysyses. Use with Wckoff principles.
FREE
Standard PVSR
Ashok Kumar Singha
Standard PVSR is based on Pivot Points. Steps to Setup the Indicator: Install the Custom Indicator; Set all the Lines Color, Width and Styles; Set visualization to All Timeframe; and DONE It can be used for: All Pairs: Forex, Cryptocurrencies, Metals, Stocks, Indices etc. All Timeframe All Brokers All type of Trading Style like Scalping, Swing, Intraday, Short-Term, Long-Term etc. Multiple Chart -->> For any Type of Support, Guidance, Setup Issue, EA Optimization, Input Setup etc.
FREE
Amiguinhos Bar Counter
Eduardo Correia Da Silva
3 (2)
Amiguinho's Bar Counter is a price action indicator to display the bar count (candles) with some interesting options. About the "Period of analysis" parameter: if the current timeframe is in minutes, then the analysis period will be considered in days; if the current timeframe is in days, then the analysis period will be considered in months; or  if the period of analysis will be considered in years.
FREE
QuantumAlert RSI Navigator is a free indicator available for MT4/MT5 platforms, its work is to provide "alerts" when the market is inside "overbought and oversold" regions in the form of "buy or sell" signals. This indicator comes with many customization options mentioned in the parameter section below, user can customise these parameters as needful. Join our MQL5 group , where we share important news and updates. You are also welcome to join our private channel as well, contact me for the priva
FREE
This EA is named Dinosaur Hunter(DH) because it can capture very large trend, such as 5000-10000 pips. DH trades infrequently as it patiently waits for the right market conditions. DH can load multiple currency pairs on a single chart to increase the number of trades. Live Signal This is a demo version that only for fixed lot size of 0.01. To obtain the full version, please purchase Dinosaur Hunter Pro . This EA has been tested from 2015 to the present. The test used data from Dukascopy. If
FREE
Large Price MT5
Nino Guevara Ruwano
For traders, monitoring price movements is a constant activity, because each price movement determines the action that must be taken next. This simple indicator will helps traders to display prices more clearly in a larger size. Users can set the font size and choose the color that will be displayed on the chart. There are three color options that can be selected to be displayed on the chart.
FREE
RSI Chart Levels
Nikolay Mitrofanov
5 (6)
The indicator draws levels based on the overbought and oversold values ​​of the RSI indicator. The maximum values ​​are taken into account, which are equal to or exceeded certain limits. That is, for example, when the price has gone into the overbought zone, the highest price is selected from all prices in this zone for this period of time, and as soon as the indicator value returns to a value below the overbought value, the level is fixed and the calculation of new values ​​begins. The sam
FREE
Highly configurable Average True Range (ATR) indicator. Features: Highly customizable alert functions (at levels, crosses, direction changes via email, push, sound, popup) Multi timeframe ability Color customization (at levels, crosses, direction changes) Linear interpolation and histogram mode options Works on strategy tester in multi timeframe mode (at weekend without ticks also) Adjustable Levels Parameters: ATR Timeframe: You can set the lower/higher timeframes for ATR. ATR Bar Shift: y
FREE
Value Chart Candlesticks
Flavio Javier Jarabeck
4.67 (9)
The idea of a Value Chart indicator was presented in the very good book I read back in 2020 , " Dynamic Trading Indicators: Winning with Value Charts and Price Action Profile ", from the authors Mark Helweg and David Stendahl. The idea is simple and the result is pure genius: Present candlestick Price analysis in a detrended way! HOW TO READ THIS INDICATOR Look for Overbought and Oversold levels. Of course, you will need to test the settings a lot to find the "correct" one for your approach.
FREE
Pivot Point Supertrend (corresponds to Pivot Point Super Trend indicator from Trading View) Pivot Point Period:    Pivot point defined as highest high and highest low... input 2 = defining highest high and highest low with 2 bars on each side which are lower (for highest high) and are higher (for lowest low calculation) ATR Length  : the  ATR  calculation is based on 10 periods ATR Factor: ATR multiplied by 3
FREE
A countdown timer for the  Volume bar chart generator  and  Tick chart generator  products, which are available for download from the MQL5 Market: Tick chart generator: https://www.mql5.com/en/market/product/29215 Volume bar chart generator: https://www.mql5.com/en/market/product/47197 The counter conveniently displays the number of ticks or transactions (depending on the chart) that need to pass for a new bar to start printing. The user can set the following indicator inputs. Volume type
FREE
My Candle Patterns
Francisco Gomes Da Silva
5 (1)
Dieser Indikator ist eine Demo-Version der vollständigen My Candle, die hier heruntergeladen werden kann: Candle Patterns Creator Mit der Vollversion können Sie Ihre eigenen Candle-Regeln erstellen und ein traditionelles Candle-Muster so anpassen, dass es Ihrer Strategie entspricht. Der Indikator enthält mehrere Beispiele für Candle-Regeln, aber hier werde ich nur einige davon demonstrieren: Pattern Rule Candle Green C > O Candle Red C < O Doji C = O Hammer (C > O and (C-O) *2 < O-L and (C-O) *0
FREE
This indicator is stand alone version from  MP Pivot Levels  (All in one) containing Woodie Pivots. Woodie’s pivot points are made up of multiple key levels, calculated from past price points, in order to frame trades in a simplistic manner. The key levels include the ‘pivot’ itself, and multiple support and resistance levels (usually up to three each). Traders use these levels as a guide for future price movements when setting up trades. The pivot : (Previous high + previous low + 2 x previou
FREE
Camarilla Swing Trade Indicator is an Indicator. Support and resistance points are calculated from the High Low Close of the previous TF Week's price. What are Camarilla Pivot Points? 1.Camarilla Pivot Points is a modified version of the classic Pivot Point. 2.Camarilla Pivot Points was launched in 1989 by Nick Scott, a successful bond trader. 3.The basic idea behind Camarilla Pivot Points is that price tends to revert to its mean until it doesn't. 4.Camarilla Pivot Points is a mathematical
FREE
Simple Weis Wave
Jean Jacques Huve Ribeiro
4.2 (5)
One of the best tools for analyzing volume, Weis Wave was idelized by David Weis, to facilitate the reading of directional flow. For the VSA method disciples it is an evolution of the practices created by Richard Wycoff, facilitating a predictive reading of the market, always seeking an accumulation and distribution of the negotiated contracts. Cumulative wave volume  Range of wave ( removed) Average Wave volume Ref "Tim Ord lectures" ( removed)
FREE
All in 1 Propsense MT5
Mark Bernardinis
5 (2)
Apply to the 5 minute timeframe against the major USD forex pairs. AUDUSD EURUSD GBPUSD USDCAD USDCHF USDJPY Highlights the PropSense Book Levels Turn on/off for Sydney, Asia, London and New York Sessions Shows the Tokyo and London Fixes Turn on/off for Tokyo and London Configure how many historical fixes to show Shows the Sessions Turn on/off visible indication for sessions (supports 4 sessions) Visibly shows the sessions (out of the box configuration for Sydney, Tokyo, London and New York) Hig
FREE
Free automatic Fibonacci is an indicator that automatically plots a Fibonacci retracement based on the number of bars you select on the BarsToScan setting in the indicator. The Fibonacci is automatically updated in real time as new highest and lowest values appears amongst the selected bars. You can select which level values to be displayed in the indicator settings. You can also select the color of the levels thus enabling the trader to be able to attach the indicator several times with differe
FREE
Graphic Alignment Context
Ricardo Alexandre Laurentino
The Graphic Alignment Context (GAC) Technical Indicator measures the vertical difference of the simple average price of a financial instrument in the context of three different timeframes determined by a defined number of bars or candles (periods) to determine the strength of the buy or sell trend. sale. Ascending average prices indicate Buying strength (1), Descending average prices indicate Selling strength (-1) and any scenario different from the previous two conditions indicates Neutrality
FREE
Gatotkaca Support Resistance Trendline Indicator is a simple indicator that detects support, resistance and trendlines. It will helps you find breakout momentum based on lines calculated by this indicator. This is conceptually based on fractals, but with customizable periods.  Compatible for any timeframes. You can customize how this indicator work by setting up the period input.
FREE
VWAP Indicator
LUC JACOBUS A VERHEECKE
4.19 (21)
Volume Weighted Average Price (VWAP) The volume weighted average price (VWAP) is a   trading   benchmark   used by traders that gives the average price a security has traded at throughout the day, based on both volume and price. It is important because it provides traders with insight into both the trend and value of a security. This indicator VWAP V2 is free and is the manual version of the extended Easy VWAP indicator (30 Euro), where the date and time properties are automatically entered. Wit
FREE
Supports And Resistances Lines
Francisco Gomes Da Silva
4.78 (40)
Indikator für Unterstützungs- und Widerstandszonen MT5 Dieser Indikator kann Hochs und Tiefs automatisch erkennen. Dieser Unterstützungs- und Widerstandsindikator erstellt Unterstützungslinien und Widerstandslinien basierend auf Hochs und Tiefs. wie man Unterstützungs- und Widerstandslinien erstellt. Dies ist ein Indikator, um automatische Unterstützungs- und Widerstandslinien zu erstellen. wie man das Unterstützungsniveau mit dem Indikator findet. Dieser Indikator findet automatisch Hochs und T
FREE
Käufer dieses Produkts erwarben auch
Zunächst einmal ist es wichtig zu betonen, dass dieses Handelssystem ein Nicht-Repainting-, Nicht-Redrawing- und Nicht-Verzögerungsindikator ist, was es sowohl für manuelles als auch für automatisches Trading ideal macht. Das "Smart Trend Trading System MT5" ist eine umfassende Handelslösung, die für neue und erfahrene Trader maßgeschneidert ist. Es kombiniert über 10 Premium-Indikatoren und bietet mehr als 7 robuste Handelsstrategien, was es zu einer vielseitigen Wahl für verschiedene Marktbe
Atomic Analyst MT5
Issam Kassas
4.82 (11)
Zunächst einmal ist es erwähnenswert, dass dieser Handelsindikator nicht neu malt, nicht neu zeichnet und keine Verzögerung aufweist, was ihn sowohl für manuellen als auch für Roboterhandel ideal macht. Der Atom-Analyst ist ein PA-Preisaktionsindikator, der die Stärke und das Momentum des Preises nutzt, um einen besseren Vorteil auf dem Markt zu finden. Ausgestattet mit fortschrittlichen Filtern, die helfen, Rauschen und falsche Signale zu entfernen, und das Handelspotenzial zu erhöhen. Durch
FX Volume MT5
Daniel Stein
4.94 (17)
Erhalten Sie Ihr tägliches Marktupdate mit Details und Screenshots über unser Morning Briefing hier auf mql5 und auf Telegram ! FX Volume ist der ERSTE und EINZIGE Volumenindikator, der einen ECHTEN Einblick in die Marktstimmung aus Sicht eines Brokers bietet. Es bietet fantastische Einblicke in die Positionierung von institutionellen Marktteilnehmern, wie z.B. Brokern, auf dem Forex-Markt, viel schneller als COT-Berichte. Diese Informationen direkt auf Ihrem Chart zu sehen, ist der wahre Game
Quantum Trend Sniper
Bogdan Ion Puscasu
5 (37)
Wir stellen vor       Quantum Trend Sniper Indicator   , der bahnbrechende MQL5-Indikator, der die Art und Weise, wie Sie Trendumkehrungen erkennen und handeln, verändert! Entwickelt von einem Team erfahrener Händler mit über 13 Jahren Handelserfahrung,       Quantum Trend Sniper-Indikator       wurde entwickelt, um Ihre Trading-Reise mit seiner innovativen Methode zur Identifizierung von Trendumkehrungen mit extrem hoher Genauigkeit auf ein neues Niveau zu heben. ***Kaufe Quantum Trend Snipe
Trend Screener Pro MT5
STE S.S.COMPANY
4.89 (61)
Nutzen Sie die Macht des Trendhandels mit Trend Screener Indicator: Ihrer ultimativen Trendhandelslösung, die auf Fuzzy-Logik und einem System mit mehreren Währungen basiert! Steigern Sie Ihren Trendhandel mit Trend Screener, dem revolutionären Trendindikator mit Fuzzy-Logik. Es handelt sich um einen leistungsstarken Trendfolgeindikator, der über 13 Premium-Tools und -Funktionen sowie 3 Handelsstrategien kombiniert und ihn zu einer vielseitigen Wahl macht, um Ihren Metatrader in einen Trendanaly
Gold Stuff mt5
Vasiliy Strukov
4.89 (166)
Gold Stuff mt5-Ein Trendindikator, der speziell für Gold entwickelt wurde, kann auch auf allen Finanzinstrumenten verwendet werden. Der Indikator wird nicht neu gezeichnet und verzögert sich nicht. Empfohlener Zeitrahmen H1. WICHTIG! Kontaktieren Sie mich sofort nach dem Kauf, um Anweisungen und Bonus zu erhalten! DATEN Draw Arrow - inkl.aus. zeichnen von Pfeilen in einem Diagramm. Alerts-inkl.aus.akustische Warnungen. E - mail notification-inkl.aus. benachrichtigungen per E-Mail. Puch-
Zunächst einmal ist es wichtig zu betonen, dass dieses Handelstool ein Nicht-Repaint-, Nicht-Redraw- und Nicht-Verzögerungsindikator ist, was es ideal für professionelles Trading macht. Der Smart Price Action Concepts Indikator ist ein sehr leistungsstarkes Werkzeug sowohl für neue als auch erfahrene Händler. Er vereint mehr als 20 nützliche Indikatoren in einem und kombiniert fortgeschrittene Handelsideen wie die Analyse des Inner Circle Traders und Strategien des Smart Money Concepts. Diese
Dies ist ein Indikator für MT5, der genaue Signale für den Einstieg in einen Handel ohne Repainting (Neuzeichnen) liefert. Er kann auf alle Finanzwerte angewendet werden: Forex, Kryptowährungen, Metalle, Aktien, Indizes. Er liefert ziemlich genaue Schätzungen und sagt Ihnen, wann es am besten ist, eine Position zu eröffnen und zu schließen. Sehen Sie sich das Video (6:22) mit einem Beispiel für die Verarbeitung nur eines Signals an, das sich für den Indikator gelohnt hat! Die meisten Händler ver
FX Power MT5 NG
Daniel Stein
5 (4)
Erhalten Sie Ihr tägliches Marktupdate mit Details und Screenshots über unser Morning Briefing hier auf mql5 und auf Telegram ! FX Power MT5 NG ist die nächste Generation unseres langjährig sehr beliebten Währungsstärkemessers FX Power. Und was bietet dieser Stärkezähler der nächsten Generation? Alles, was Sie am ursprünglichen FX Power geliebt haben PLUS GOLD/XAU-Stärkeanalyse Noch präzisere Berechnungsergebnisse Individuell konfigurierbare Analysezeiträume Anpassbares Berechnungslimit für noc
RelicusRoad Pro MT5
Relicus LLC
4.82 (22)
Jetzt 147 US -Dollar (nach ein paar Aktualisierungen auf 499 US -Dollar) - Unbegrenzte Konten (PCs oder MACs) RelicusRoad Benutzerhandbuch + Schulungsvideos + Zugang zur privaten Discord-Gruppe + VIP-Status EINE NEUE ART, DEN MARKT ZU BETRACHTEN RelicusRoad ist der weltweit leistungsstärkste Handelsindikator für Forex, Futures, Kryptowährungen, Aktien und Indizes und gibt Händlern alle Informationen und Tools, die sie benötigen, um profitabel zu bleiben. Wir bieten technische Analysen un
Auto Order Block with break of structure based on ICT and Smart Money Concepts Futures Break of Structure ( BoS )             Order block ( OB )            Higher time frame Order block / Point of Interest ( POI )    shown on current chart           Fair value Gap ( FVG ) / Imbalance   ,  MTF      ( Multi Time Frame )    Volume Imbalance     ,  MTF          vIMB Gap’s Equal High / Low’s     ,  MTF             EQH / EQL Liquidity               Current Day High / Low           HOD /
XQ Indicator MetaTrader 5
Marzena Maria Szmit
5 (1)
Step into the realm of Forex trading with confidence and precision using XQ, a cutting-edge Forex indicator designed to elevate your trading game to unprecedented heights. Whether you're a seasoned trader or just stepping into the world of currency exchange, XQ Forex Indicator empowers you with the insights and signals needed to make informed trading decisions. The signal conditions are a combination of three indicators, and XQ Forex Indicator only display  medium and long-term trends . The ind
Blahtech Supply Demand MT5
Blahtech Limited
4.57 (14)
Was: $299  Now: $99   Supply Demand uses previous price action to identify potential imbalances between buyers and sellers. The key is to identify the better odds zones, not just the untouched ones. Blahtech Supply Demand indicator delivers functionality previously unavailable on any trading platform. This 4-in-1 indicator not only highlights the higher probability zones using a multi-criteria strength engine, but also combines it with multi-timeframe trend analysis, previously confirmed swings
Advanced Supply Demand MT5
Bernhard Schweigert
4.53 (15)
Derzeit 33% Rabatt! Die beste Lösung für jeden Anfänger oder erfahrenen Händler! Dieser Indikator ist ein einzigartiges, qualitativ hochwertiges und erschwingliches Trading-Tool, da wir eine Reihe von proprietären Funktionen und eine neue Formel integriert haben. Mit diesem Update werden Sie in der Lage sein, doppelte Zeitrahmenzonen anzuzeigen. Sie können nicht nur einen höheren TF (Zeitrahmen) anzeigen, sondern sowohl den Chart-TF als auch den höheren TF: SHOWING NESTED ZONES. Alle Supply Dema
ICT, SMC, SMART MONEY CONCEPTS, SMART MONEY, Smart Money Concept, Support and Resistance, Trend Analysis, Price Action, Market Structure, Order Blocks, BOS/CHoCH,   Breaker Blocks ,  Momentum Shift,   Supply&Demand Zone/Order Blocks , Strong Imbalance,   HH/LL/HL/LH,    Fair Value Gap, FVG,  Premium  &   Discount   Zones, Fibonacci Retracement, OTE, Buy Side Liquidity, Sell Side Liquidity, BSL/SSL Taken, Equal Highs & Lows, MTF Dashboard, Multiple Time Frame, BigBar, HTF OB, HTF Market Structure
Der Gann Square Indikator ist ein leistungsstolles Marktanalyse-Tool, das auf dem Artikel "Mathematische Formel für Marktvorhersagen" von W.D. Gann basiert. Dieses Tool verwendet mathematische Konzepte und Gann-Theorien für eine präzise Marktanalyse. Es beinhaltet Quadratwerte von 144, 90, 52 und auch das Quadrat von 9. Darüber hinaus integriert es die Methode von  zur Quadratwurzel von 9 und deren Beziehung zu Kanälen und dem Sternmuster. Benutzerhandbuch und Anwendung: Vor der Verwendung diese
AW Trend Predictor MT5
AW Trading Software Limited
4.76 (54)
Die Kombination von Trend- und Aufschlüsselungsebenen in einem System. Ein fortschrittlicher Indikatoralgorithmus filtert Marktrauschen, bestimmt den Trend, Einstiegspunkte sowie mögliche Ausstiegsniveaus. Indikatorsignale werden in einem Statistikmodul aufgezeichnet, das es Ihnen ermöglicht, die am besten geeigneten Tools auszuwählen, die die Wirksamkeit der Signalhistorie zeigen. Der Indikator berechnet Take-Profit- und Stop-Loss-Marken. Handbuch und Anleitung ->   HIER   / MT4-Version ->   H
Werden Sie Breaker Trader und profitieren Sie von Änderungen der Marktstruktur, wenn sich der Preis umkehrt. Der Order Block Breaker Indikator zeigt an, wann sich eine Trend- oder Preisbewegung der Erschöpfung nähert und bereit ist, sich umzukehren. Es weist Sie auf Änderungen in der Marktstruktur hin, die normalerweise auftreten, wenn eine Umkehrung oder ein größerer Rückzug bevorsteht. Der Indikator verwendet eine proprietäre Berechnung, die Ausbrüche und Preisdynamik identifiziert. Jedes
The Volume by Price Indicator for MetaTrader 5 features Volume Profile and Market Profile TPO (Time Price Opportunity). Get valuable insights out of currencies, equities and commodities data. Gain an edge trading financial markets. Volume and TPO histogram bar and line charts. Volume Footprint charts. TPO letter and block marker charts including split structures. Versatile segmentation and compositing methods. Static, dynamic and flexible ranges with relative and/or absolute visualizations. Lay
Wir stellen vor       Quantum Breakout PRO   , der bahnbrechende MQL5-Indikator, der die Art und Weise, wie Sie mit Breakout-Zonen handeln, verändert! Entwickelt von einem Team erfahrener Händler mit über 13 Jahren Handelserfahrung,       Quantum Breakout PRO       ist darauf ausgelegt, Ihre Handelsreise mit seiner innovativen und dynamischen Breakout-Zone-Strategie auf ein neues Niveau zu heben. Der Quantum Breakout Indicator zeigt Ihnen Signalpfeile auf Breakout-Zonen mit 5 Gewinnzielzone
TrendLine PRO MT5
Evgenii Aksenov
4.78 (49)
The Trend Line PRO indicator is an independent trading strategy. It shows the trend change, the entry point to the transaction, as well as automatically calculates three levels of Take Profit and Stop Loss protection Trend Line PRO is perfect for all Meta Trader symbols: currencies, metals, cryptocurrencies, stocks and indices Advantages of Trend Line PRO Never redraws its signals The possibility of using it as an independent strategy It has three automatic levels Take Profit and Stop Loss lev
Owl Smart Levels MT5
Sergey Ermolov
4.47 (36)
MT4-Version  |  FAQ Der Owl Smart Levels Indikator ist ein komplettes Handelssystem innerhalb eines Indikators, der so beliebte Marktanalysetools wie die fortschrittlichen Fraktale von Bill Williams , Valable ZigZag, das die richtige Wellenstruktur des Marktes aufbaut, und Fibonacci-Levels , die die genauen Einstiegslevels markieren, enthält in den Markt und Orte, um Gewinne mitzunehmen. Detaillierte Strategiebeschreibung Anleitung zur Verwendung des Indikators Berater-Assistent im Handel Owl H
Gartley Hunter Multi
Siarhei Vashchylka
5 (5)
Gartley Hunter Multi - An indicator for searching for harmonic patterns simultaneously on dozens of trading instruments and on all classic timeframes: (m1, m5, m15, m30, H1, H4, D1, Wk, Mn). Manual (Be sure to read before purchasing) | Version for MT4 Advantages 1. Patterns: Gartley, Butterfly, Shark, Crab. Bat, Alternate Bat, Deep Crab, Cypher 2. Simultaneous search for patterns on dozens of trading instruments and on all classic timeframes 3. Search for patterns of all possible sizes. Fr
Trend Line Map Pro MT5
STE S.S.COMPANY
4.67 (9)
Trend Line Map Indicator ist ein Add-On für Trend Screener Indicator. Es arbeitet als Scanner für alle Signale, die vom Trendscreener (Trendliniensignale) erzeugt werden. Es ist ein Trend Line Scanner basierend auf dem Trend Screener Indicator. Wenn Sie keinen Trend Screener Pro Indicator haben, funktioniert die Trend Line Map Pro nicht. It's a Trend Line Scanner based on Trend Screener Indicator. If you don't have Trend Screener Pro Indicator,     the Trend Line Map Pro will not work .
TrendDecoder Premium MT5
Christophe, Pa Trouillas
5 (1)
Top bewertet auf anderem MarketPlace -  Jetzt verfügbar auf METATRADER Identifizieren Sie Bereiche und die nächsten wahrscheinlichen Bewegungen     |    Erhalten Sie früheste Signale und die Stärke von Trends     |    Klare Ausstiegssignale vor Umkehrung     |    Erkennen Sie die Fibo-Levels, die der Kurs testen wird    |  Indikator, der nicht zurückverfolgt, nicht verzögert - ideal für den manuellen und automatisierten Trading - geeignet für alle Vermögenswerte und Zeiteinheiten - 50% Rabatt  
MetaBands M5
Vahidreza Heidar Gholami
4.67 (3)
MetaBands verwendet leistungsstarke und einzigartige Algorithmen, um Kanäle zu zeichnen und Trends zu erkennen, sodass es Tradern potenzielle Punkte für den Einstieg und Ausstieg aus Trades bieten kann. Es ist ein Kanalindikator sowie ein leistungsstarker Trendindikator. Es umfasst verschiedene Arten von Kanälen, die einfach durch Verwendung der Eingabeparameter zusammengeführt werden können. MetaBands verwendet alle Arten von Warnmeldungen, um Benutzer über Marktereignisse zu informieren. Funkt
TPSpro TRENDPRO  - is a trend indicator that automatically analyzes the market and provides information about the trend and each of its changes, as well as giving signals for entering trades without redrawing! The indicator uses each candle, analyzing them separately. referring to different impulses - up or down impulse. Exact entry points into transactions for currencies, crypto, metals, stocks, indices!  -  Version MT4                  DETAILED DESCRIPTION        /       TRADING SETUPS       
Was: $249  Now: $99   Market Profile defines a number of day types that can help the trader to determine market behaviour. A key feature is the Value Area, representing the range of price action where 70% of trading took place. Understanding the Value Area can give traders valuable insight into market direction and establish the higher odds trade. It is an excellent addition to any system you may be using. Inspired by Jim Dalton’s book “Mind Over Markets”, this indicator is designed to suit the
Zeichnen Sie automatisch Unterstützungs- und Widerstandsniveaus PLUS Antriebskerzenlücken auf Ihrem Chart ein, so dass Sie sehen können, wohin sich der Preis wahrscheinlich als Nächstes bewegen und/oder möglicherweise umkehren wird. Dieser Indikator wurde entwickelt, um als Teil der Positionshandelsmethodik verwendet zu werden, die auf meiner Website (The Market Structure Trader) gelehrt wird, und zeigt Schlüsselinformationen für die Zielsetzung und potenzielle Einstiege an. MT4 Version:  htt
Golden Spikes Detector
Batsirayi L Marango
5 (1)
Golden Spikes Detector This indicator is based on an advanced strategy primarily for trading spikes on Boom and Crash Indices. Complex algorithms were implemented to detect high probability entries only. It alerts on potential Buy and Sell entries. To trade spikes on the Deriv or Binary broker, only take Buy Boom and Sell Cash alerts. It was optimised to be loaded on 5-minute timeframe although multiple timeframe analysis is done in the background. Features ·             Desktop pop up and sound
Weitere Produkte dieses Autors
Funktionen Indikator für Fibonacci-Retracement-Handel Ein Fibonacci-Diagramm wird basierend auf der vorherigen ausgewählten Kerze von 1H, 4H, 1D und 1W gezeichnet. Wenn der Marktpreis das Fibonacci-Niveau berührt, ändert sich die Farbe und die Berührungszeit wird angezeigt. Das Fibonacci-Diagramm wird bei den Niveaus -23.6, 0, 23.6, 38.2, 50, 61.8, 76.4, 100 und 123.6 gezeichnet und das Diagramm wird aktualisiert, wenn die Kerze aktualisiert wird. Variablen Zeitrahmen: Ein Fibonacci-Diag
FREE
Merkmal Weniger Einrichtungsaufwand und vollautomatischer Handel mit Variablenmanipulation Handel mit Durchbruchsstrategie und Trailing Forschung mit echten Tick-Daten von 2017 bis 2023 Gewinnrate von 91,5 % und maximaler Drawdown von 29 % Funktioniert nur mit dem Währungspaar EURUSD, im 1-Stunden-Zeitrahmen und erfordert ein ECN-Konto ohne Spread Anforderungen Handelswährung nur EURUSD Zeitrahmen nur 1 Stunde Anfangseinlage mehr als 1000 USD Hebel weniger als 1:500 Konto ECN-Konto ohne Sprea
Auswahl:
xlxAxlx
712
xlxAxlx 2024.01.31 17:53 
 

Thank you...

ceseixas
66
ceseixas 2023.10.19 03:31 
 

Olá. Parece bem interessante o indicador. Mas não consigo fazê-lo aparecer na versão demo. Tentei no Mini dólar (WDO) e Mini índice (WIN) no gráfico de 5 minutos. Mas nem abre a tela de configuração. Tem alguma idéia ?

Kim Yonghwa
6461
Antwort vom Entwickler Kim Yonghwa 2023.10.22 11:09
Obrigado pelo seu feedback. No entanto, é difícil implementar partes que não fornecem dados além das principais moedas ou têm formatos de dados únicos. Agradeço muito pela sua classificação.
Antwort auf eine Rezension
Version 1.3 2023.09.02
chart shift in default
Version 1.2 2023.08.26
variable adjust
Version 1.1 2023.08.22
variable change