• Übersicht
  • Bewertungen
  • Diskussion

AI Binary Sniper

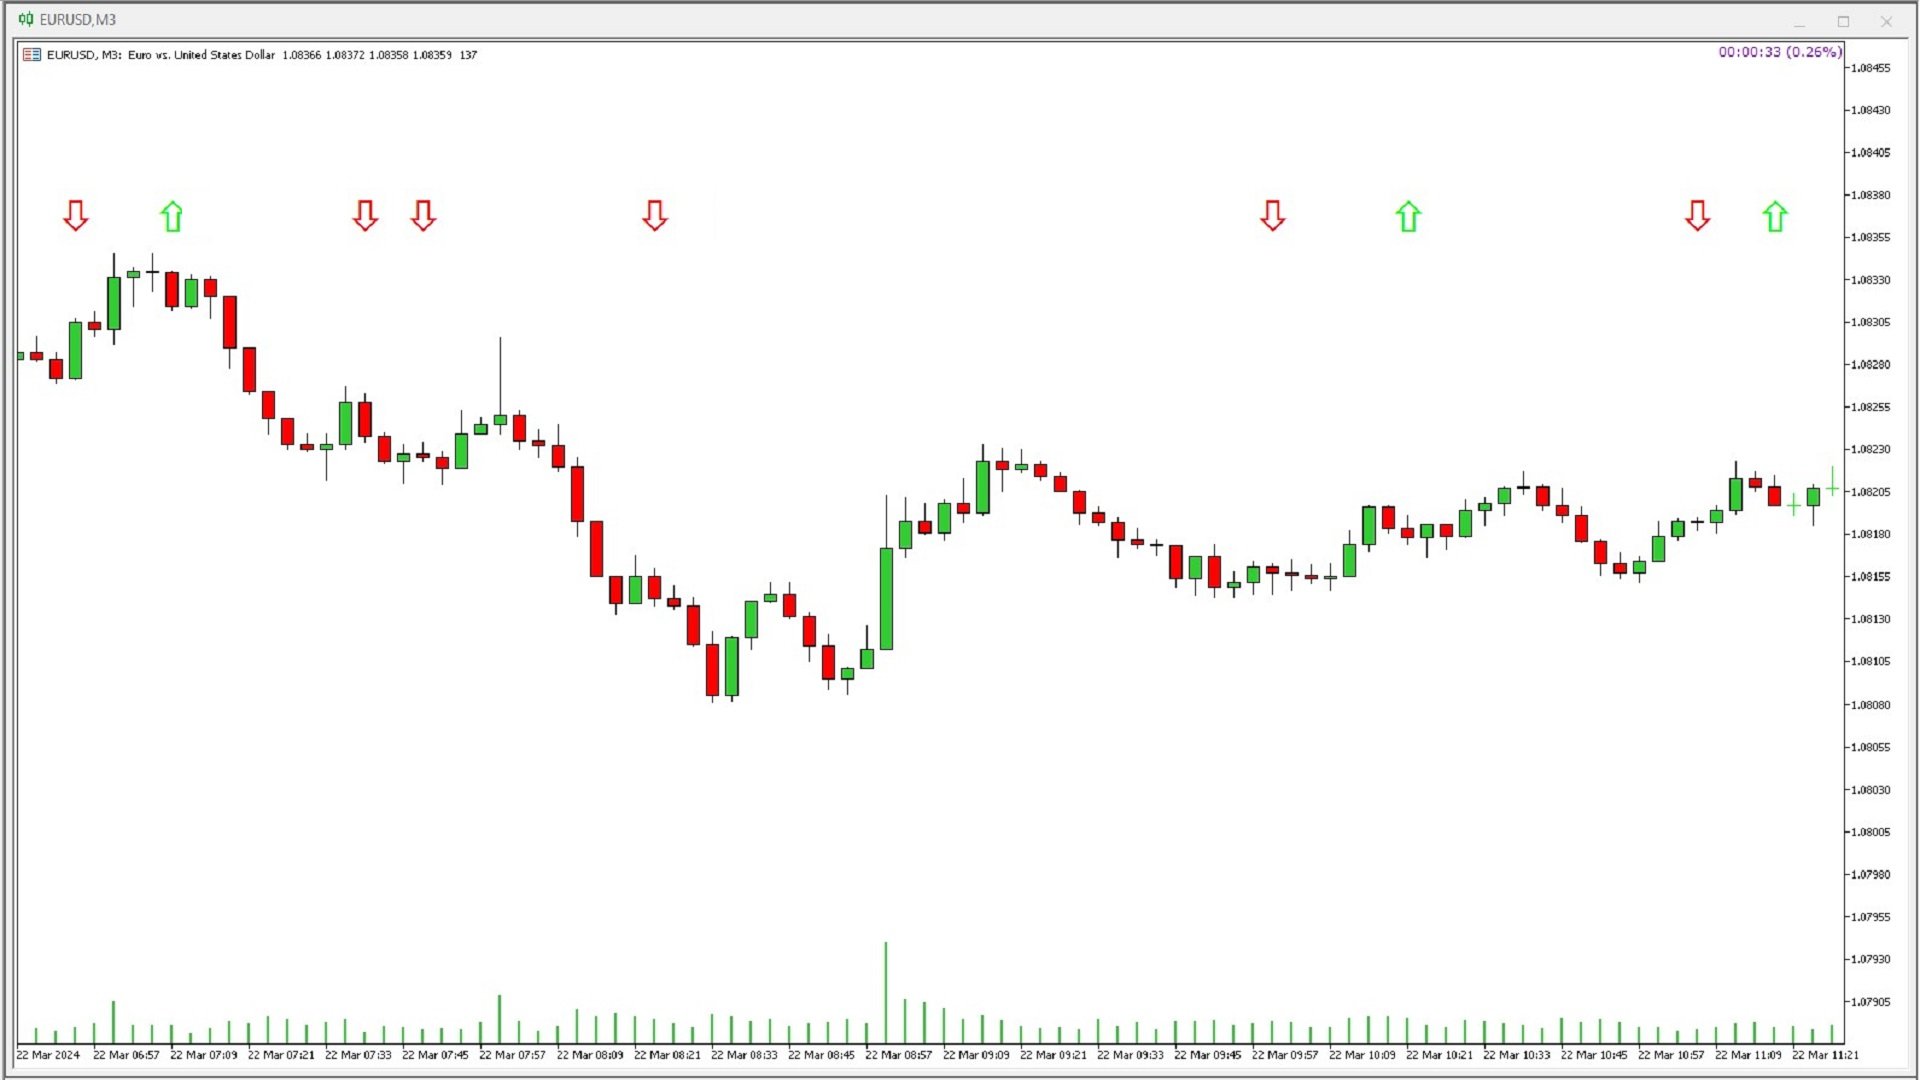
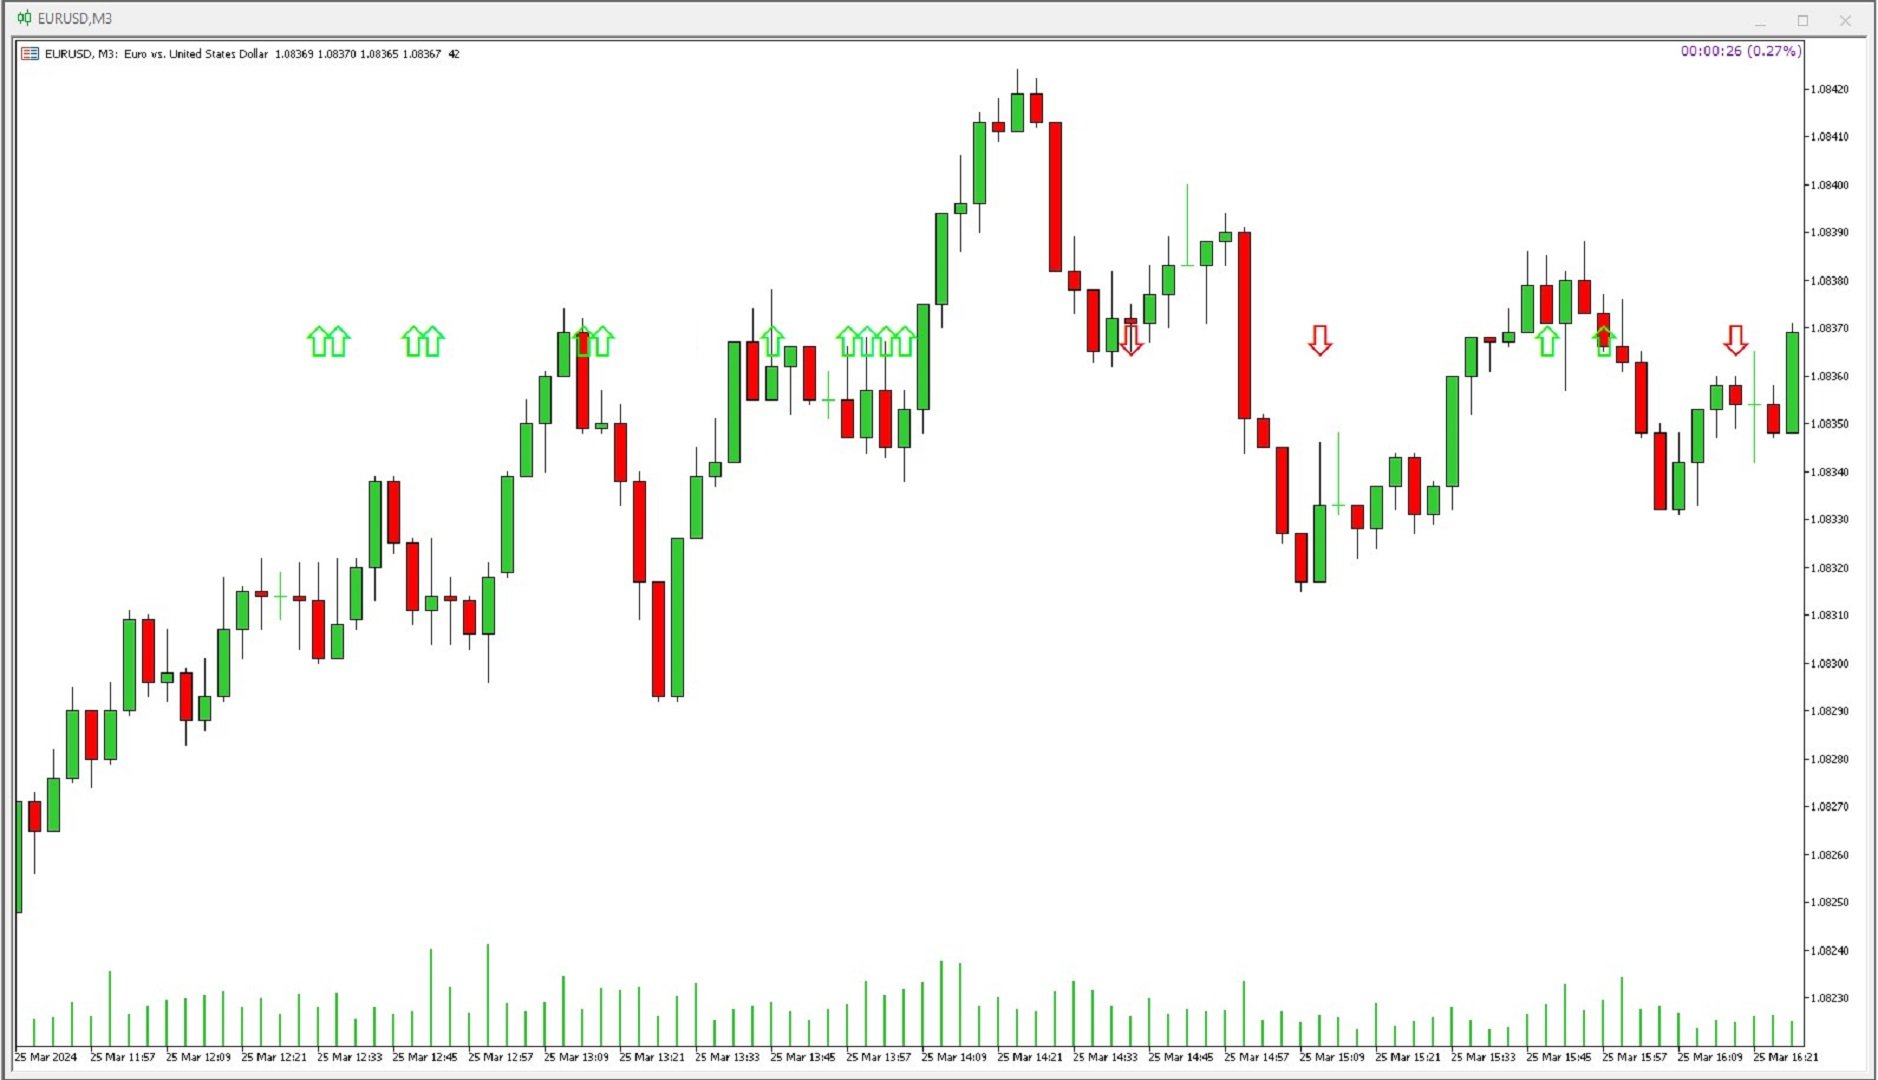
INDIKATOR basierend auf KÜNSTLICHER INTELLIGENZ, der mögliche Call- und Put-Eingaben für binäre Optionen generiert.

Der Indikator funktioniert nach drei verschiedenen Strategien:

1) Durch das Ablesen der Volumina wird ein Signal gesendet, wann sich der Preis umkehren sollte

2) Durch die Divergenz zwischen Preis und Volumen sendet es ein Signal, wann sich der Trend fortsetzen oder umkehren sollte

3) Durch die Konvergenz zwischen Preis und Volumen sendet es ein Signal, wann sich der Trend fortsetzen sollte.


Der Indikator funktioniert in allen Zeitrahmen, die besten Ergebnisse werden jedoch bei Fristen von 3 Minuten oder 5 Minuten erzielt (da institutionelle Aggression in kurzen Zeitrahmen zu beobachten ist).

Die beste Zeit ist die mit größerer Liquidität, d. h. von 7 GMT bis 18 GMT.


Obwohl der Indikator mehr als 70 % der korrekten Signale generiert, kann es vorkommen, dass Sie in einen Kampf zwischen Institutionen geraten, die den Preis manipulieren oder sich gegenseitig ablehnen, und so eine Reihe falscher Signale erzeugen. Daher empfehlen wir die Verwendung eines angemessenen Geldmanagements (Beispiel Masaniello). )
Empfohlene Produkte
KT Candlestick Patterns Scanner is a Multi-Symbol and Multi-Timeframe scanner that fetches and shows various candlestick patterns on 28 currency pairs and 9 time-frames concurrently . The scanner finds the candlestick patterns by loading the KT Candlestick Patterns indicator as a resource in the background. Features The scanner can find the candlestick patterns on 252* combinations of symbols and time-frames from a single chart. Open the signal's chart loaded with a predefined template with
Dieser auf künstlicher Intelligenz basierende Indikator identifiziert mögliche Marktumkehrpunkte durch Auslesen des Fußabdrucks und signalisiert im Voraus kleine Marktbewegungen, bevor sie auftreten. Im Gegensatz zu Preis- und Volumenindikatoren, die „späte“ Einträge generieren, d. h. wenn bei einer Richtungsänderung bereits eine Bestätigung des Preises oder Volumens erfolgt ist und die Bewegung daher oft bereits beendet ist, signalisiert dieser Indikator basierend auf dem, was er in der Tabell
My PVSR
Ashok Kumar Singha
My PVSR   is based on All Type of Pivot Points. Use this Indicator to get proper Support / Resistance Zone and Trade accordingly.. Recommendation: Use this Indicator along with my another Indicator --->>> Dr. Trend   <<<--- Click Here ; To get the best output result feel free to contact me ; Best of Luck It can be used for: All Pairs: Forex, Cryptocurrencies, Metals, Stocks, Indices etc. All Timeframe All Brokers All type of Trading Style like Scalping, Swing, Intraday, Short-Term, Lon
TREND HARMONY MT5 – Multi Timeframe Trend and Phase and Pullback Level Visualizer indicator for Metatrader5 The TREND HARMONY indicator automates deep trend analysis and generates visualizations for you. Take control of your trades by eliminating uncertainty! Revolutionize your trading experience with precision and insight through the TREND HARMONY Multi Timeframe indicator – your ultimate MT5 trend visualization indicator. [  Features and Manual   | MT4 version |   All Products   ] Are you t
Market Markers EA
Tshepo Michael Motaung
This EA is sessions trading robot that allows you to trade the trading session of yours choice as it waits for market markers to make decision for the direction of the day before taking any trades. It has 3 entry signals that uses candle stick patterns, Moving Averages and Range Break to maximize profits and to take advantage of the trending market. The EA practices risk management and has the ability to grow account by risking certain percentage of your account(risk percentage) each time there
Introduction to Fractal Pattern Scanner Fractal Indicator refers to the technical indicator that makes use of the fractal geometry found in the financial market. Fractal Pattern Scanner is the advanced Fractal Indicator that brings the latest trading technology after the extensive research and development work in the fractal geometry in the financial market. The most important feature in Fractal Pattern Scanner is the ability to measure the turning point probability as well as the trend probabil
The indicator scans for TD Combo signals in multiple timeframes for the all markets filtered and shows the results on Dashboard. Key Features Dashboard can be used for all markets It can scan for signals on MN1, W1, D1, H4, H1, M30, M15 ,M5, M1 timeframes Parameters UseMarketWatch: Set true to copy all symbols available in market watch MarketWatchCount : Set the number of symbols that you want to copy from the market watch list. CustomSymbols: Enter the custom symbols that you want to be availa
It's a multi-symbol and multi-timeframe scanner for our indicator - ACB Breakout Arrows . With default settings, it scans for the buy/sell signals on 28 currency pairs and 9 time-frames concurrently.   Features It can scan 252* combinations of symbols and time-frames from a single chart. Open the signal's chart loaded with a predefined template with a single click.  Easy drag n drop anywhere on the chart. Real-time alerts with popup, sound, push-notifications and email alerts.  Input Para
The Plasma Trend indicator is a simple technical indication that is used to determine the current trend direction in the market. The Plasma Trend indicator is a powerful tool for determining the direction of the trend in the Forex market. It is based on both standard technical indicators and proprietary mathematical calculations, which provides a more accurate and reliable trend determination. Its implementation in the form of lines of two colors simplifies the visual determination of a change
Dear traders and investors, Introducing   Vikopo Fractal MT5 , Developed by a team of experienced traders with trading experience of over 15 years. MT4 Version : https://www.mql5.com/en/market/product/114993 products List : https://www.mql5.com/en/users/vikopoadvise/seller Strategy Introduction : When utilizing this robot, we have harnessed the power of cutting-edge neural plugins to enhance its capabilities. By integrating these neural plugins, our trading robot is equipped with
EYeQ Indicator ist ein leistungsstarkes Tool, um Einstiegssignale für STEP INDEX, VOLATILITY 10, 25,50,75 100, BOOM und CRUSH anzubieten. Es ist effektiver zum Fangen von SPIKES auf BOOM und CRUSH 300, 500 und 1000. Der EYeQ-Indikator analysiert Märkte über mehrere Zeiträume hinweg und findet basierend auf Trends die am besten geeigneten Einstiegspunkte. Sie müssen nur die Desktop-Benachrichtigungen einschalten, damit Sie benachrichtigt werden können, wenn Signale freigegeben werden. Erlaub
Rapid X
Tatiana Savkevych
Rapid strategy for working in the Forex market with a scalping base. The algorithm involves carrying out a trading operation in the shortest possible time. As a rule, this period of time is seconds and is only sometimes limited to several minutes. There is an opinion that scalping is for beginners. But in fact, it is wrong. In order to carry out a trading operation correctly and profitably, a trader needs to learn scalping, otherwise the result may be negative. This is why using a bot is mo
RubdFx Perfect Reversal , The reversal indicator is used to determine areas of support and resistance by Drawing an arrow with a level of supply and demand ( ReversalZones ). - You will catch more swings by reducing the period, and less swings if you increase period - Mobile, computer and email alerts available . it is not pushed by price which means the arrow will stay in one place,suitable for scalping and long term trading  Also Compatible with all forex paris , BUY RULES;  open a buy positio
Skiey
Vitalii Zakharuk
Skiey - Indicator of easy solutions! Using this indicator is very simple, since the simplest is to look at the chart and act according to the color arrows. Such a calculation option takes into account intraday price fluctuations and focuses on measuring the "candlestick" share in the trend. The algorithm takes into account the measurement of prices, this method also emphasizes the measurement of each of the price drops (H / C, H / O, LC, LO) - which gives more detailed information but also mo
Der Indikator hilft, gleichzeitig nach einer gewissen Korrektur in einen Trade einzutreten, der dem Trend folgt. Es findet starke Trendbewegungen eines Währungspaares auf einer bestimmten Anzahl von Balken und findet auch Korrekturniveaus für diesen Trend. Wenn der Trend stark genug ist und die Korrektur der in den Parametern angegebenen entspricht, signalisiert der Indikator dies. Sie können unterschiedliche Korrekturwerte einstellen, besser geeignet sind die Werte von 38, 50 und 62 (Fibonacci
PROMOTIONAL OFFER - RENT FOR 6 MONTHS $160.00 ( Promotional period ends 30th June 2024) *Price of Volume Clarity Pro will increase thereafter "If you know the Way broadly you will see it in everything" Miyamoto Musashi Precision Trading: Introducing Our MT5 Indicators for Optimal Market Insights We have set a premium price for our MT5 indicators, reflecting over two years of development, rigorous backtesting, and diligent bug fixing to ensure optimal functionality. Our confidence in the precisi
The indicator determines a special pattern of Joe Dinapoli. It gives very high probability buy and sell signals. Indicator does not repaint. Indicator Usage Buy Signal ''B'' Entry : Market buy order at signal bar close Stop : Low of signal bar Take Profit : First swing high Sell Signal ''S'' Entry : Market sell order at signal bar close Stop : High of signal bar Take Profit : First swing low Indicator Parameters Fast EMA : External Parameter (should be kept as default) Slow EMA: External Param
Savia Forex Pro Indicator MT5
Savia Forex Software Solutions
Savia Forex Pro Indicator (MT5) The Savia Forex Solutions Forex Pro Indicator gives you highly accurate entries on all Forex/Currency pairs, Indices and Cryptocurrencies. The Forex Pro Indicator is dynamic and powerful and is optimized for all timeframes and ALL Currency pairs, Indices, Commodities, and Cryptocurrency pairs. Trade with improved confidence and maximize your success rate. Benefits Dynamic and Powerful. Forex Pro Indicator is fully optimized for all chart timeframes. Forex Pro Indi
The indicator is designed to close positions on the market in time. For example: to take profits ahead of schedule if the price has not reached TakeProfit, and the market is turning around. The indicator analyzes the momentum, not the trend. He does not give any information about the trend. The indicator is well suited for finding divergence. The Ershov 38 Parrots indicator dynamically adjusts to the market and detects price movement impulses of medium and high amplitude. It almost does not rea
Our indicator will help you to make a decision whether to Buy or Sell , including where to set the Take Profit and Stop Loss . The Buy/Sell signal will not redraw nor repaint until new signal occurs. The Take Profit and Stop Loss will change following the market conditions. Our indicator will give alert to your mobile/handphone when new buy/sell signal arrive. For best result, combine this indicator with your knowledge on price action and support & resistance, also don't forget to watch for the
Limitless MT5
Dmitriy Kashevich
Limitless MT5 is a universal indicator suitable for every beginner and experienced trader. works on all currency pairs, cryptocurrencies, raw stocks Limitless MT5 - already configured and does not require additional configuration And now the main thing Why Limitless MT5? 1 complete lack of redrawing 2 two years of testing by the best specialists in trading 3 the accuracy of correct signals exceeds 80% 4 performed well in trading during news releases Trading rules 1 buy signa
USE IT ONLY WITH THE SET FILES I POSTED TO THE COMMENT SECTION.  Youtube video: https://www.youtube.com/watch?v=kQN5LTd91rk&amp ;t=2s This is the biggest update in the life of the Imperium Pattern EA, it got new features and engine. ---It got the official TheNomadTrader Dynamic engine system alongisde with good risk:reward ratio ---New feature that allows traders to tell the EA after how much time(X value in minutes) the EA can close trades by dynamic exit. This feature boosts the EA p
This is a simple arrow system based on Engulfing Candlestick Pattern. It gives you alerts on your smartphone when there is an engulfing candlestick pattern happens. Which type of alerts available? 1. It paints on chart Up/Down Arrows. 2. Popup message and sound alert in trading terminal window. 3. Push notification or Alert on your Android and IOS mobile phones (requires MT4 or MT5 app installed!) *Note: Use it on higher timeframes like H4 (4 hours), D1 (1 Day) then find trade opportunities on s
Contact me for instruction, any questions! Introduction A flag can be used as an entry pattern for the continuation of an established trend. The formation usually occurs after a strong trending move. The pattern usually forms at the midpoint of a full swing and shows the start of moving. Bullish flags can form after an uptrend, bearish flags can form after a downtrend. Flag Pattern Scanner Indicator It is usually difficult for a trader to recognize classic patterns on a chart, as well as sear
Niubility Trend  Niubility Trend  displays the trend direction for all time frames in real time. You'll see at a glance at which direction the trends are running, how long they last and how powerful they are. All this makes it an easy-to-use trend trading system for beginners, advanced and professional traders. Features Easy to trade Customizable colors and sizes It is non-repainting and non-backpainting It is fantastic as a trailing stop method It implements alerts of all kinds
Rejection Block
Usiola Oluwadamilol Olagundoye
The "Rejection Block" MetaTrader 5 Indicator offers traders a comprehensive tool for identifying and visualizing rejection candlestick patterns, commonly known as rejection blocks. These patterns are pivotal in discerning potential market reversals or continuations, making them invaluable for traders seeking to enhance their analysis. Key Features: Rejection Block Detection: The indicator diligently scans price data, pinpointing instances of rejection candlestick patterns. These patterns typical
FREE
SFE Stock Market
Joel Juanpere
1 (1)
This EA trade with CFDs of Stocks. The EA can be used in any stock market, by default, the EA is configured with symbols of the US Stock Market. The minimal balance recommended is 3.000 USD. Backtest and Live Setup: please, look the video or go to the webpage for more information. The default parameters works with ICMarkets.  The names of the symbols can change in each broker, and each broker can have different CFDs. Please, contact me for help with other brokers. ORDER SIZE PARAMETERS Max.
/   ********** **********   ********** **********   ********** **********   ********** **********   ********** **********   / Big Sales for Easter! Price is reduced > 50 % already! Grasp the chance and Enjoy it!  /   ********** **********   ********** **********   ********** **********   ********** **********   ********** **********   / This is a powerful EA that support single order strategy, martingale strategy, multiple timeframes strategy, etc with lots of useful indicators and self define
The Owl
Tatiana Zyrianova
5 (2)
This EA was created by a professional trader and developer of trading robots (more than 700 completed orders). The key advantage of this trading robot is the high risk-reward ratio, which over a period of 11 years averages from 4.2 (at the lowest risk) to 11.8 (at the highest risk) annually. Limited Time Price of only 375 USD !  The cost will increase by 100 USD after every 10 purchases! Final price 3750 USD. About the EA: Trading takes place on 14 currency pairs. Each strategy opens only o
MarketMagnet
Kelly Adediran Raymond
Are you ready to take your trading journey to new heights? Look no further than MarketMagnet, this groundbreaking indicator designed to propel your trading success with excitement and accuracy. Powered by the convergence of Momentum and CCI (Commodity Channel Index), MarketMagnet equips traders with the ultimate tool to determine direction and entry prices for a wide range of recommended currency pairs and instruments. It is designed for traders seeking to scalp for a few pips on lower timeframe
Käufer dieses Produkts erwarben auch
TrendMaestro5
Stefano Frisetti
note: this indicator is for METATRADER4, if you want the version for METATRADER5 this is the link:  https://www.mql5.com/it/market/product/108106 TRENDMAESTRO recognizes a new TREND in the bud, he never makes mistakes. The certainty of identifying a new TREND is priceless. DESCRIPTION TRENDMAESTRO identifies a new TREND in the bud, this indicator examines the volatility, volumes and momentum to identify the moment in which there is an explosion of one or more of these data and therefore the mome
VTrende Pro
Andrii Diachenko
5 (1)
VTrende Pro - MTF indicator for trend trading with a display panel for MT5 *** Videos can be translated into any language using subtitles (video language - Russian) Although the signals of the VTrende Pro indicator can be used as signals of a full-fledged trading system, it is recommended to use them in conjunction with the Bill Williams TS. VTrende Pro is an extended version of the VTrende indicator. Difference between Pro version and VTrende: - Time zones - Signal V - signal 1-2 waves
IVISTscalp5
Vadym Zhukovskyi
5 (3)
Wir stellen Ihnen den iVISTscalp5-Indikator vor, der nicht nur einzigartig, sondern auch effektiv im Handel ist. Dieser Indikator basiert auf Zeitdaten und ist das Ergebnis jahrelanger Erfahrung und eingehender Analyse der Finanzmärkte. Der iVISTscalp5-Indikator ist ein ausgezeichnetes Werkzeug für manuellen Handel. Bequemlichkeit, Einfachheit und Visualisierung - die gesamte Komplexität ist verborgen. Wir haben die Einstellungen und Verwendung des iVISTscalp5-Indikators auf das Maximum vereinfa
Weis Wave with Alert MT5
Trade The Volume Waves Single Member P.C.
4.93 (15)
Rental/Lifetime Package Options and Privileges  * For optimum results the yearly or lifetime package is suggested due to live training ! Rent Monthly Six Months   Yearly/Lifetime Weis Wave with Speed with Alert+Speed Index x x x Manual  x x x Quick Set up Video x x x Blog x x x Lifetime Updates x x x Setup and Training Material x x Free Rectangle Break Alert Tool      x Discord Access Channel "The SI traders" x 2-hour live methodology training x How to trade with it:    http://
RAD CRITICAL LEVES RAD indicator tracks “Relevant Volume” in real time, identifying accumulation and distribution processes, projecting them in the chart as SUPPORT or RESISTANCE zones. Natural   support   and resistance levels are generated by Volume Accumulation and Distribution processes. As these processes evolve, levels at which the relevant volume in the market place is positioned, become difficult areas to cross upwards or downwards. By using this information, traders can identify very s
Big Player Range
Thalles Nascimento De Carvalho
5 (2)
Willkommen beim "BigPlayerRange"-Indikator, einem technischen Analysewerkzeug, das entwickelt wurde, um signifikante Interessensbereiche von Finanzinstituten auf den Märkten zu identifizieren. Dieser Indikator bietet eine präzise Analyse von Preisbereichen, in denen große Marktteilnehmer eine erhebliche Aktivität und Interesse zeigen. Hauptmerkmale: 1. Kartierung der Interessensbereiche von Institutionen: "BigPlayerRange" hebt genau die Bereiche im Chart hervor, in denen Finanzinstitute st
Tatino Super Signals is Non Repaint Indicator for Binary Option trading and Forex trading. Recommendations: Timeframe: All timeframes. For best results we recommend using it on M1, M5 and M15 timeframes. Currency pairs: All Pairs Account type: All Type Broker time: Any Brokers : Alls Binary Trading : Expired 1 Candle Buffer Buy=1, Sell=0, Entry Next Candle Recommended Forex trading stop loss : 15 pips Recommended  Forex tradingTake profit levels : 15 pips Specifications: Does not repaint  
Smooth price for Monarch
Konstantin Gruzdev
5 (1)
The Smooth Price technical indicator is used for plotting a smoothed line as close to the price of the financial instrument as possible, and serves to eliminate its noise components. The indicator is part of the Monarch trading system, but here it is presented as an independent technical analysis tool. The indicator is based on the cluster digital filter , which, unlike the ClusterSMA , is applied directly to the price time series. Smooth Price does not redraw (except the very last, zero bar) an
ZigZag de Suavizador
Cesar Juan Flores Navarro
Teniendo una entrada de precios suavizados, los cuales son procesador por un ZigZag en tiempo real, dando como resultado un suavizador ajustado a un ZigZag. Con valores de entrada (periodo) mayores se vuelve un poco lenta en M1,, Ideal para H1, H4, D1 Trabaja bien con otros suavizadores, ya que su intersección es ideal Al iniciar empiza con mayor precisión desde el momento de activación, siendo el historial (anterior) de referencia ----------------------------------------------------------------
Super Suavizador
Cesar Juan Flores Navarro
Indicador en MQL5 que obtiene el promedio de 10 EMAS que son alineadas y procesadas según Fibonacci luego el promedio es suavizado"  Se ingresa un número de 2 a N que multiplica los EMA-Fibonacci y por consiguiente aumenta los fibonacci, resultando un promedio.   Se ingresa un número que suaviza los EMA-Fibonacci. Considerando los números 1/1 seria la suavización minima. Considerando los números 3/5 seria la suavización media. Considerando los números 10/30 seria la suavización alta.....etc
Entry Pro
Bartlomiej Tadeusz Tomaja
Entry Pro Indicator is a powerful multi-functional trading tool designed to increase your market entry accuracy. It combines the power of several key market trend indicators, including ATR Trailing Stop and both fast and slow EMA, to provide comprehensive market insight. It offers easy-to-interpret market entry signals represented by colored arrows. Also, it's fully customizable, allowing you to adjust ATR and EMA periods to suit your trading strategy. Trend filters and alerts can be toggled on
WanaScalper
Isaac Wanasolo
1 (1)
A scalping indicator based on mathematical patterns, which on average gives signals with relatively small SL, and also occasionally helps to catch big moves in the markets (more information in the video) This indicator has three main types of notifications: The first type warns of a possible/upcoming signal on the next bar The second type indicates the presence of a ready signal to enter the market/open a position The third type is for SL and TP levels - you will be notified every time price r
Классификатор силы тренда. Показания на истории не меняет. Изменяется классификация только незакрытого бара. По идее подобен полной системе ASCTrend, сигнальный модуль которой, точнее его аппроксимация в несколько "урезанном" виде, есть в свободном доступе, а также в терминале как сигнальный индикатор SilverTrend . Точной копией системы ASCTrend не является. Работает на всех инструментах и всех временных диапазонах. Индикатор использует несколько некоррелируемых между собой алгоритмов для класси
Premium-Level ist ein einzigartiger Indikator mit mehr als 80% Genauigkeit der richtigen Vorhersagen! Dieser Indikator wurde von den besten Trading-Spezialisten seit mehr als zwei Monaten getestet! Den Indikator des Autors finden Sie nirgendwo anders! Anhand der Screenshots können Sie sich von der Genauigkeit dieses Tools überzeugen! 1 ist ideal für den Handel mit binären Optionen mit einer Ablaufzeit von 1 Kerze. 2 funktioniert bei allen Währungspaaren, Aktien, Rohstoffen, Kryptowähr
Pendiente de Precio
Cesar Juan Flores Navarro
Indicador en base a la pendiente de la linea de precio, dibuja una línea de color cuando sube a base de los precios que previamente has sido procesados o linealizados, y cuando baja la pendiente la linea linealizada toma otro color. En este caso se a considerado 6 lineas de diferentes procesos desde pendientes largas hacia las cortas, observándose que cuando coincidan las pendientes se produce un máximo o mínimo, lo que a simple vista nos permitirá hacer una COMPRA O VENTA.
Индикатор Coefficient Of Determination (COD) представляет собой значение коэффициента детерминации или квадрат коэффициента корреляции между зависимой переменной — ценой и объясняющей переменной — тиковым объемом. Что это дает нам на практике? COD отлично распознает кульминацию трендовых движений, что позволяет подбирать оптимальные точки и ловить развороты рынка. Как использовать индикатор: Наиболее популярная торговая стратегия строится совместно с трендовым индикатором Moving Average (MA), пе
Fibonacci Multiple 12
Cesar Juan Flores Navarro
Fibonacci Múltiple 12, utiliza la serie fibonacci plasmado en el indicador fibonacci, aumentadolo 12 veces según su secuencia. El indicador fibonacci normalmente muestra una vez, el presente indicador se mostrara 12 veces empezando el numero que le indique siguiendo la secuencia. Se puede utilizar para ver la tendencia en periodos cortos y largos, de minutos a meses, solo aumentado el numero MULTIPLICA.
Recommended TimeFrame >= H1. 100% Non Repainted at any moment.  Use it carefully, only with Trend Direction. Trading Usage: 2 Variants: as Range System or as BreakOut System (Both Only With Trend Direction)::: (Always use StopLoss for minimise Risk); [1] as Range System: (Recommended) in UP TREND:  - BUY in Blue Line , then if price goes down by 50 points (on H1) open Second BUY.   Close in any Profit you wish: TrailingStop(45 points) or Close when Price touches upper Gold Line. in DOWN TR
En base a cálculos matemáticos de determino una linea Horizontal que cruza a todas las señales de trading, mostrando los máximos y mínimos. La linea horizontal parte en dos las subidas y bajadas de las señales de trading, de tan manera que es fácil identificar los máximos y mínimos, y es inteligente por que es sensible a las subidas y bajadas, afín de no quedarse en un solo lado por siempre, trabaja excelentemente con otros indicadores suavizadores ya que les garantiza que en un intervalo de tie
Spike Detector
Tete Adate Adjete
dieser Indikator ist ein Spike-Detektor-Indikator, es wurde speziell für den Handel mit Boom 1000, Boom 500, Crash 1000 und Crash 500 entwickelt Wir empfehlen, es nur für Derivat Boom- und Crash-Indizes zu verwenden Die Einstellung ist intuitiv, vertraut und einfach zu bedienen es hat Benachrichtigungsfunktionen; akustische Benachrichtigungen und Push-Benachrichtigungen. Dieses Tool ist einfach zu bedienen, einfach zu handhaben Dieses Update basiert auf verschiedenen Strategien für
Escalera Inteligente
Cesar Juan Flores Navarro
Indicador en MQL5, recibe la información del precio SUAVIZADO, lo procesa anulando los picos inteligentemente, y el resultado lo envía al desarrollo de la escalera que iniciara y subirá o bajara según el peldaño o INTERVALO ingresado Ingreso PERIODO = 50 (variar segun uso) Ingreso MULTIPLICA AL PERIODO = 1 (variar segun uso) Segun la configuración la escalera puede pegarse o separarse de los precios,, Se aplica toda la linea de tiempo, y a todas las divisas, etc.  
Fibonacci Suavizado
Cesar Juan Flores Navarro
Indicador en MQL5, que obtiene el promedio de 10 EMAS, que son alineadas según Fibonacci, obteniendo un promedio, que sera suavizado.  Se puede ingresar un numero desde 2 a N, que multiplica a los EMA-Fibonacci. Funciona en cualquier criptomoneda, etc. etc... pudiendo calcular el futuro segun la tendencia de las EMAS. Funciona excelentemente en tramos largos, determinando exactamente el mejor inicio/salida. El precio inicial por apertura sera por un periodo de tiempo, luego aumentará.
Seconds Charts
Aleksandr Goryachev
Micro  ******************* Секундные графики MT5 ********************** Более точного инструмента для входа в сделку вы не найдёте. Входные параметры: Timeframe, sek - период построения графика, секунды Displayed bars - отображаемые бары Step of price levels, pp, 0-off - шаг отрисовки ценовых уровней, пункты Scale points per bar, 0-off - масштаб в пунктах на бар Show lines - отображение текущих уровней Show comment - отображение комментария Standard color scheme - стандартная цветовая сх
QuantXSTocks Trading Range Indicator for MT5: INSTRUCTIONS TO USE OUR INDICATOR:- User needs to take trade on Arrow or after an Arrow CandleStick, You can achieve up-to 35-125 pips target by this Indicator. Best Timeframes for Stocks and Indices are M30 and H1: AMAZON M30 (50 pips) TESLA M30 (50 pips) APPLE M30 (50 pips) ADOBE M30 (50 pips) NASDAQ100 H1 (125 pips) The above are the approximate amount of pips you can achieve by this Indicator, Green arrow appears to be buy arrow while the Red a
Trend and Signals MT5  indicator scans  30 trading Instruments (Forex, Metals and Indices).     It uses special algorithm on the  current market   based on   Pure Price Action   and display the overall trend and signal on the dashboard. When signals are produced the indicator sends alert and notification. Strategy for Signals This indicator uses the daily timeframe to determine the direction of the trend. The hourly timeframe is used to identify possible entries. Main trend and is determined by
Cycles Forecast
Pooriya Alirezaee
This indicator is based on a mathematical formula and an ANN combined, designed to make a model(using previous prices) of the most recent market condition (any chart*) in order to use the model as a forecasting tool. *This indicator can operate on any chart/timeframe, but it's suggested you use multiple timeframes for each trade because this method relies solely on the time factor, you can not use this indicator to predict price volatility, but if it's fit correctly it will show you when the nex
Robos
Namu Makwembo
Big promotion on the Robos, Get yours now Robos Indicator The   ROBOS   indicator is a multi timeframe oscillator that targets the   overbought   and   oversold  regions of a price chart, a signal is indicated by the two lines crossing, compatible with all tradable instruments Latest Release The latest release is the version 4.0 #What's new in version 4.0 ? Features Extreme oversold and overbought levels ROBOS version  4.0  comes with cool new feature , the ability to target on
This indicator is based on the crossing of two Moving Average with the RSI It is intended for scalpers Specially designed for Boom and Crash syhtetic indices from Binary.com/Deriv.com It is easy to use and intuitive. We recommend its use on M1 and is equipped with three types of notification Email alert Sound notification Push notification these parameters can be activated and deactivated.
Regression Channel Tools" basiert. Durch die Nutzung dieses Tools können Trader eine außergewöhnliche Kontrolle über ihren Chart-Regression-Kanal erlangen und fundiertere Handelsentscheidungen treffen. Das Regression Channel Tool ist ein leistungsstarkes Instrument im Werkzeugkasten eines Traders. Es soll wertvolle Einblicke in Preisentwicklungen und potenzielle Unterstützungs- und Widerstandsniveaus bieten. Das Tool eignet sich besonders gut zur Visualisierung von Korrekturwellen innerhalb eine
Use with JUMP 25. However it can can with the volatility indices as well because it is a modified version. It is advisable to use create a healthy account management. Measure your risk and happy trading. Other experts to be loaded soon. These are modified in order to optimise profits. Ideal candidates are high risk, high returns individuals who hold trades at a maximum of 1 - 2 hours
Weitere Produkte dieses Autors
VOLUMENDELTA Volscalping Dieser Indikator zeichnet für jede Preiskerze eine Delta-Kerze, die die Differenz zwischen den gekauften und verkauften Kontrakten darstellt. Die Kerze ist rot und negativ, wenn die im Bid gehandelten (verkauften) Kontrakte die im Ask gehandelten übersteigen, im Gegensatz dazu ist die Kerze grün und positiv, wenn die im ASK gehandelten (gekauften) Kontrakte die im Bid übersteigen. ACHTUNG: Der Indikator funktioniert nur mit Brokern, die einen echten Marktdatenfluss l
Dieser Indikator erkennt die Differenz zwischen den in Bid und Ask (Aggression) getroffenen Kontrakten für jede einzelne Kerze. Der Indikator zeigt in dem dafür vorgesehenen Fenster unter dem Preischart Kerzen an, die genau durch die Differenz zwischen den verkauften und gekauften Kontrakten gegeben sind und die volumetrische Stärke des Marktes erzeugen. Es ist möglich (siehe Screenshots), nur das kumulative Candlestick-Delta-Diagramm oder sogar eine Trendlinie der Kerzen selbst auszuwählen
Dieser Indikator zeigt die Stärke des realen Volumens gegenüber dem Preis. Wenn das Preisdiagramm und der Volumentrend den gleichen Trend haben, bedeutet dies, dass alles normal ist. weicht der Indikator vom Preisdiagramm ab, bedeutet dies, dass die Umkehr nahe ist. Wenn der Preis steigt und das „Volumenkonvergenz“-Diagramm fällt, bedeutet dies, dass Geld den Markt verlässt, die Verkäufer steigen und der Preis bald zu sinken beginnt. umgekehrt, wenn die „Volumenkonvergenz“-Kurve nach oben geht,
Der Indikator generiert Einstiegssignale für BINÄRE OPTIONEN, zeichnet einen Pfeil auf dem Chart und gibt einen akustischen Alarm aus. BETRIEBSZEITEN: 6.OO GMT/ 17.00 GMT (nicht empfohlen nach 17.00 GMT und in der Nacht wegen zu geringer Volatilität und fehlendem Volumen) PAARE: EUR/USD (@EU6), GBP/USD (BP6). Zeitrahmen: 1,2,3,5,10,15 Minuten Bester Zeitrahmen: 3 Minuten VERFALL: 1 Kerze Der Indikator benötigt reale Volumina (keine Tick-Volumina), um zu funktionieren: Er funktioniert
Dieser auf künstlicher Intelligenz basierende Indikator identifiziert mögliche Marktumkehrpunkte durch Auslesen des Fußabdrucks und signalisiert im Voraus kleine Marktbewegungen, bevor sie auftreten. Im Gegensatz zu Preis- und Volumenindikatoren, die „späte“ Einträge generieren, d. h. wenn bei einer Richtungsänderung bereits eine Bestätigung des Preises oder Volumens erfolgt ist und die Bewegung daher oft bereits beendet ist, signalisiert dieser Indikator basierend auf dem, was er in der Tabell
Auswahl:
Keine Bewertungen
Antwort auf eine Rezension