Wie man einen Handelsroboter schnell bestellen kann
Lesen Sie bitte zuerst die Regeln durch
Wie man einen Handelsroboter in MQL5 und MQL4 in Auftrag gibt
Hier ist das Muster einer Anforderungsspezifikation, um einen Roboter zu bestellen
Neuer Aufträge in dieser Kategorie:
30 - 75 USD
30 - 50 USD
Spezifikation
Create information using pine-script
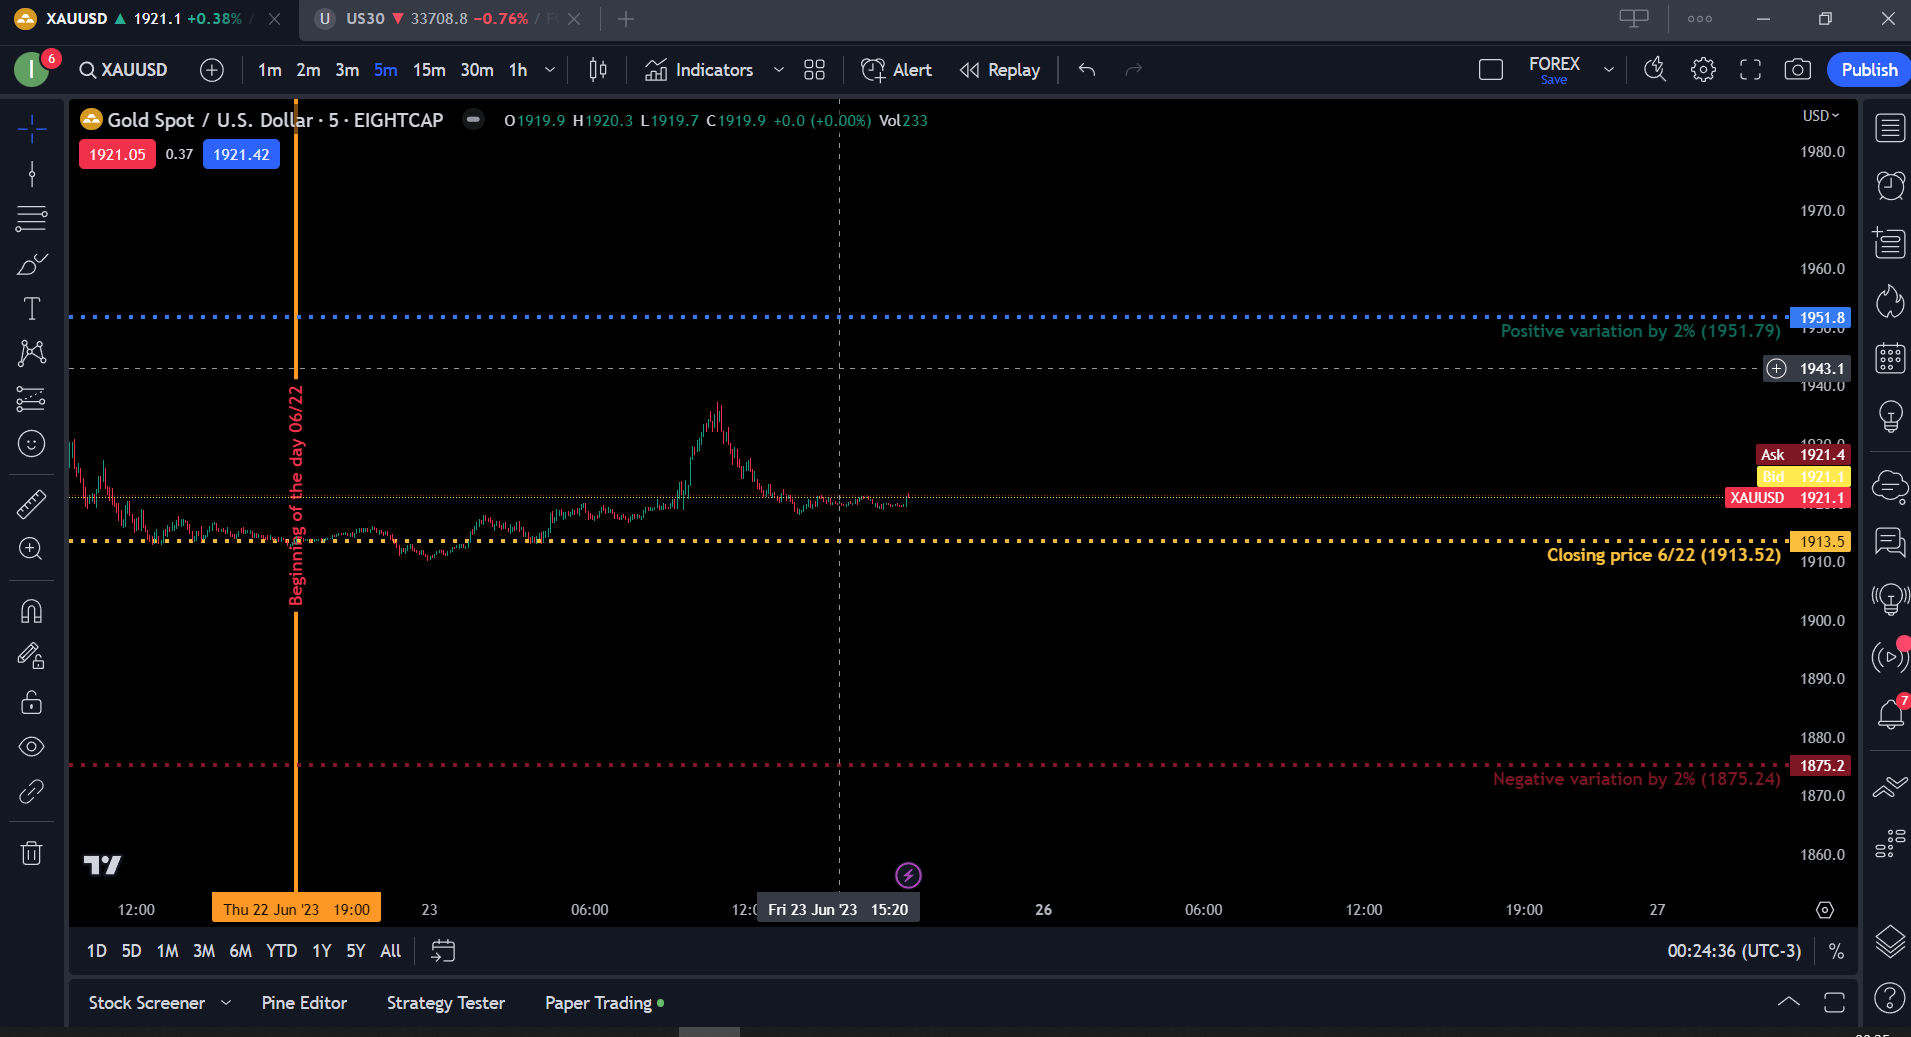
I want to see the possibility of creating a script to mark some important points on the chart referring to the closing price of the previous day.
In the image I have a Horizontal Line, it has the option of Coordinates and option for description, positioning the line at a specific price.
On the Closing price 6/22 line (1913.52) I am adding the previous day's closing price which could be captured directly on the chart. After adding the closing price I need to specify the percentage, example 2%, the script will create two more lines:
Positive variation by 2% (1951.79) (closing value + 1%)
Negative variation by 2% (1875.24) (closing value – 1%)
This is a simple example of my idea:
//@version=5
indicator("Horizontal Line", overlay = true)
float last_day_close = request.security(syminfo.tickerid, "D", close[1])
plot(last_day_close, color=color.orange, linewidth=2, title="Previous Day Close")
hline(price=1913.52,title = "Bottom Line",color = color.red,linestyle = hline.style_dotted,linewidth = 2)
Bewerbungen
1
Bewertung
Projekte
478
40%
Schlichtung
105
40%
/
24%
Frist nicht eingehalten
82
17%
Beschäftigt
Veröffentlicht: 2 Beispiele
2
Bewertung
Projekte
17
59%
Schlichtung
2
0%
/
100%
Frist nicht eingehalten
2
12%
Frei
Projektdetails
Budget
30 - 100 USD