Mira cómo encargar de forma rápida un robot comercial
Lea las reglas antes de empezar el trabajo
Cómo encargar un robot comercial en MQL5 y MQL4
Mire el ejemplo de Tarea Técnica para encargar un robot
Tarea técnica
Create information using pine-script
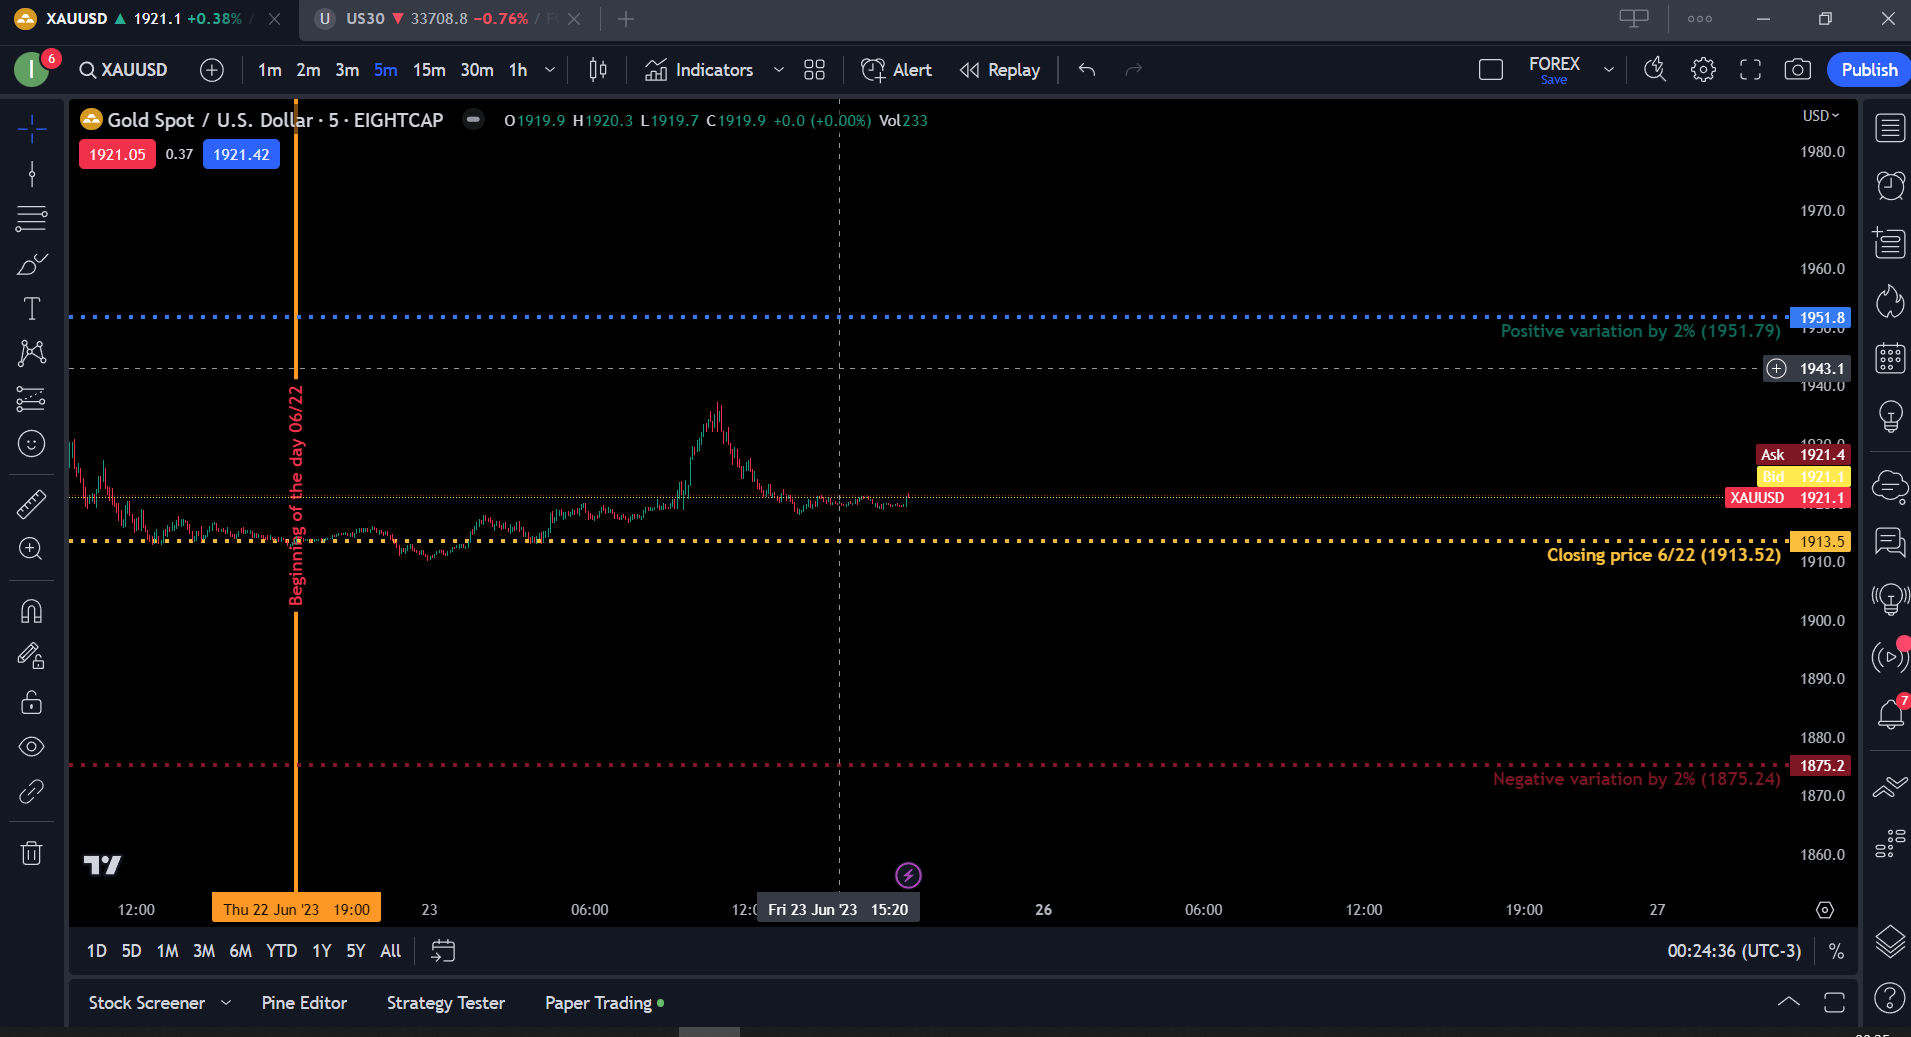
I want to see the possibility of creating a script to mark some important points on the chart referring to the closing price of the previous day.
In the image I have a Horizontal Line, it has the option of Coordinates and option for description, positioning the line at a specific price.
On the Closing price 6/22 line (1913.52) I am adding the previous day's closing price which could be captured directly on the chart. After adding the closing price I need to specify the percentage, example 2%, the script will create two more lines:
Positive variation by 2% (1951.79) (closing value + 1%)
Negative variation by 2% (1875.24) (closing value – 1%)
This is a simple example of my idea:
//@version=5
indicator("Horizontal Line", overlay = true)
float last_day_close = request.security(syminfo.tickerid, "D", close[1])
plot(last_day_close, color=color.orange, linewidth=2, title="Previous Day Close")
hline(price=1913.52,title = "Bottom Line",color = color.red,linestyle = hline.style_dotted,linewidth = 2)
Han respondido
1
Evaluación
Proyectos
478
40%
Arbitraje
105
40%
/
24%
Caducado
82
17%
Trabajando
Ha publicado: 2 ejemplos
2
Evaluación
Proyectos
17
59%
Arbitraje
2
0%
/
100%
Caducado
2
12%
Libre
Información sobre el proyecto
Presupuesto
30 - 100 USD