Taras Slobodyanik / 个人资料
- 信息
|
8+ 年
经验
|
60
产品
|
212
演示版
|
|
590
工作
|
0
信号
|
0
订阅者
|
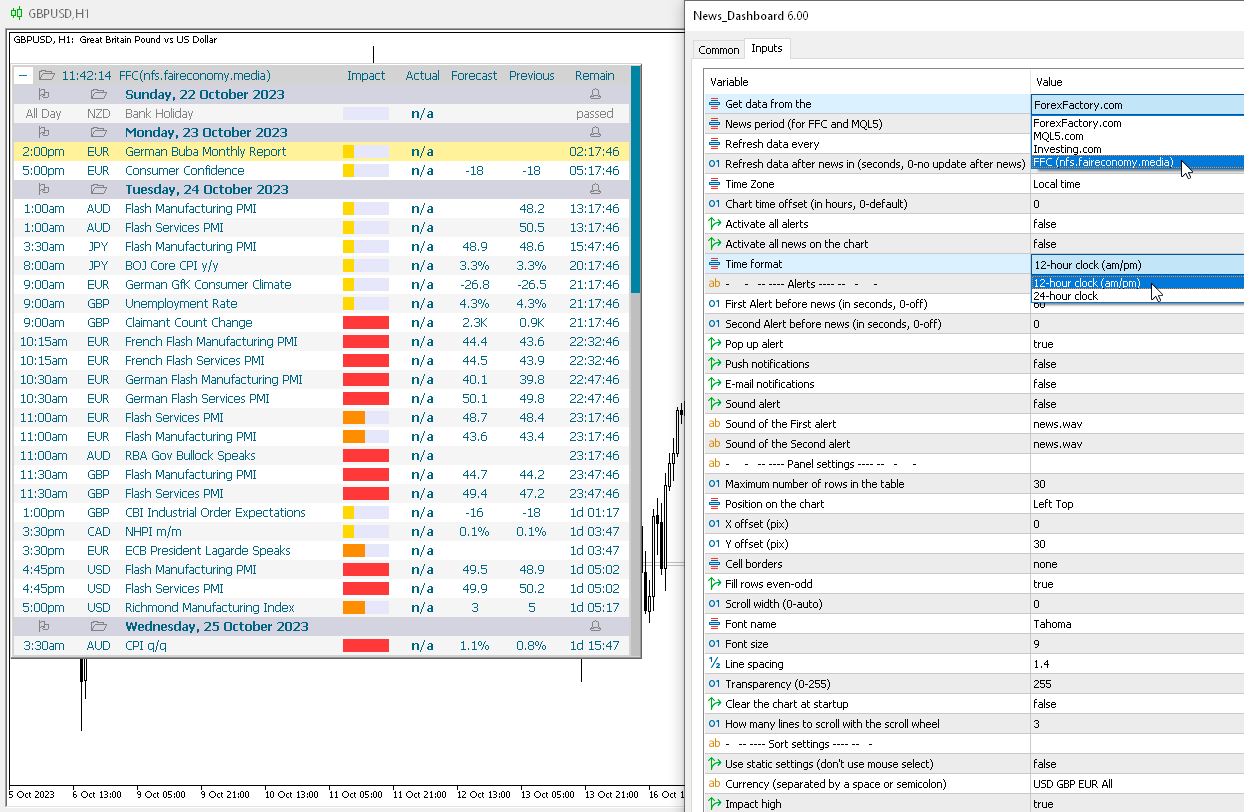
1) Added news source from "nfs.faireconomy.media" (hotkey 'J'). In the WebRequest parameters, you need to add the link: "https://nfs.faireconomy.media/ff_calendar_thisweek.json".
2) Added "Time format" parameter: 12-hour clock (am/pm) or 24-hour clock.
3) Fixed time shift bug for Holidays.
多货币和多时间框架指标 MACD。 仪表板可以显示传统(真实)MACD 和 MetaTrader 中内置的 MACD。 在面板上,您可以看到指标的当前状态 - MACD 线的移动方向、它们的交点以及带有指标图表的弹出窗口。 在参数中,您可以指定任何所需的交易品种和时间范围。 扫描仪还可以发送有关线相互交叉以及线穿过零电平的通知。 通过单击单元格,将打开给定的符号和句点。 因此,您可以轻松扫描所有时间范围的所有货币对和交易品种,以找到 MACD 主线和信号线或零水平的交叉点。 显示/隐藏仪表板的热键默认为“D”。 默认情况下,启用/禁用弹出图表的热键为“C”。 用于切换图表“1”和“2”上的箭头的热键。 MACD(移动平均收敛/发散)指标(或“振荡指标”)是根据历史价格数据(最常见的是收盘价)计算得出的三个时间序列的集合。 这三个系列是:MACD 系列本身、“信号”或“平均”系列以及“背离”系列(两者之间的区别)。 MACD 系列是价格系列的“快速”(短期)指数移动平均线 (EMA) 和“慢速”(较长周期)EMA 之间的差异。 平均数系列是 MACD 系列本身的 EMA。 参数
多货币和多时间框架指标 MACD。 仪表板可以显示传统(真实)MACD 和 MetaTrader 中内置的 MACD。 在面板上,您可以看到指标的当前状态 - MACD 线的移动方向、它们的交点以及带有指标图表的弹出窗口。 在参数中,您可以指定任何所需的交易品种和时间范围。 扫描仪还可以发送有关线相互交叉以及线穿过零电平的通知。 通过单击单元格,将打开给定的符号和句点。 因此,您可以轻松扫描所有时间范围的所有货币对和交易品种,以找到 MACD 主线和信号线或零水平的交叉点。 显示/隐藏仪表板的热键默认为“D”。 默认情况下,启用/禁用弹出图表的热键为“C”。 用于切换图表“1”和“2”上的箭头的热键。 MACD(移动平均收敛/发散)指标(或“振荡指标”)是根据历史价格数据(最常见的是收盘价)计算得出的三个时间序列的集合。 这三个系列是:MACD 系列本身、“信号”或“平均”系列以及“背离”系列(两者之间的区别)。 MACD 系列是价格系列的“快速”(短期)指数移动平均线 (EMA) 和“慢速”(较长周期)EMA 之间的差异。 平均数系列是 MACD 系列本身的 EMA。 参数
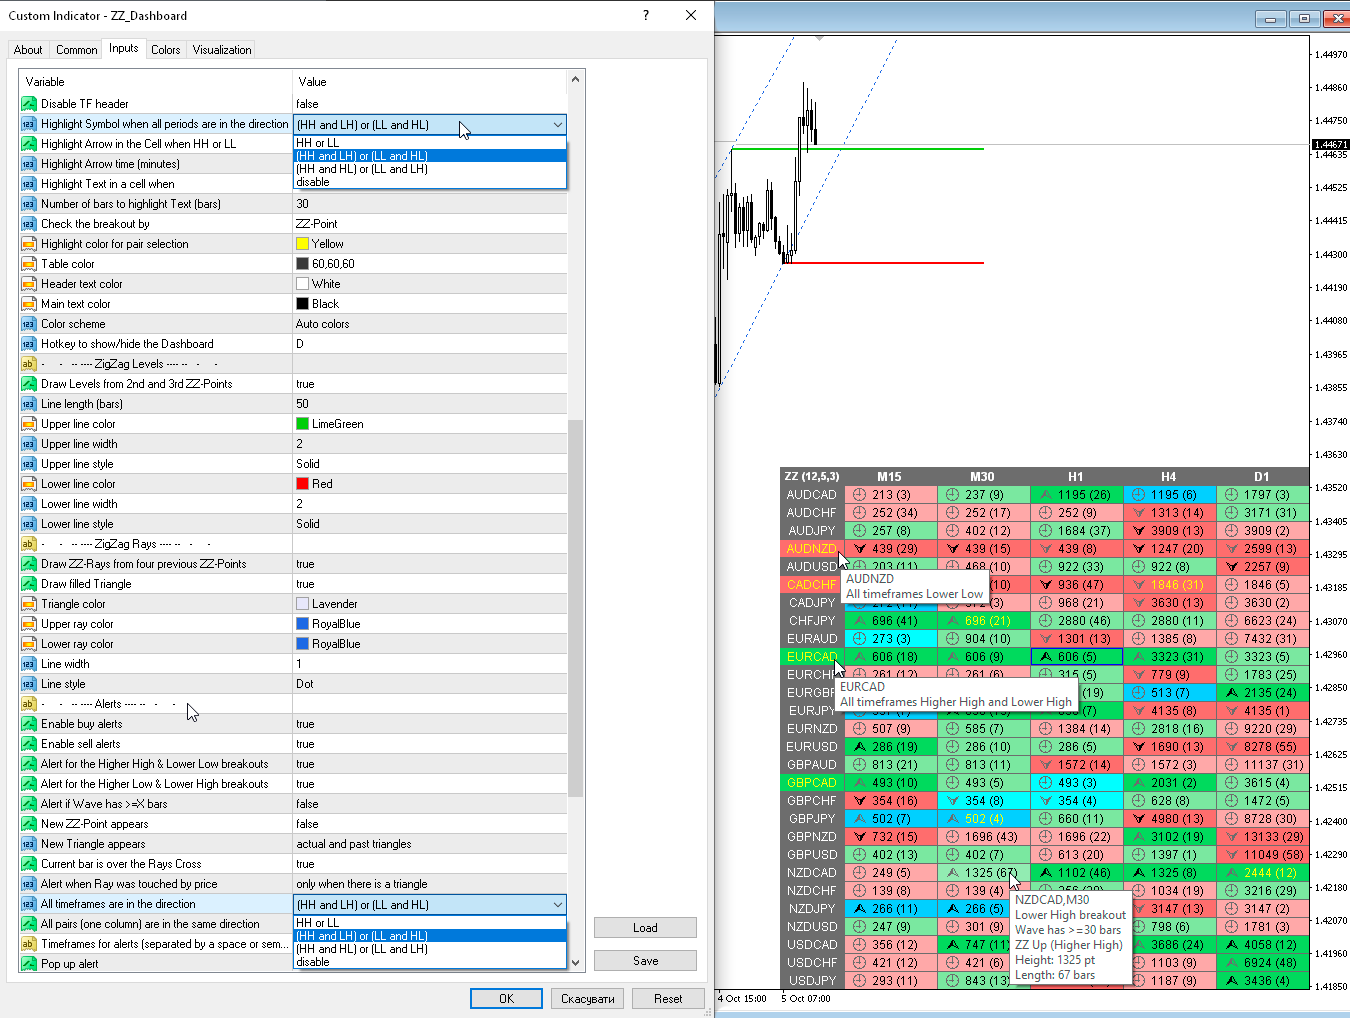
1) Added cell fill colors for Higher High (HH), Lower High (LH), Higher Low (HL), Lower Low (LL).
2) Added highlighting parameters for a Symbol (Pair) if all timeframes contain the specified combination HH-LH-HL-LL.
3) Added alert parameters for a Symbol (Pair) if all timeframes contain the specified combination HH-LH-HL-LL.
4) Tooltips have been changed.
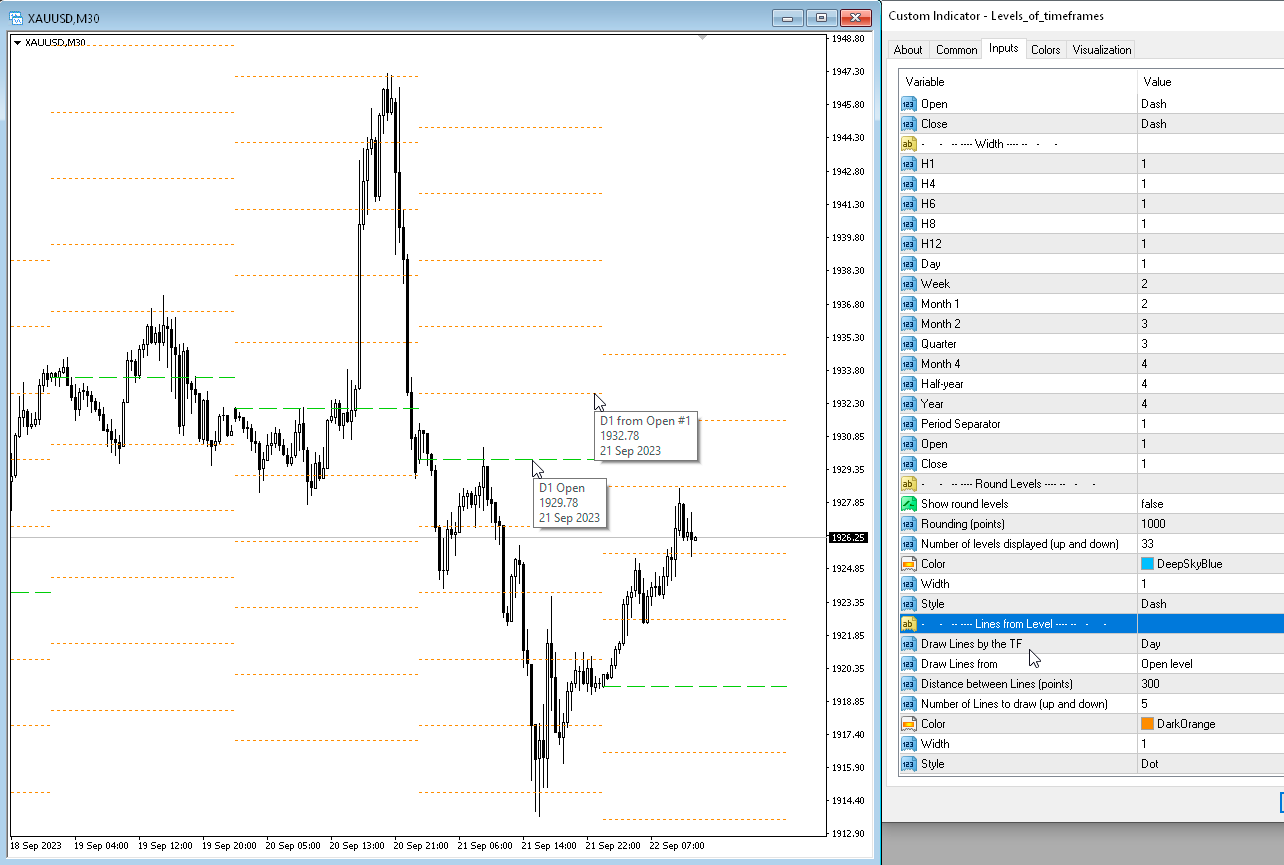
1) Added parameters for drawing lines from a given level - "Lines from Level".
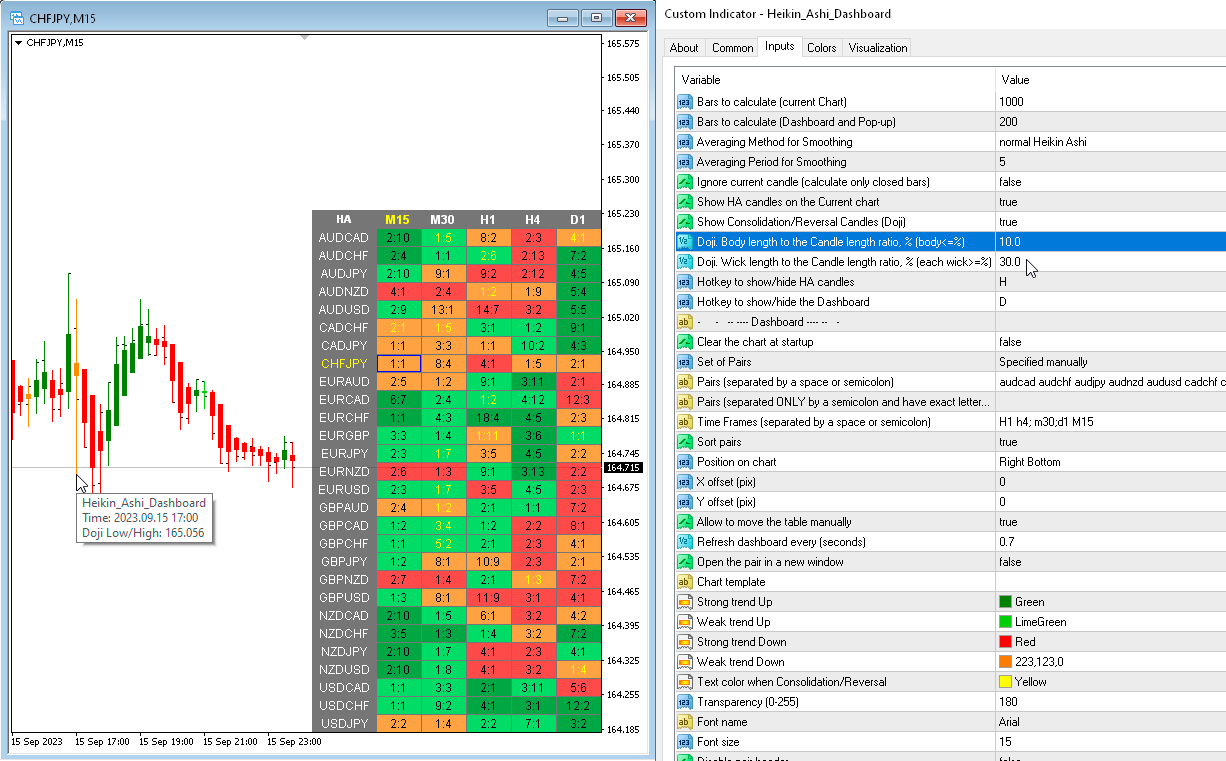
1) Added parameters for Doji calculation: "Doji. Body length to the Candle length ratio, % (body<=%)" and "Doji. Wick length to the Candle length ratio, % (each wick>=%)".
2) Added a parameter to the "Popup chart" for Doji: "Highlight Doji candles". You can now turn off "Highlight Weak candles" and only see Doji.
3) The "Y-offset (pix, +/-)" parameter can now be negative.
该指标具有三个主要工具:放大镜(缩放图表)、标尺(时间和价格刻度)和十字准线。 您可以用鼠标移动它并自定义不同的显示格式,自定义每个元素的大小和颜色。 放大镜(缩放图表)允许您显示任何时间范围和不同比例的蜡烛。 默认热键:“Q”- 更高的时间范围,“A”- 更低的时间范围,“W”- 减小蜡烛尺寸,“S”- 增加蜡烛尺寸,“Z”- 显示/隐藏缩放图表。 您可以在评论页面找到最新的演示。 → 演示版仅适用于 USDJPY 货币对。 时间刻度根据时间周期标记图表。 您可以设置时移,以便您可以在刻度上看到您的当地时间,而不是经纪商的时间(因此它会在图表上显示您的当地时间,而不是 MT 时间)。 时间格式可以设置为 24 小时制或 12 小时制。 热键“T”- 显示/隐藏时间刻度。 价格刻度垂直标记图表。 您可以设置显示数字和四舍五入价格的格式。 热键“P”- 显示/隐藏价格等级。 十字线可以显示价格、时间、柱数、点数、百分比、根据指定手数计算的利润(按手数计算的利润)、根据指定金额计算的手数(按风险手数)。 热键“C”- 显示/隐藏十字准线。
该指标具有三个主要工具:放大镜(缩放图表)、标尺(时间和价格刻度)和十字准线。 您可以用鼠标移动它并自定义不同的显示格式,自定义每个元素的大小和颜色。 放大镜(缩放图表)允许您显示任何时间范围和不同比例的蜡烛。 默认热键:“Q”- 更高的时间范围,“A”- 更低的时间范围,“W”- 减小蜡烛尺寸,“S”- 增加蜡烛尺寸,“Z”- 显示/隐藏缩放图表。 您可以在评论页面找到最新的演示。 → 演示版仅适用于 USDJPY 货币对。 时间刻度根据时间周期标记图表。 您可以设置时移,以便您可以在刻度上看到您的当地时间,而不是经纪商的时间(因此它会在图表上显示您的当地时间,而不是 MT 时间)。 时间格式可以设置为 24 小时制或 12 小时制。 热键“T”- 显示/隐藏时间刻度。 价格刻度垂直标记图表。 您可以设置显示数字和四舍五入价格的格式。 热键“P”- 显示/隐藏价格等级。 十字线可以显示价格、时间、柱数、点数、百分比、根据指定手数计算的利润(按手数计算的利润)、根据指定金额计算的手数(按风险手数)。 热键“C”- 显示/隐藏十字准线。
1) Added parameter "IB body must be inside of the MB body".
2) Added parameter "IB body and wicks must be inside the MB body".
3) Added a Dashboard recovery check when running multiple copies on the same chart.
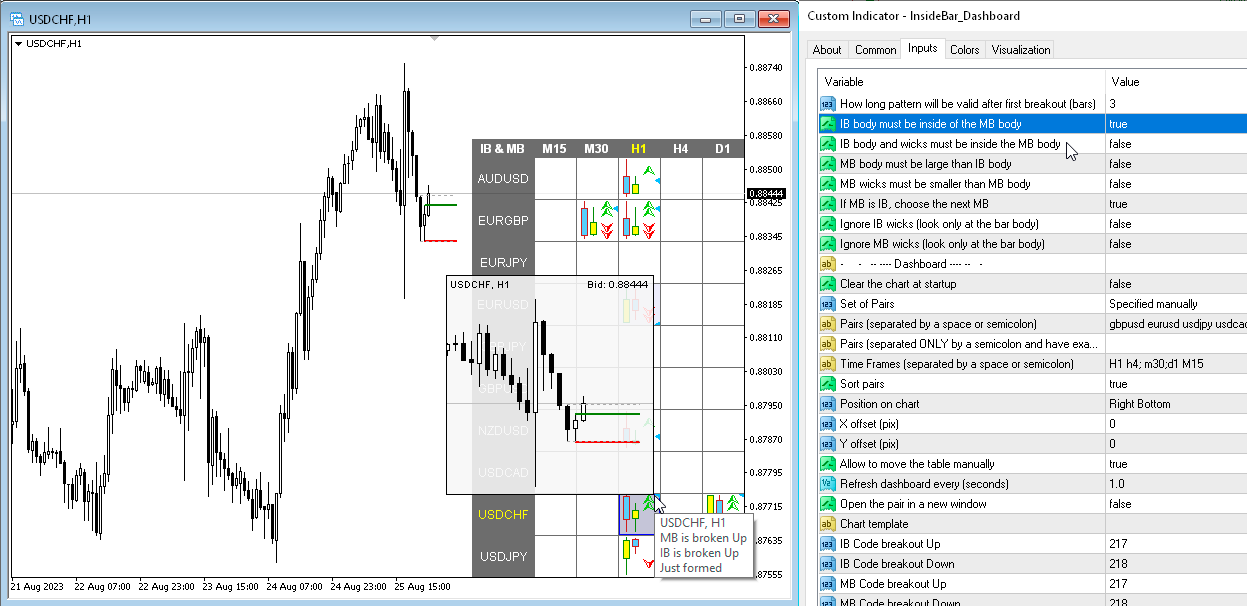
1) Added a hotkey to hide the dashboard, by default "D".
2) Added "Popup chart" parameters. Now, when you hover the mouse over the cells, you can see a pop-up chart from this timeframe.
3) Added "Color scheme" parameter.
4) Added the ability to enable/disable alerts for each Symbol when clicking on the name of the Pair. If no Pair is selected then alerts are enabled for all Symbols.
5) The condition of the list of pairs for the second parameter has been changed. Pairs in the second parameter must be typed only with a semicolon and must be in exact case. "Pairs (separated ONLY by a semicolon and have exact letter case)"
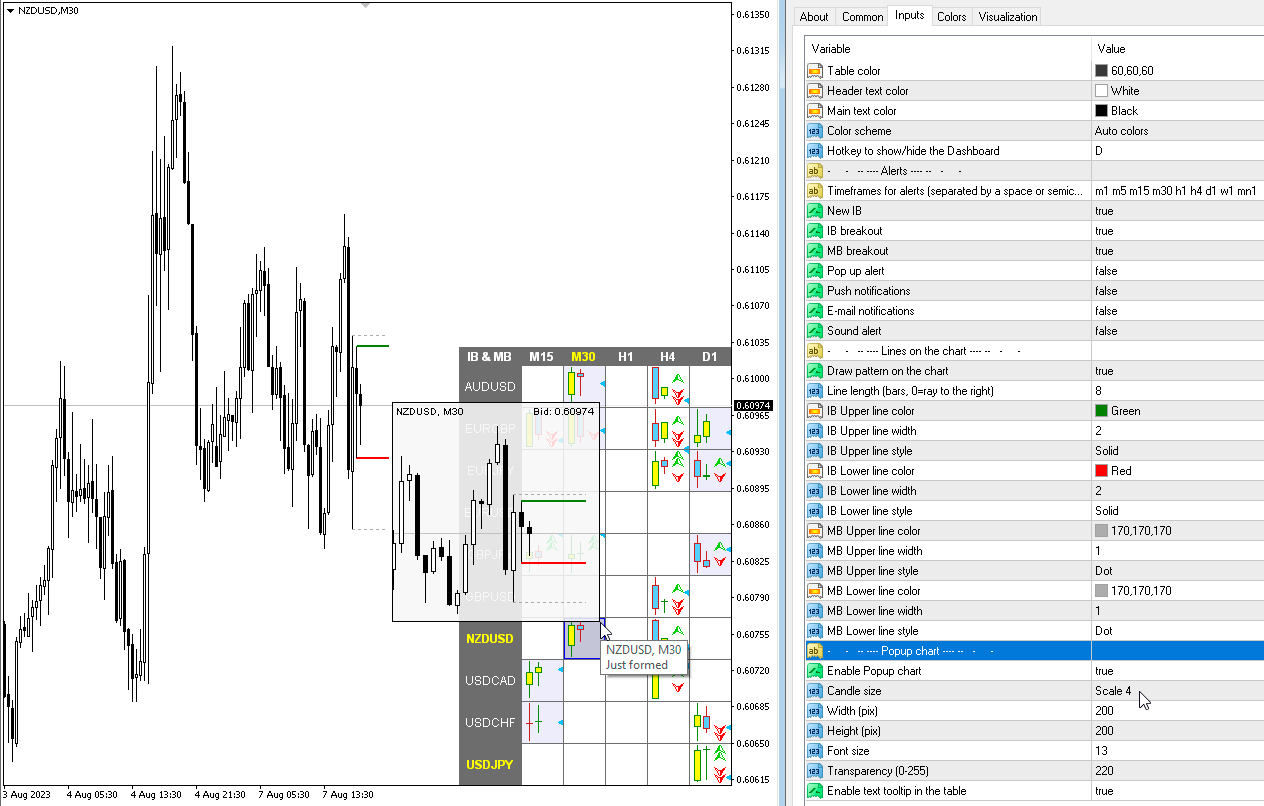
1) Added a hotkey to hide the dashboard, by default "D".
2) Added "Popup chart" parameters. Now, when you hover the mouse over the cells, you can see a pop-up chart from this timeframe.
3) Added "Color scheme" parameter.
4) Added alert and cell highlight for the middle line.
5) Added the ability to enable/disable alerts for each Symbol when clicking on the name of the Pair. If no Pair is selected then alerts are enabled for all Symbols.
6) The condition of the list of pairs for the second parameter has been changed. Pairs in the second parameter must be typed only with a semicolon and must be in exact case. "Pairs (separated ONLY by a semicolon and have exact letter case)".
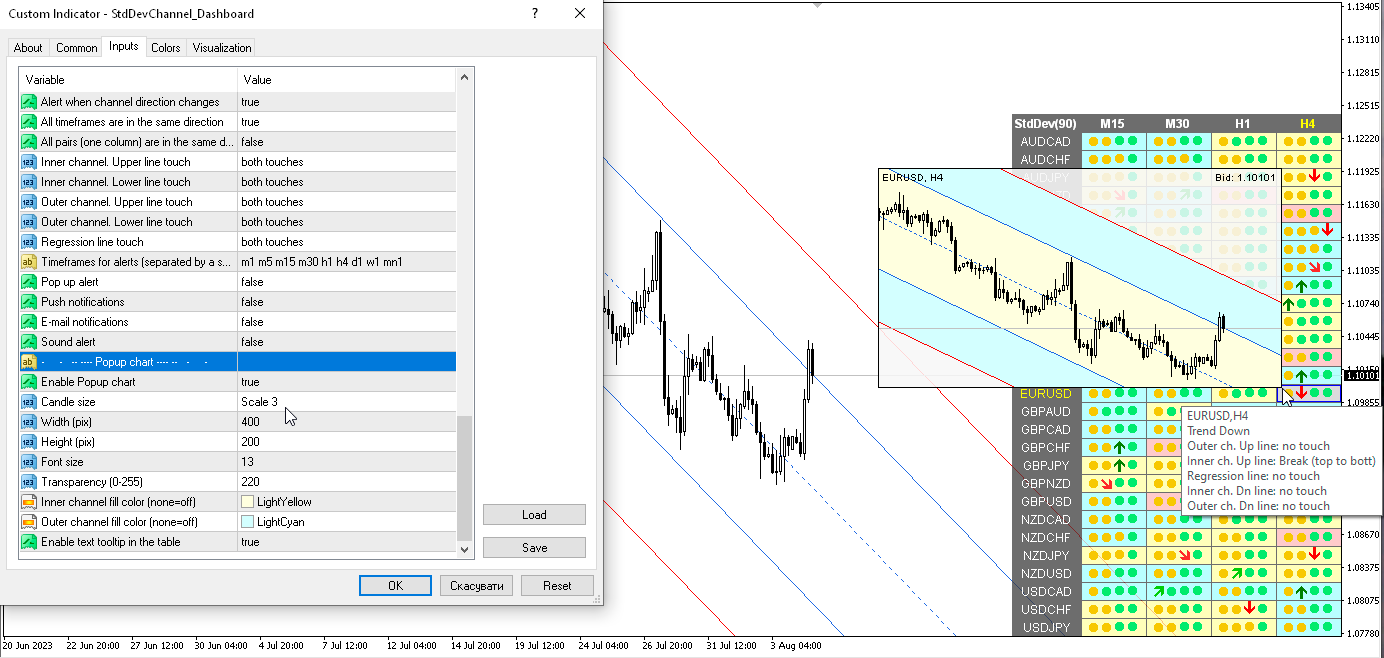
1) Added a hotkey to hide the dashboard, by default "D".
2) Added "Popup chart" parameters. Now, when you hover the mouse over the cells, you can see a pop-up chart from this timeframe.
3) Added "Color scheme" parameter.
4) The condition of the list of pairs for the second parameter has been changed. Pairs in the second parameter must be typed only with a semicolon and must be in exact case. "Pairs (separated ONLY by a semicolon and have exact letter case)"
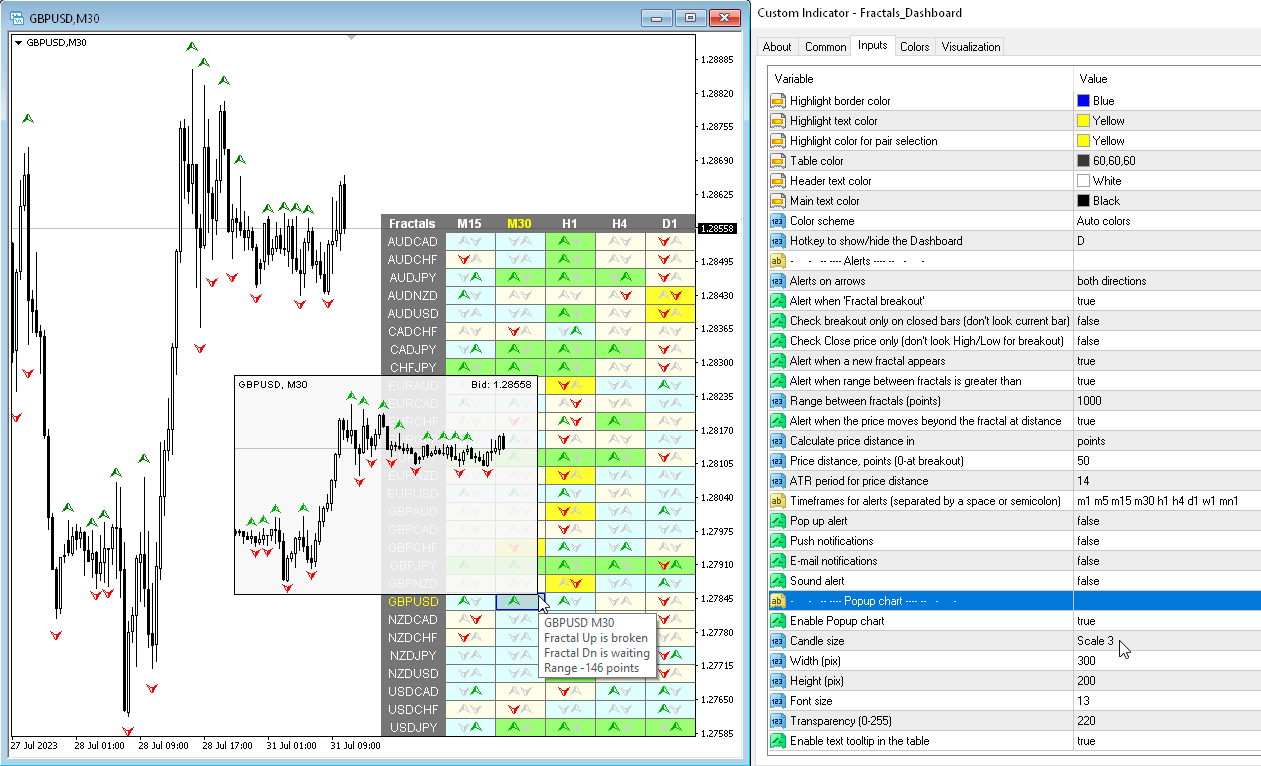
1) Various alerts have been added for the Triangle. Also cell fill colors when the price is in the Triangle.
2) Added more tooltips, fixed some text descriptions.
3) Added "Color scheme" parameter.
4) Added a hotkey to hide the dashboard, by default "D".
5) Added "Popup chart" parameters. Now, when you hover the mouse over the cells, you can see a pop-up chart from this timeframe.
6) The condition of the list of pairs for the second parameter has been changed. Pairs in the second parameter must be typed only with a semicolon and must be in exact case. "Pairs (separated ONLY by a semicolon and have exact letter case)"
7) Code optimization and bug fixes.
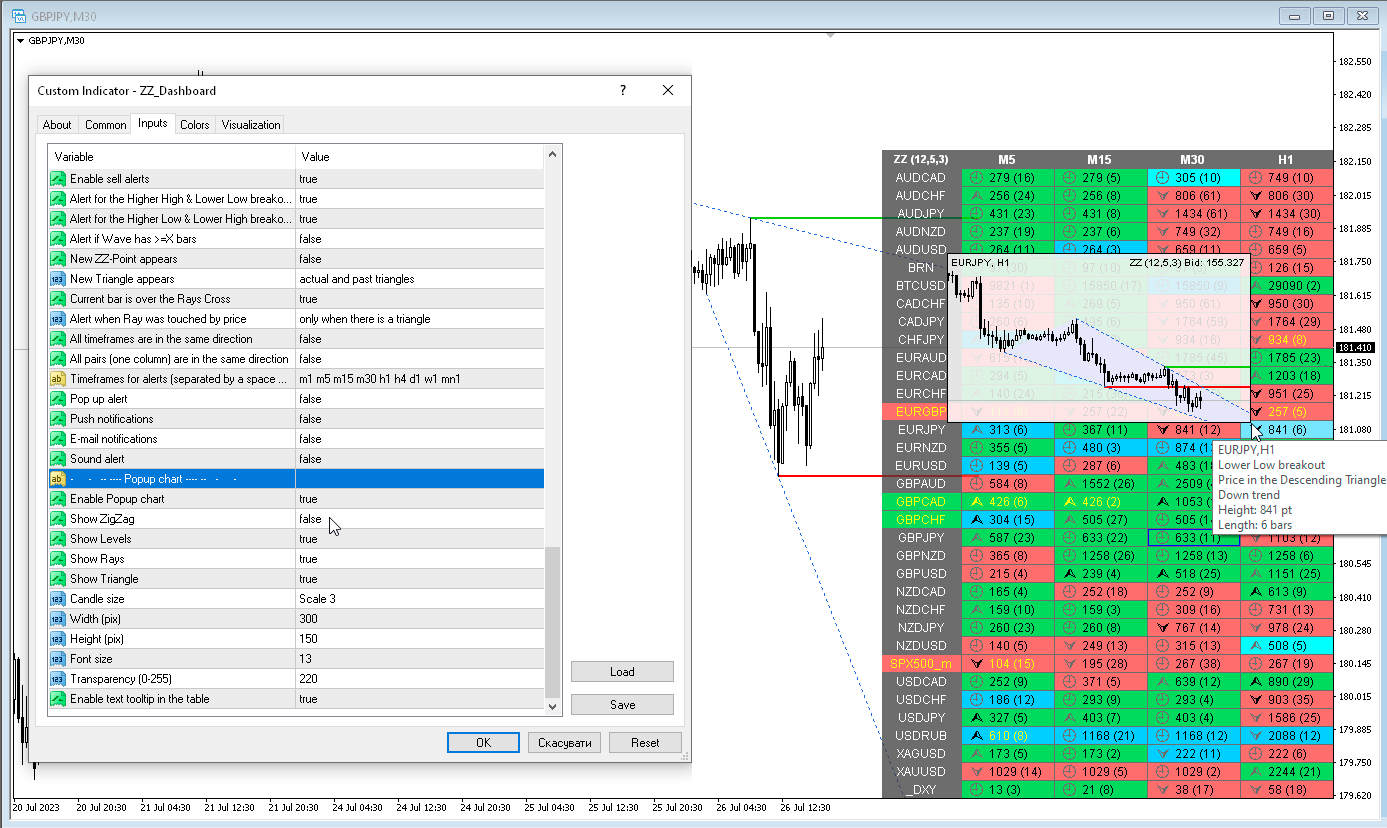
1) Added "Popup chart" parameters. Now, when you hover the mouse over the cells, you can see a pop-up chart from this timeframe.
2) Added "Bars to calculate" parameters for Dashboard and Chart.
3) The condition of the list of pairs for the second parameter has been changed. Pairs in the second parameter must be typed only with a semicolon and must be in exact case. "Pairs (separated ONLY by a semicolon and have exact letter case)"
4) Fixed some minor bugs.
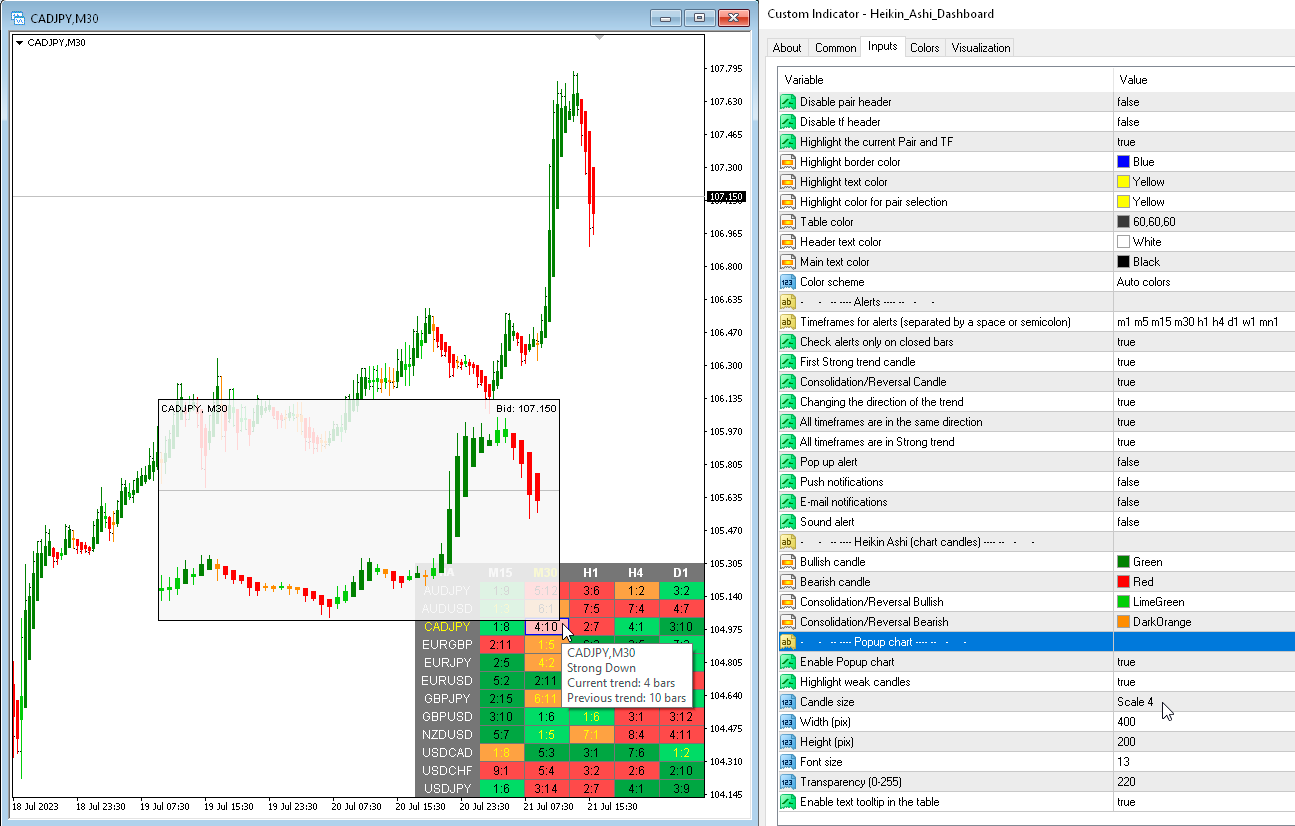
1) Added "Popup chart" parameters. Now, when you hover the mouse over the cells, you can see a pop-up chart from this timeframe.
2) Fixed some minor bugs.
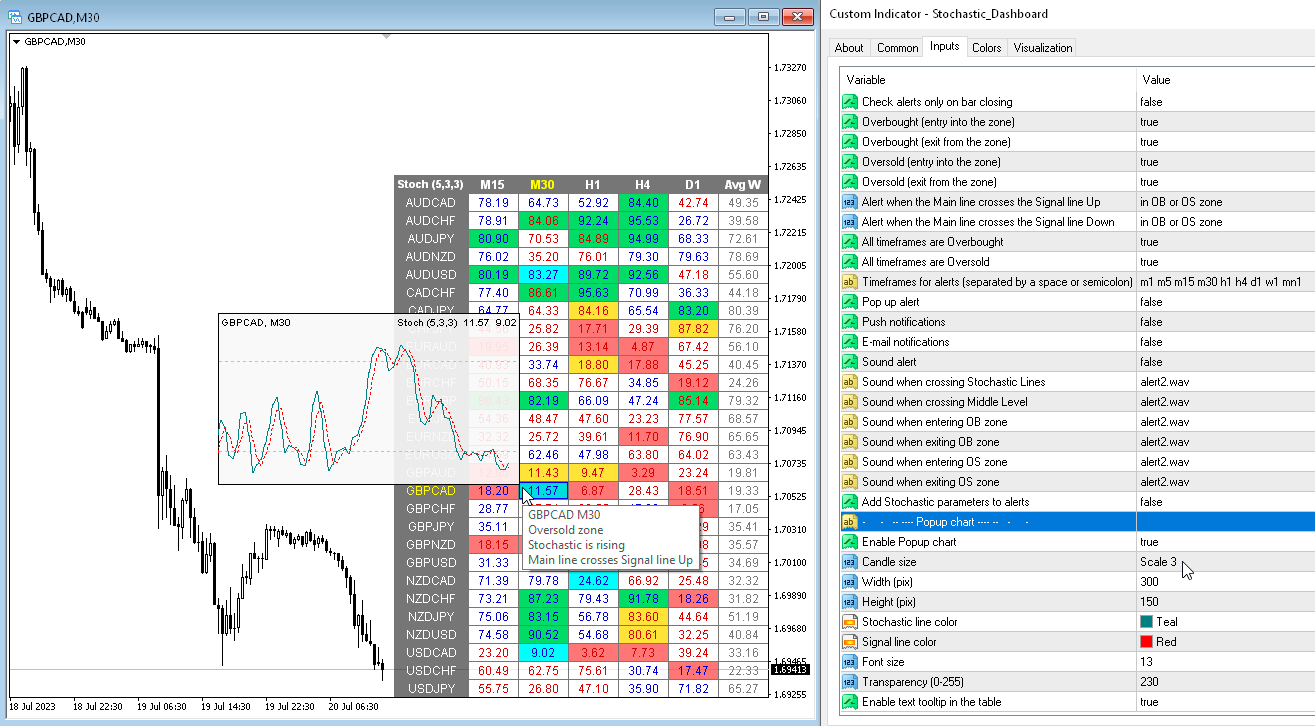
1) Added "Popup chart" parameters. Now, when you hover the mouse over the cells, you can see a pop-up chart from this timeframe.
2) Fixed some minor bugs.
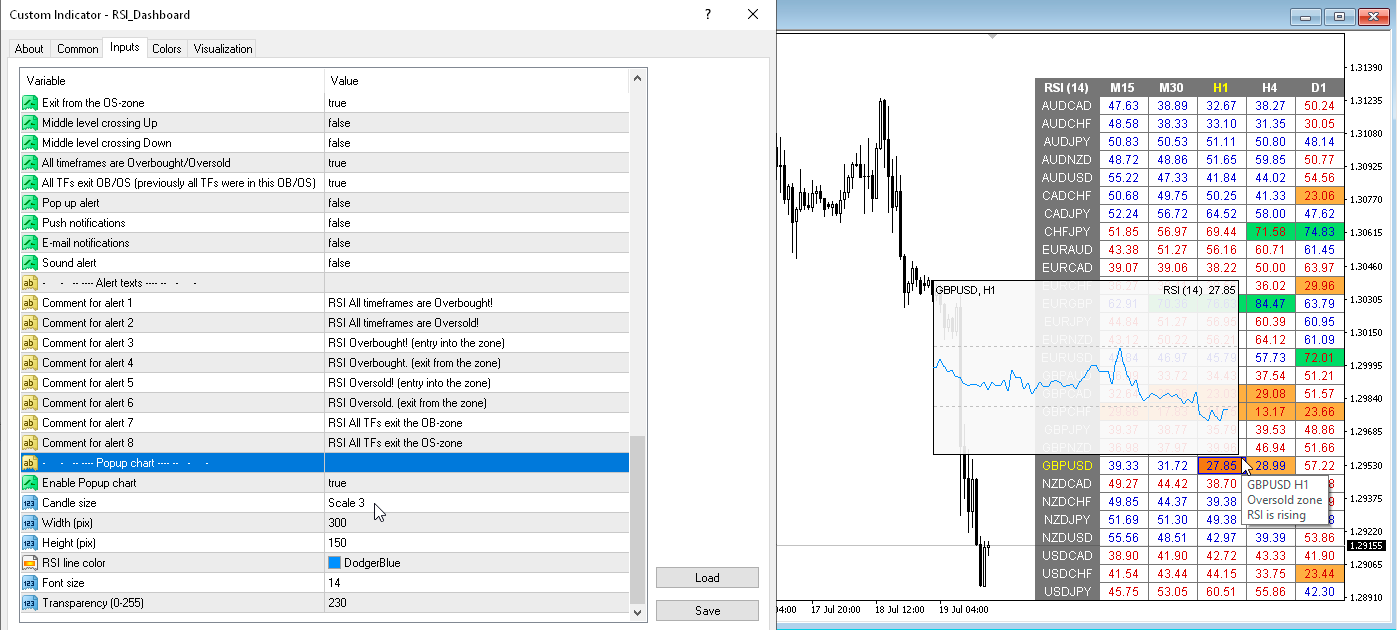
1) Added "Popup chart" parameters. Now, when you hover the mouse over the cells, you can see a pop-up chart from this timeframe.
2) Fixed some minor bugs.
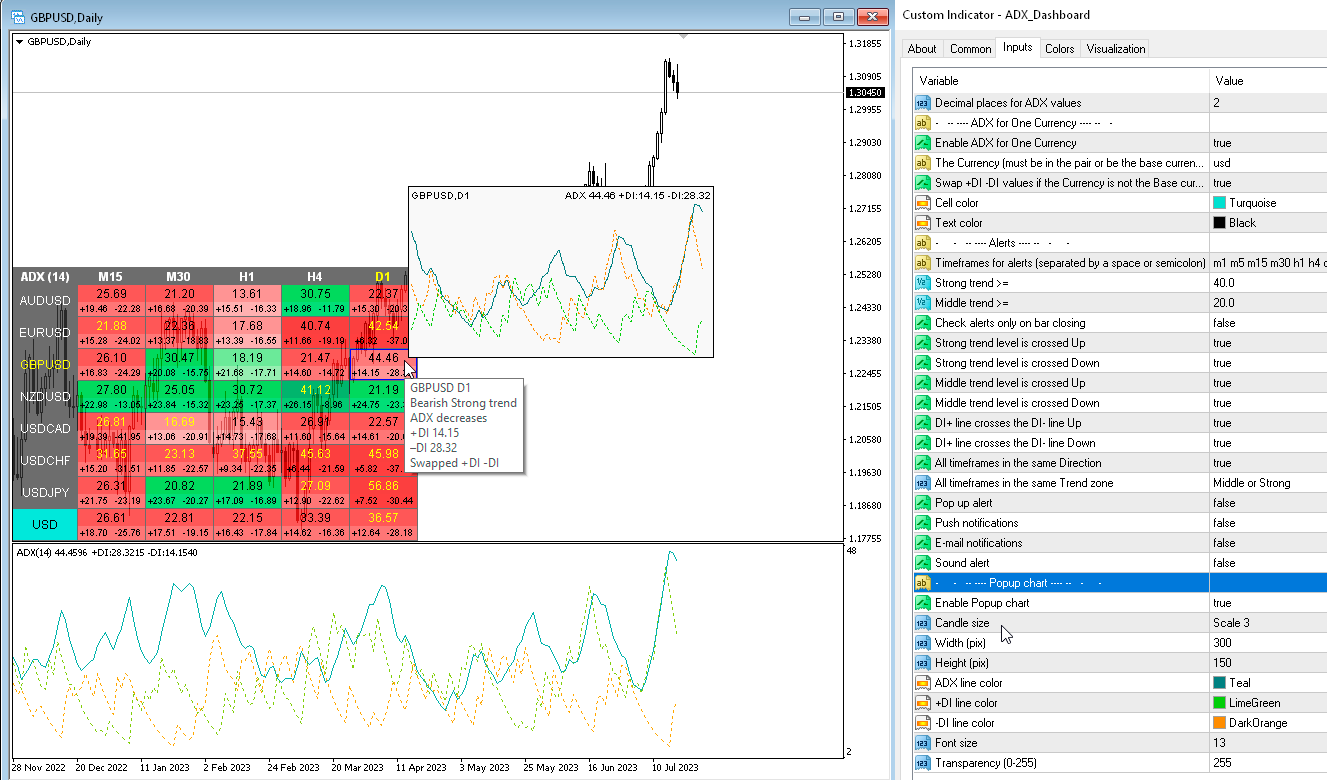
1) Added "Popup chart" parameters. Now, when you hover the mouse over the cells, you can see a pop-up chart from this timeframe.
2) Fixed some minor bugs.
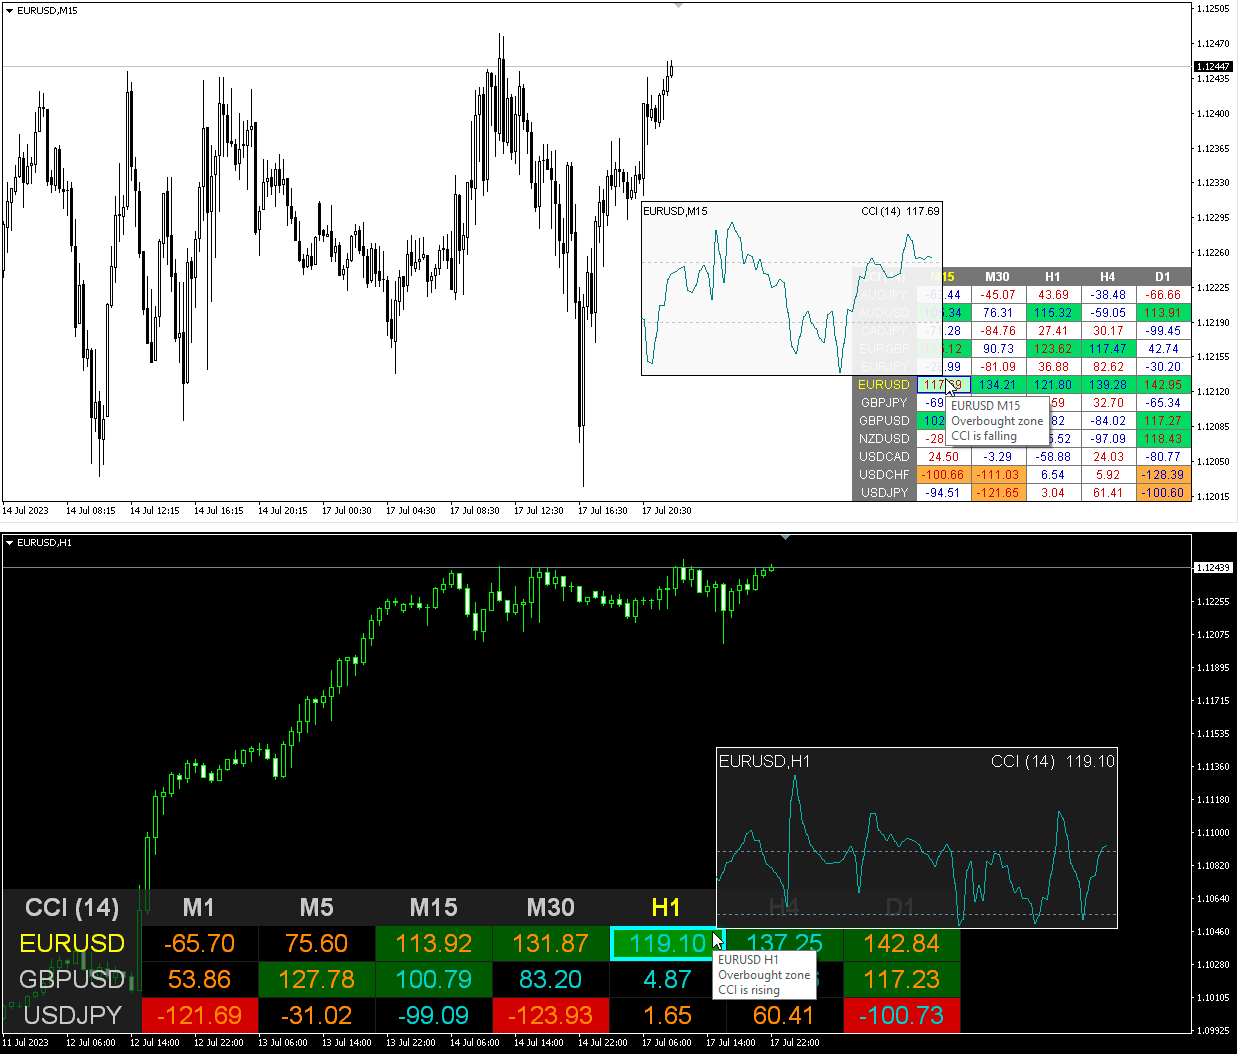
1) Added "Popup chart" parameters. Now, when you hover the mouse over the cells, you can see a pop-up chart from this timeframe.
2) Fixed some minor bugs.
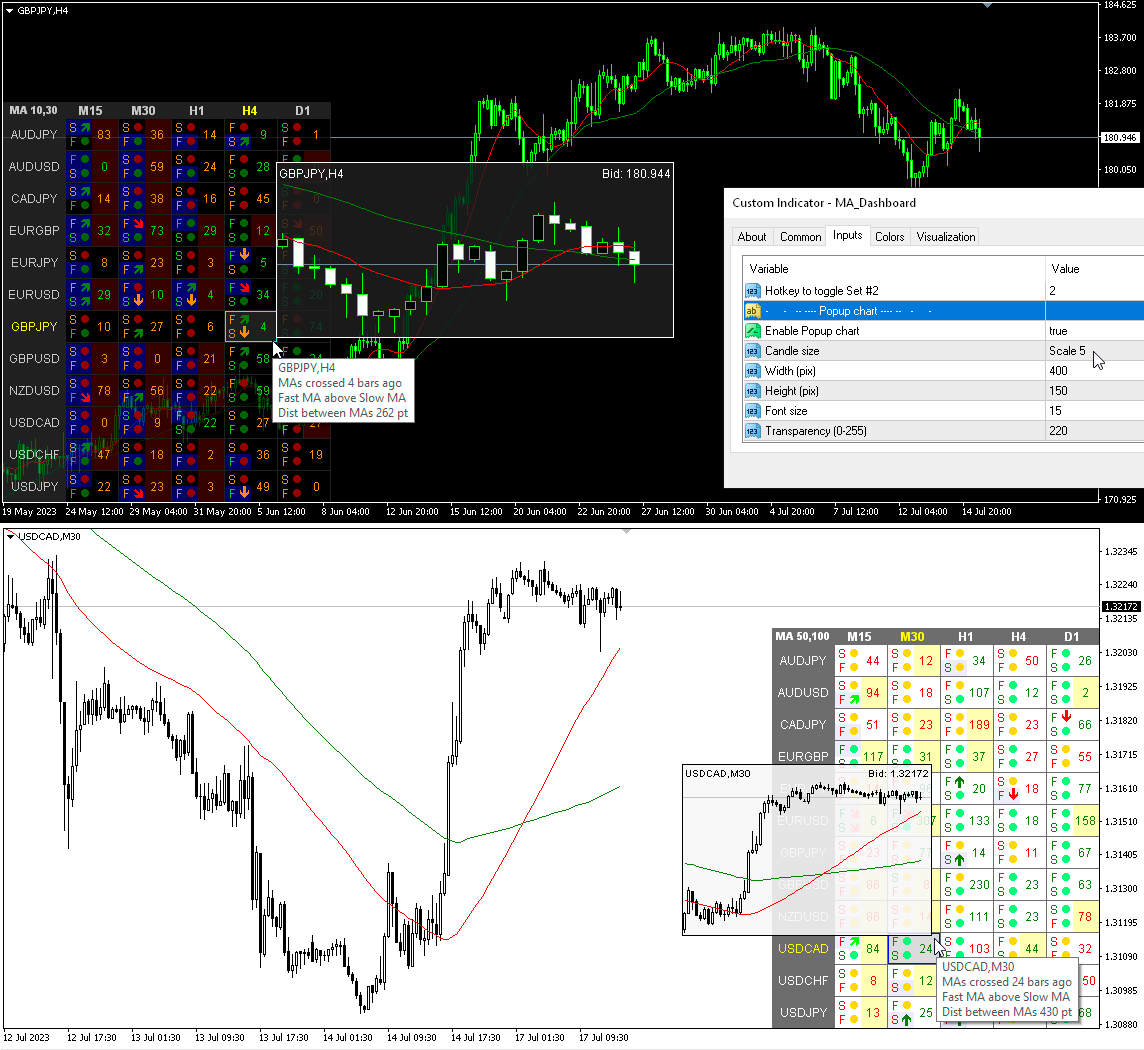
1) Added "Popup chart" parameters. Now, when you hover the mouse over the cells, you can see a pop-up chart from this timeframe.
2) Fixed some minor bugs.


