Taras Slobodyanik / 个人资料
- 信息
|
10+ 年
经验
|
60
产品
|
242
演示版
|
|
629
工作
|
0
信号
|
0
订阅者
|
1) Added "Distance between MA" to tooltips.
------------------------------------------------------------------------------------
MA Dashboard (обновление 1.30)
1) Во всплывающие подсказки добавлена "Дистанция между МА".
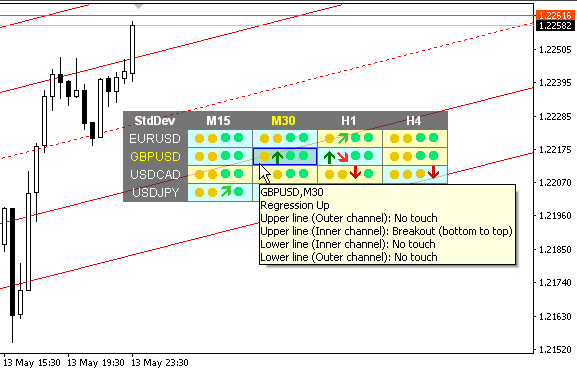
1) Changed the arrow code when touching channel lines.
2) Added cell tooltips to describe the current state of the regression.
3) "Check alerts only when the candle is closed" parameter changed to "All calculations only after the bar closes, don't look current bar".
4) The value of the crossing price has been added to the alert.
------------------------------------------------------------------------------------
Standard Deviation Channel Dashboard (обновление 1.50)
1) Изменен код стрелки при касании линий канала.
2) Добавлены всплывающие подсказки ячейки для описания текущего состояния регрессии.
3) Параметр "Check alerts only when the candle is closed" изменен на "All calculations only after the bar closes, don't look current bar".
4) К алерту добавлено значение цены пересечения.
1) Added tooltips showing current trend strength and current ADX direction.
------------------------------------------------------------------------------------
ADX Dashboard (обновление 1.50)
1) Добавлены всплывающие подсказки показывающие текущую силу тренда и текущее направление ADX.
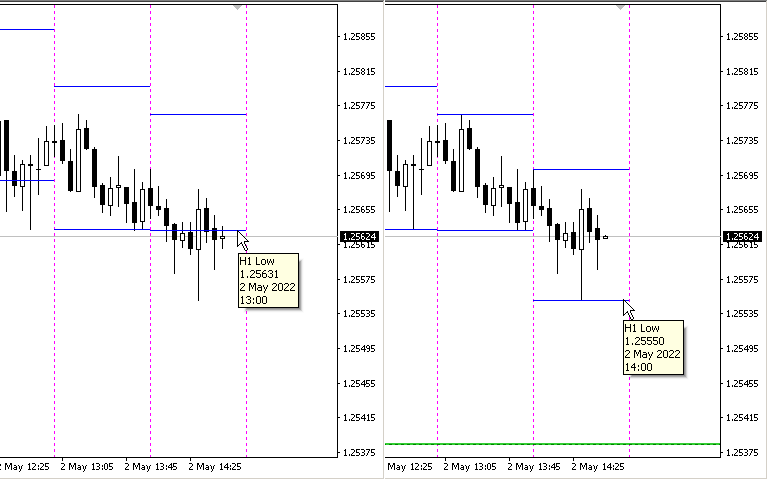
1) Added levels for the H1 timeframe.
------------------------------------------------------------------------------------
Levels of Timeframes (обновление 2.80)
1) Добавлены уровни для таймфрейма H1.
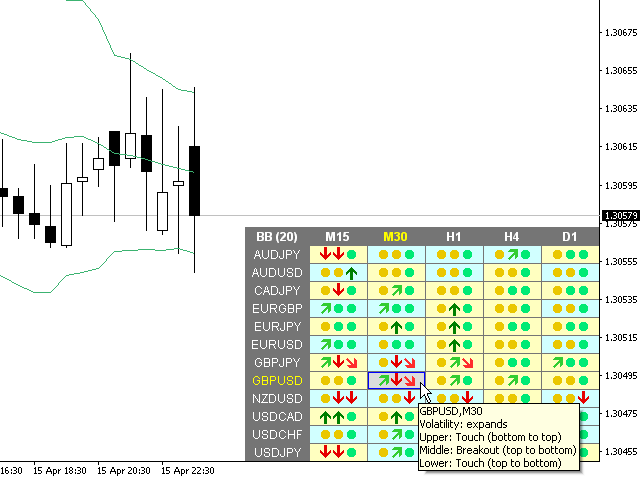
1) Added filling of cells to display the current volatility. (Volatility expands/Volatility falls)
2) Added cell tooltips to describe the current state of the BB.
3) Changed the arrow code when touching the band.
4) Added a parameter to highlight the current Pair and TF.
------------------------------------------------------------------------------------
Bollinger Bands Dashboard (update 1.80)
1) Добавлена заливка ячеек для отображения текущей волатильности. (Volatility expands/Volatility falls)
2) Добавлены всплывающие подсказки ячейки для описания текущего состояния ББ.
3) Изменен код стрелки при касании ББ.
4) Добавлен параметр для подсветки текущей Пары и ТФ.
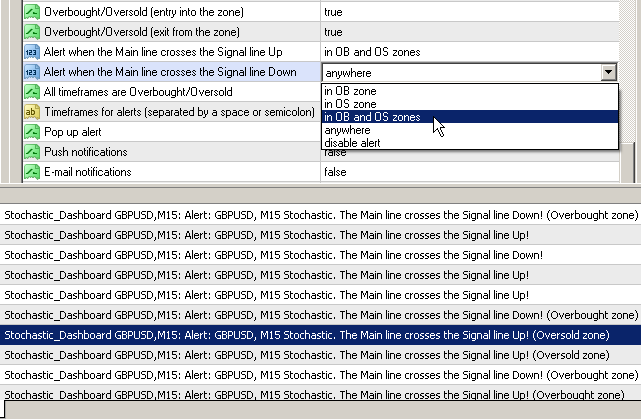
1) Changed the alert parameter when the stochastic lines cross. Now you can select an alert zone where the lines crossed.
2) The condition of the list of pairs for the second parameter has been changed. Pairs in the second parameter must be typed only with a semicolon and must be in exact case. "Pairs (separated ONLY by a semicolon and have exact letter case)".
------------------------------------------------------------
Dashboard Stochastic Multicurrency
1) Изменен параметр алерта при пересечении линий стохастика. Теперь вы можете выбрать зону для алерта, в которой произошло пересечение линий.
2) Изменено условие перечня пар для второго параметра. Пары во втором параметре должны набираться только через точку с запятой и иметь точный регистр букв. "Pairs (separated ONLY by a semicolon and have exact letter case)".
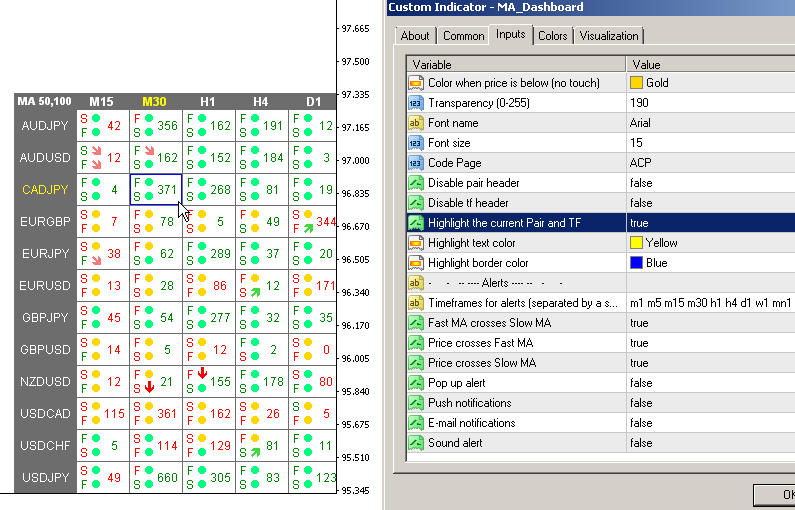
1) Added a parameter to highlight the current Pair and TF. (Highlight the current Pair and TF).
------------------------------------------------------------------------------------
Dashboard Stochastic и MA Dashboard
1) Добавлен параметр для подсветки текущей Пары и ТФ. (Highlight the current Pair and TF).
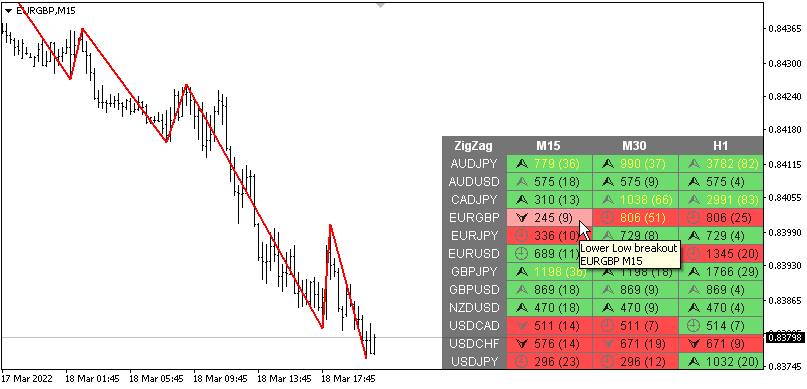
1) Added parameter: 'Alert for the Higher High & Lower Low breakouts'.
2) Added parameter: 'Alert for the Higher Low & Lower High breakouts'.
3) Added tooltip for cells.
4) Changed the color of the arrows for different breakouts.
------------------------------------------------------------------------------------
ZigZag Dashboard (обновление 3.30)
1) Добавлен параметр: 'Alert for the Higher High & Lower Low breakouts'.
2) Добавлен параметр: 'Alert for the Higher Low & Lower High breakouts'.
3) Добавлена всплывающая подсказка для ячеек.
4) Изменен цвет стрелок при различных пробитиях.
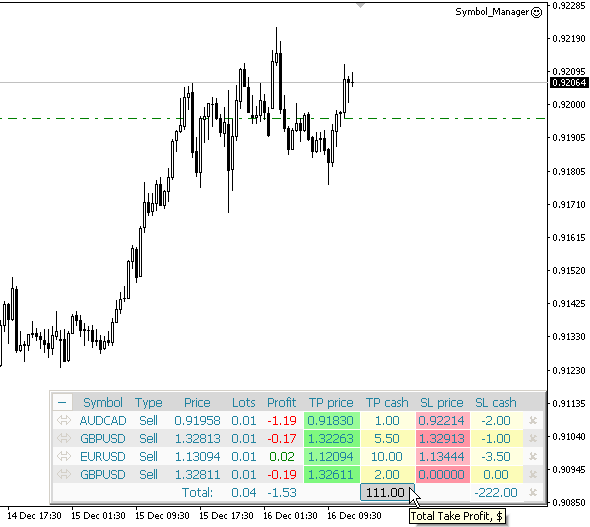
1) Added the "Sort symbols alphabetically" parameter.
2) Added cells for setting the total profit and loss in the money of the deposit (Total TP/SL Cash).
------------------------------------------------------------------------------------
Symbol Manager (обновление 3.90)
1) Добавлен параметр "Sort symbols alphabetically".
2) Добавлены ячейки для установки общей прибыли и убытка в деньгах депозита (Total TP/SL Cash).
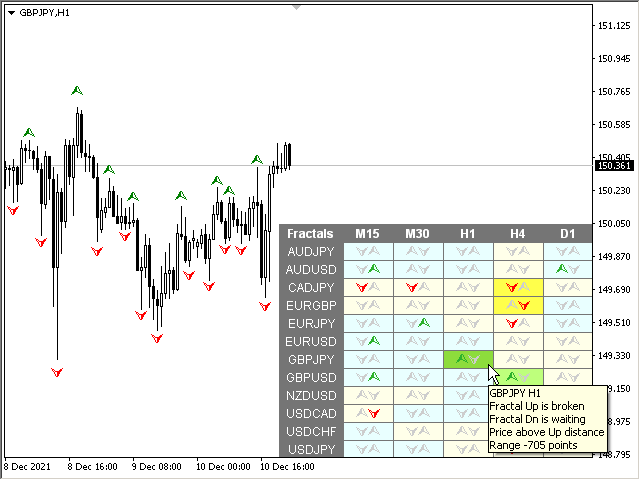
1) Added new colors for cells.
2) Added new tooltips.
3) Added information to alerts.
4) The names of some parameters have been changed.
------------------------------------------------------------------------------------
Fractals Dashboard (обновление 3.00)
1) Добавлены новые цвета для ячеек.
2) Добавлены новые всплывающие подсказки.
3) Добавлена информация в алерты.
4) Изменены названия некоторых параметров.
移动平均线 (MA) 指标的多货币和多时间范围修改。 在仪表板上,您可以看到指标的当前状态 - 快速 MA 和慢速 MA 的突破和触及(按价格),以及 MA 线彼此之间的交叉点(移动平均线交叉)。 在参数中,您可以指定任何所需的货币和时间范围。 此外,该指标还可以发送有关价格触及线及其交叉的通知。 通过单击带有句点的单元格,将打开该符号和句点。 这是 MTF 扫描仪。您可以在图表上运行多个仪表板。 该指标在当前图表上显示快速 MA 线和慢速 MA 线。 您可以为图表选择 MA 时间范围并从其他时间范围观察 MA (MTF MA)。 两组MA的热键默认为“1”和“2”。 默认情况下,从图表中隐藏仪表板的键是“D” 参数 Fast MA — 快速MA Averaging period — 平均周期. Shift — 转移。 Averaging method — 平均法。 Applied price — 适用价格。 Slow MA — 慢MA Averaging period — 平均周期。 Shift — 转移。 Averaging method — 平均法。 Applied price
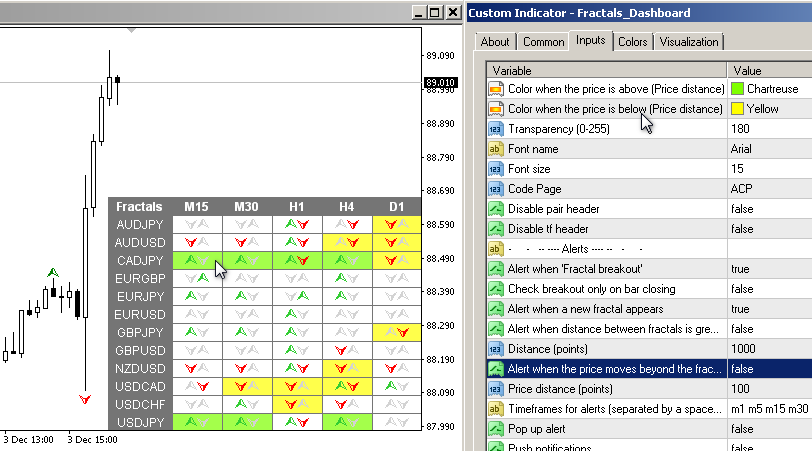
1) Added an alert when the current price goes beyond the current fractals by a specified distance.
2) Added colors when the current price is above/below the current fractals (Color when the price is above/below).
------------------------------------------------------------------------------------
Fractals Dashboard (обновление 2.60)
1) Добавлен алерт когда текущая цена выходит за пределы текущих фракталов на заданную дистанцию.
2) Добавлены цвета когда текущая цена над/под текущими фракталами (Color when the price is above/below).
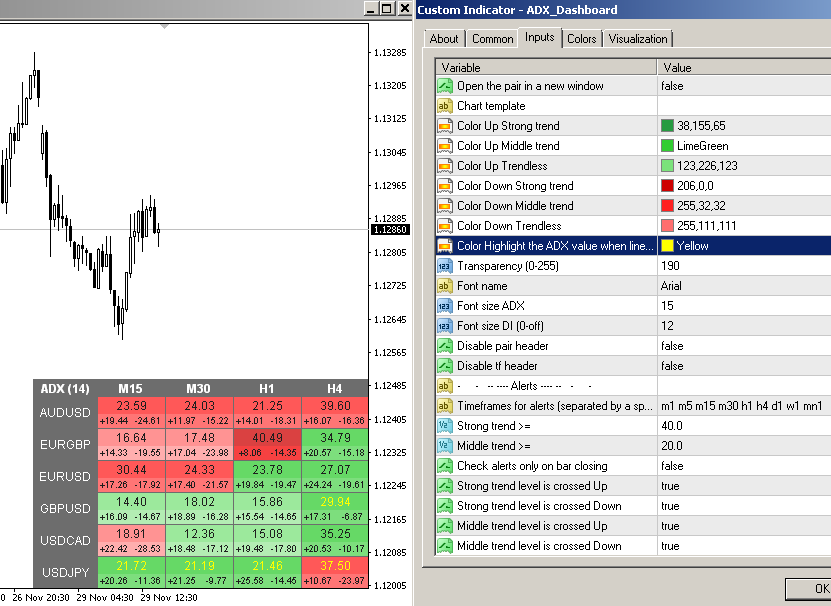
1) Added parameter: "Color Highlight the ADX value when line is increasing".
------------------------------------------------------------
ADX Dashboard (обновление 1.10)
1) Добавлен параметр: "Цвет подсветки значения ADX при росте линнии".
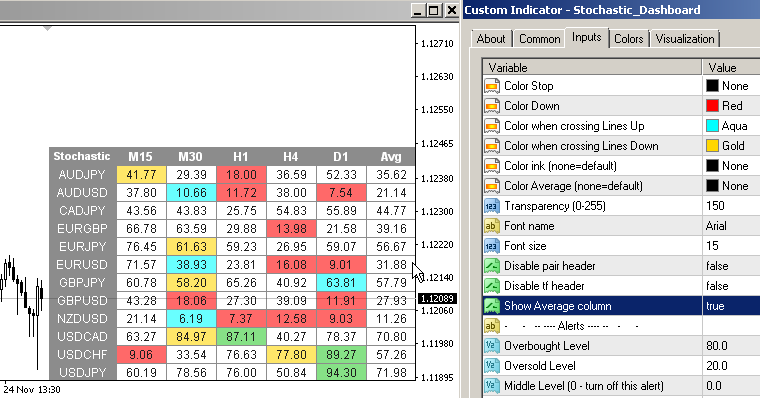
1) Added a column for the average ('Show Average column').
2) Added a parameter for the color of the average column ('Color Average').
------------------------------------------------------------
Dashboard Stochastic Multicurrency (обновление 3.70)
1) Добавлена колонка для среднего значения ('Show Average column').
2) Добавлен параметр для цвета колонки среднего значения ('Color Average').
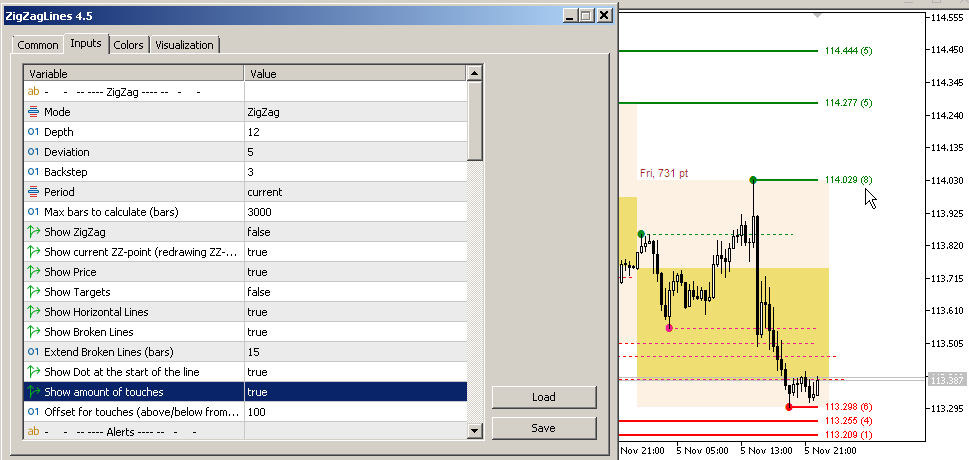
1) Added parameters for displaying the number of times the price touches the ZigZag point. (Show amount of touches, Offset for touches)
------------------------------------------------------------
ZigZag Lines MTF (обновление 4.50)
1) Добавлены параметры для отображения количества касаний ценой точки ЗигЗага. (Show amount of touches, Offset for touches)
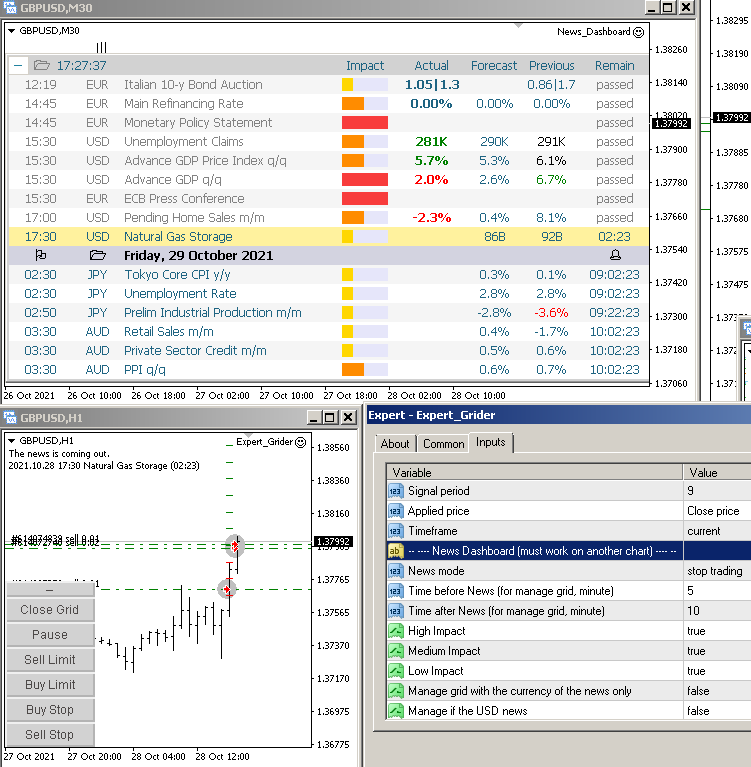
1) Added parameters for using news from "News Dashboard".
2) Separate parameters for opening the next steps (Next Steps).
------------------------------------------------------------
Easy Grider (обновление 4.20)
1) Добавлены параметры для использования новостей из "News Dashboard".
2) Отдельные параметры для открытия последующих шагов (Next Steps).
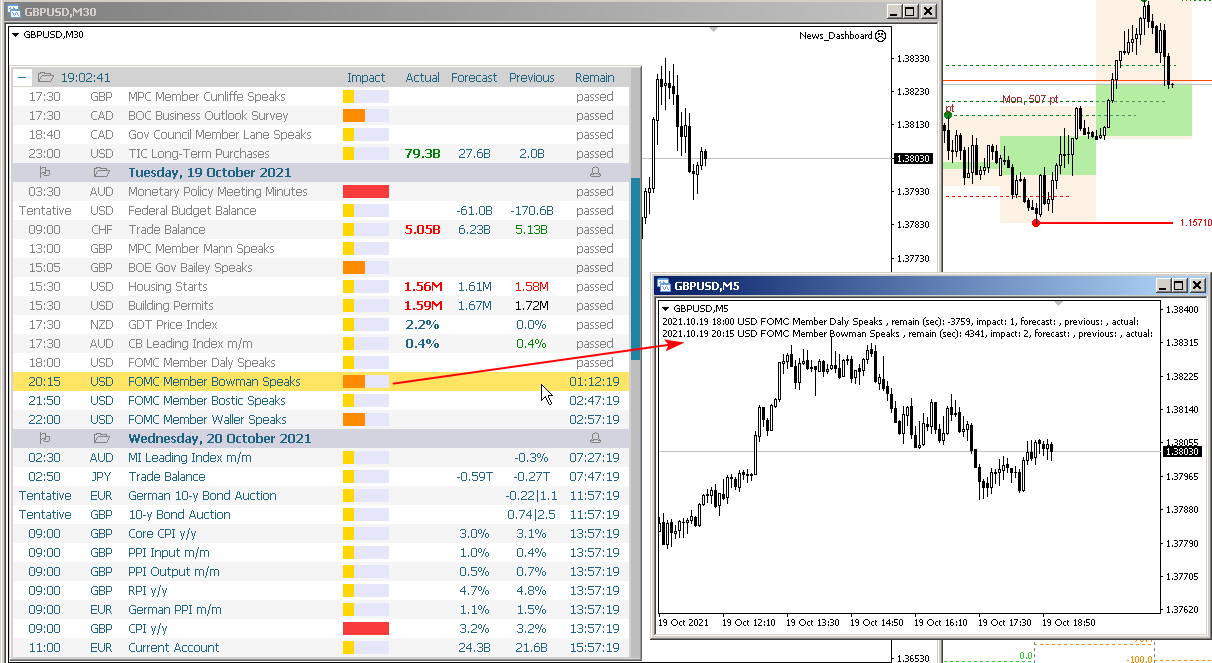
1) Now your EA (or indicator) can take news from the Dashboard. See the description in the comments.
--------------------------------------------------------------------------------------------------------
News Dashboard (обновление 2.90)
1) Теперь ваш ЕА (или индикатор) может брать новости из Дашбоард. Смотри описание в комментариях.
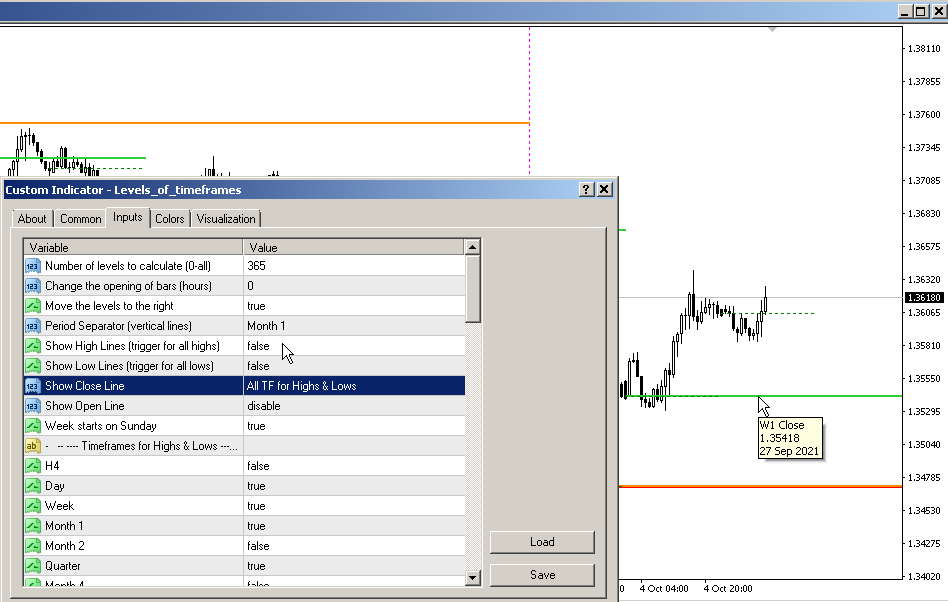
1) Added options to disable drawing of Highs/Lows levels. Now you can only see the Close levels.
2) Added the "All TF for Highs & Lows" option to draw Close/Open levels. You can now see these levels from many timeframes.
3) Added alerts when crossing the Close levels.
4) Fixed a bug with drawing Close levels on the current bar.
------------------------------------------------------------
Levels of Timeframes (2.60-2.70)
1) Добавлены параметры для отключения рисования уровней Хай/Лоу. Теперь вы можете видеть только уровни Закрытия.
2) Для рисования уровней Закрытия/Открытия добавлена опция "All TF for Highs & Lows". Теперь вы можете видеть эти уровни из многих таймфреймов.
3) Добавлены алерты при пересечении уровней Закрытия.
4) Исправлен баг рисования уровней Закрытия на текущем баре.
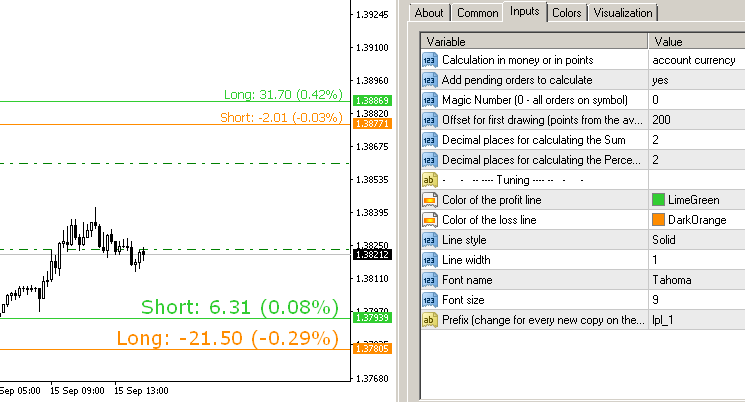
1) Added options for changing the font.
2) Added a prefix for the ability to run multiple copies on one chart.
3) Added line width.
------------------------------------------------------------
Lines Profit Loss (обновление 3.00)
1) Добавлены параметры для изменения шрифта.
2) Добавлен префикс для возможности запускать несколько копий на одном чарте.
3) Добавлена толщина линии.