Market Profile Singles indicator MT5
- 指标
- 版本: 4.0
- 更新: 6 二月 2022
- 激活: 5

MT4: https://www.mql5.com/en/market/product/52715
该指标基于市场概况理论。
单打区到底是什么?
理论:市场概况单打:
轮廓的单张或单张打印或间隙放置在轮廓结构的内部,而不是上边缘或下边缘。
它们以在市场资料上打印的单个TPO表示。
单身人士将我们的注意力吸引到价格快速波动(冲动)的地方。它们使低交易量的节点留有流动性缺口,从而导致市场失衡,并向我们展示了失衡的区域。通常,当市场对意外消息做出反应时,会创建单个。这些报告能够引起极端的失衡,并为买方和卖方的极端情绪反应做好准备。
市场将希望重新访问该区域,并检查这些价格水平是否不是对以这些价格进行交易感兴趣的交易者。这些商人为什么要在那里?因为市场从字面上飞过该地区,只有少数交易者有机会在该地区进行交易。为此,将来可能会填补这些领域。
这些低效的举动往往会被填补,一旦它们被填补,我们就可以寻找交易机会,或者我们也可以在它们被填补之前进入,并使用这些单张图作为目标。
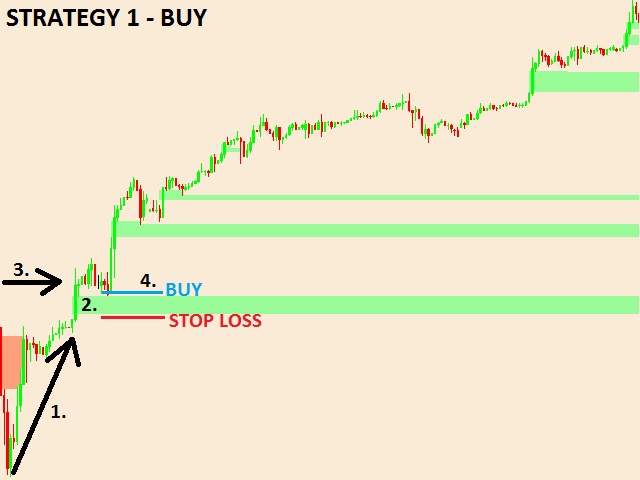
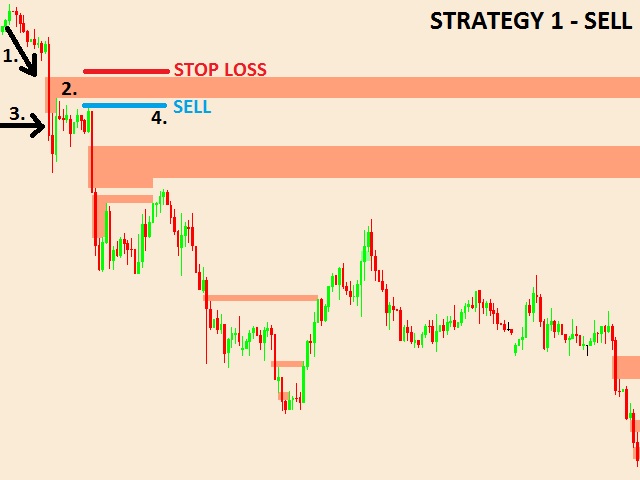
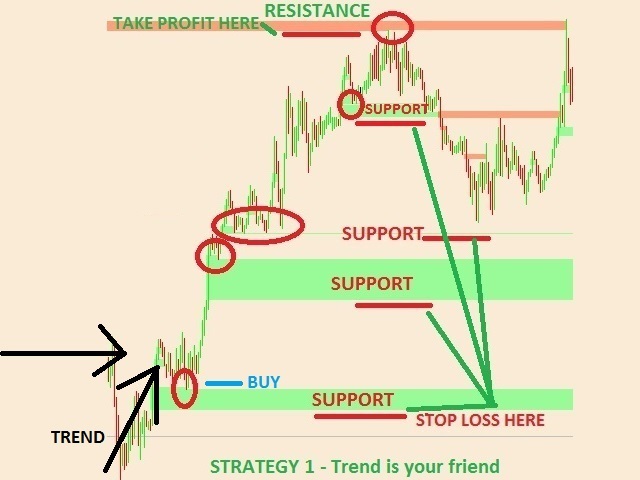
用作支撑/阻力区域,但并非总是要小心。通常,它在趋势日表现良好。请参阅市场概况日:趋势日(策略1-买入-第三张图)和具有双重分布的趋势日(策略1-卖出-第三张图)。
开始趋势日并增加利润是个好习惯
但请注意,趋势日只有15-20%的时间
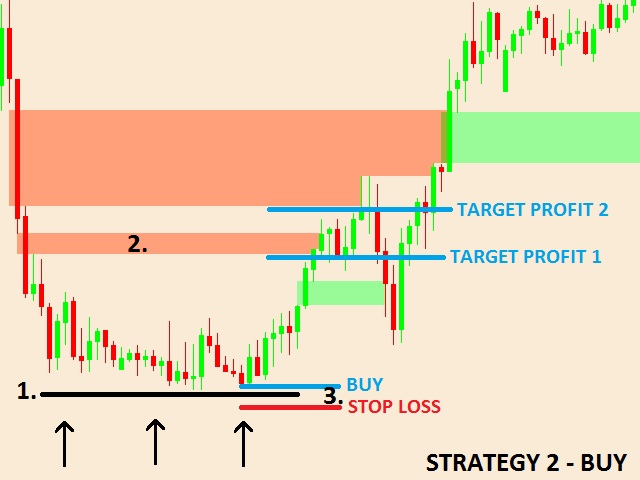
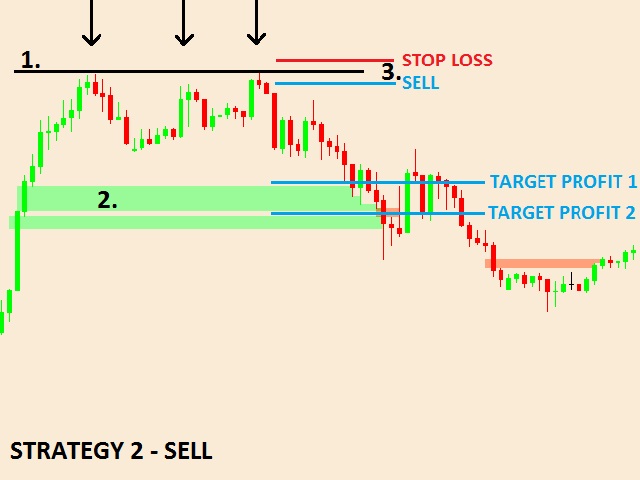
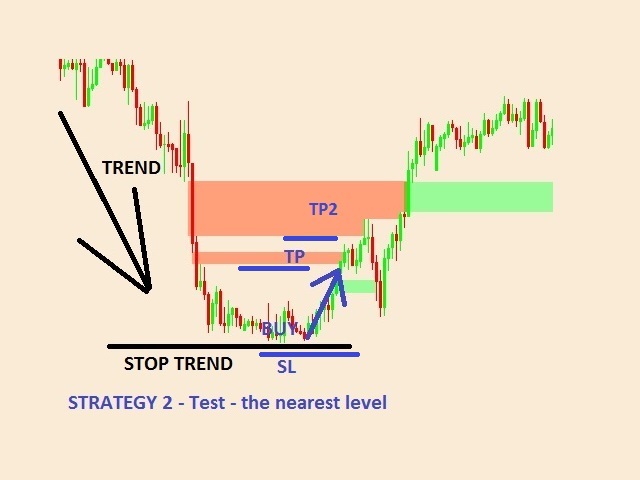
因此,我主要推荐策略2,这是75-80%的时间。
这些水平受到大型银行和银行的关注。该指标将向您显示这些级别。
请记住,将来将有80%以上的机会对这些区域进行测试。这把可能性放到了我们这边。
注意资金和风险管理。始终使用止损。最低存款准备金率3:1。每笔交易最高承担账户风险的0.5-1%。
我附上我自己交易的三种策略。
这三种策略在市场上都重复进行,因此最好对这三种策略进行交易。
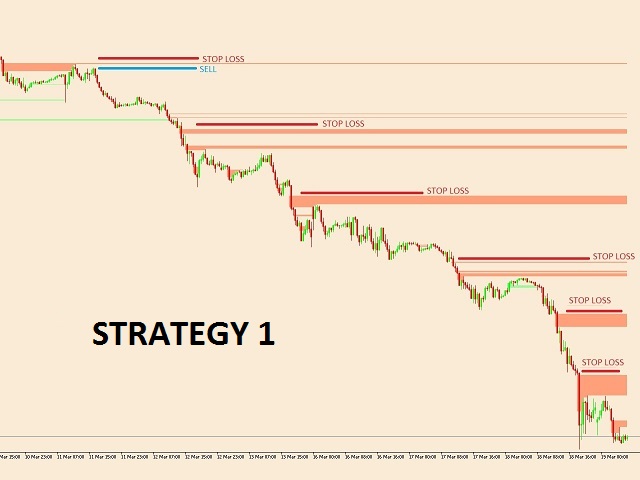
策略1:趋势是您的朋友
策略2:测试最近的水平
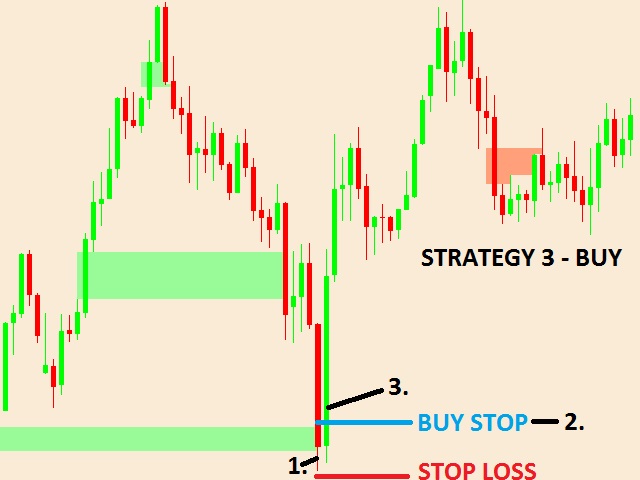
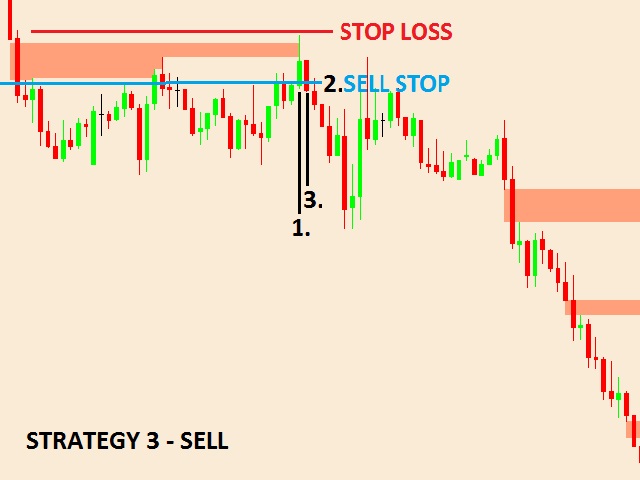
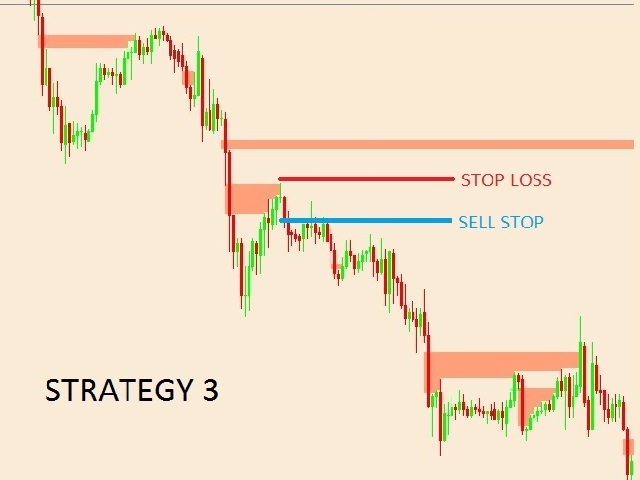
策略3:单身人士并保持趋势
建议的时间范围是M30,尤其是策略2。
有关策略和所有图片的完整说明,请点击此处。请研究一下。
购买该指标后,您将再获得2个指标。市场形态指标+支撑和阻力指标。
购买指标后,请给我写信:
购买日期,原产国。您可以免费获得该指标。


I am very satisfied with the indicator