Rigid Volume Profile MT4
- 指标
- 版本: 1.0
- 激活: 10

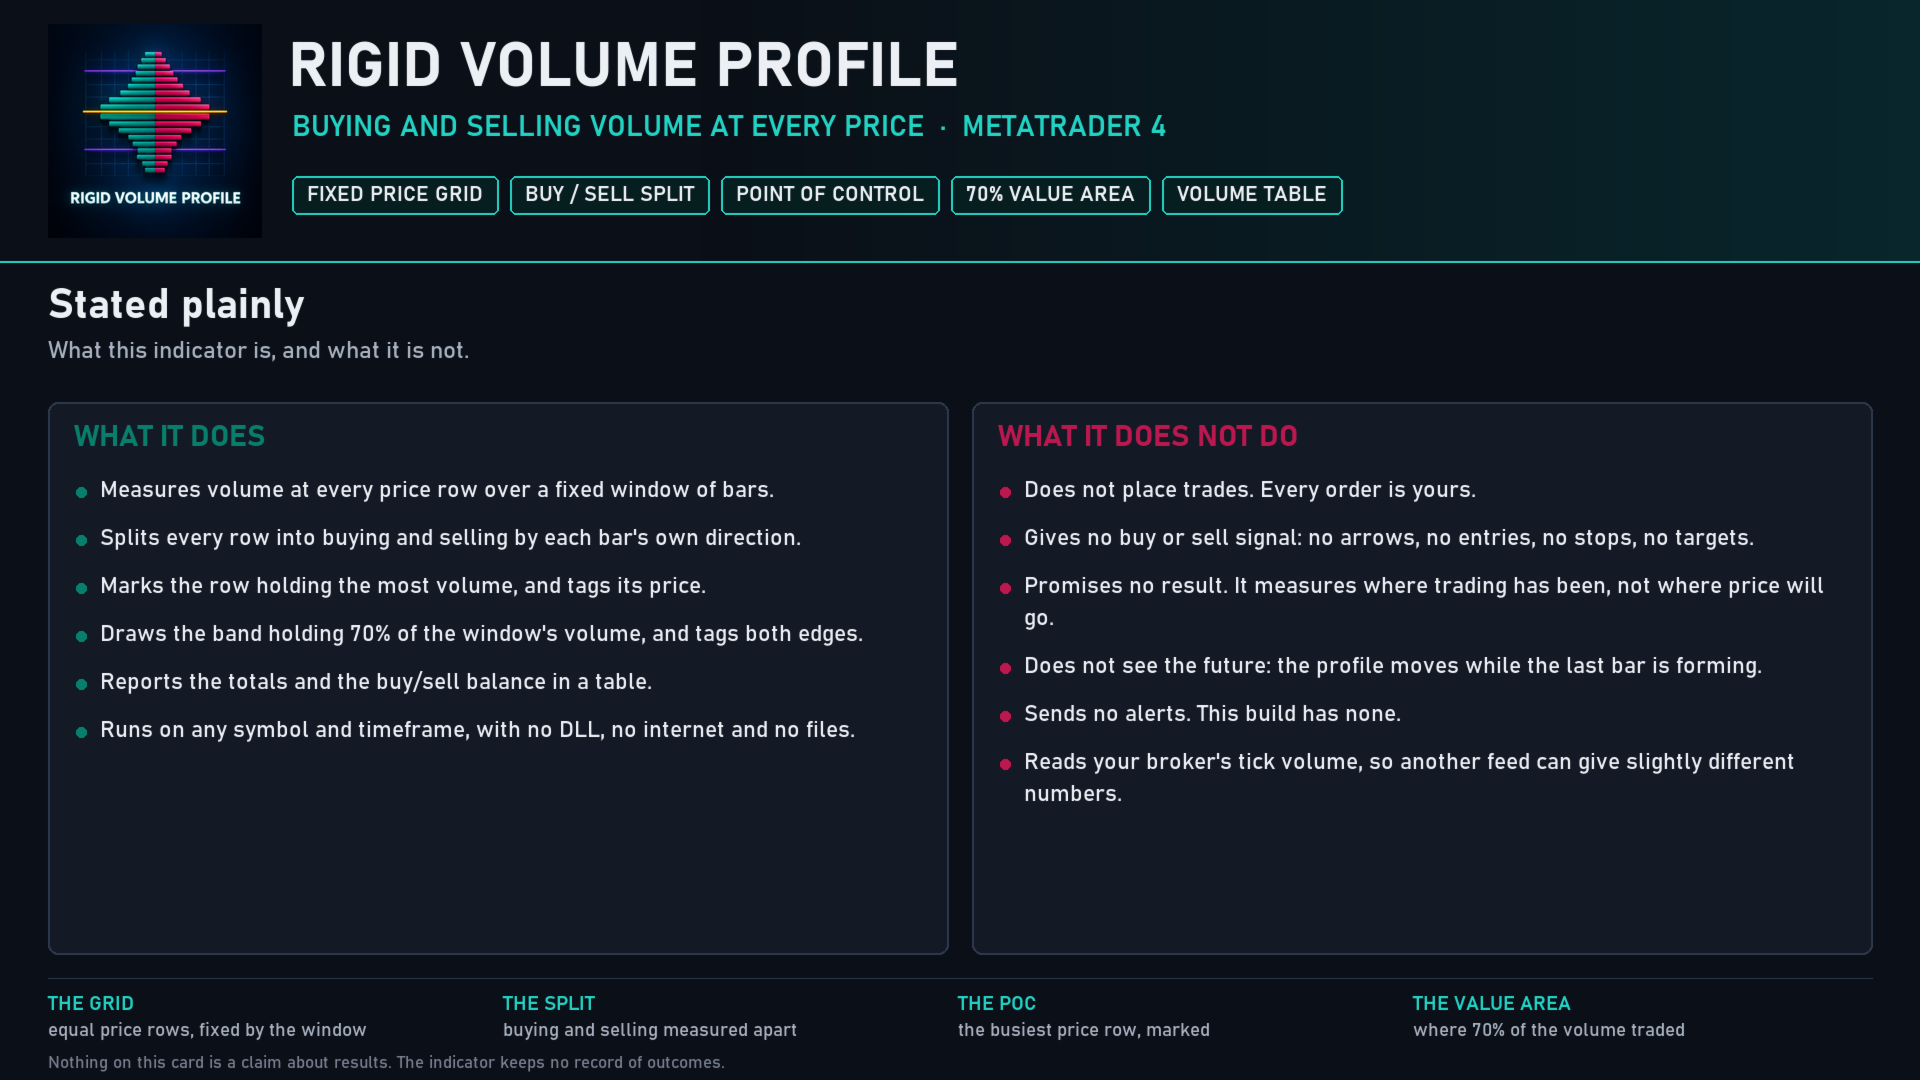
Rigid Volume Profile splits volume into buying and selling at every price level, instead of reporting one number per bar.
It takes the last 200 bars by default, cuts the range they covered into a fixed grid of 150 price rows, and walks every bar through every row its high-to-low range touched. Each row receives the share of that bar's volume matching how much of the bar sits inside it, and the whole share goes to one side: buying if the bar closed above its open, selling if it closed below, split evenly if the two are equal. The result is a horizontal profile beside the candles that shows not only where trading was heavy, but which side was doing it.
WHAT IT DRAWS
- A bar per price row, split into buying and selling volume, in one of three layouts: side by side, mirrored around the last bar, or stacked as one bar per side.
- The Point of Control, a dashed line through the row that holds the most volume, with its price on a tag.
- The value area: the smallest band of rows that together hold 70% of all the volume in the window. Its high and low are drawn and tagged with their prices.
- An optional delta mark beside each row where one side holds more than a set share of that row's volume, in its own colour for buying and for selling.
- A volume analysis table: total volume, buying volume with its percentage, selling volume with its percentage, and a sentiment reading of Bullish, Bearish or Neutral. It can sit in any of nine positions and at four sizes.
The profile is drawn as chart objects. On this platform the lines are opaque rather than translucent, and a dashed line renders only at width one, so a thick Point of Control line is solid. Both are platform rules, and both are listed in the manual.
HOW IT DECIDES
The grid is rigid, which is the point. The window's highest high and lowest low fix the top and bottom, the range between them is cut into 150 equal rows, and every row keeps that width however the volume falls. Rows do not move or resize to follow the data, so two charts at the same setting are directly comparable and the same price sits on the same row from one bar to the next.
A bar contributes to every row its high-to-low range overlapped, not only to the row holding its close, and each row gets the fraction of the bar that lies inside it. That share then goes entirely to one side: buying if the bar closed above its open, selling if it closed below, and halved between the two if open and close are equal.
The Point of Control is the row with the most total volume. Where two rows are exactly level, the lower one wins.
The value area is built by taking rows in order of volume, largest first, until 70% of the window's volume is accounted for, then reading off the highest and lowest prices among them.
Volume Filter hides rows holding less than a set percentage of the busiest row's volume, so a thin tail does not clutter the picture. At its default of 0.5% almost everything is kept; raising it leaves only the rows that matter.
WHAT IT DOES NOT DO
- It does not place trades, and it gives no buy or sell signal. It measures where volume traded and draws it.
- It does not promise a result. A Point of Control and a value area say where trading has already happened, not where price will go.
- It does not see the future. The profile is measured on the last bar on the chart and is rebuilt as that bar's volume changes, so it moves while the bar is forming and settles when the bar closes.
SETTINGS AND NOTES
- 27 inputs in 7 groups, each explained in the manual. It runs on any symbol and timeframe from M1 to monthly: forex, metals, indices and crypto.
- Profile Resolution sets the number of price rows, from 50 to 400. More rows mean finer price detail on the same range.
- Fixed Analysis Period sets how many bars the profile measures, from 50 to 2000. Use Visible Range instead measures whatever is on screen, capped by Max Visible Range Bars.
- From 167 rows the profile reaches its own drawing limit and the lowest-priced rows stop being drawn. This is reproduced deliberately, so the picture matches the specification it was built from rather than quietly showing more.
- Volume is your broker's tick volume on symbols where the feed reports no exchange volume, so another broker's feed can give a slightly different profile on the same chart.
- The Point of Control line and the three price tags sit past the last bar by design. Give the chart room on the right with the chart shift if you want them clear of the candles.
- MT4 Object Budget caps how many profile lines are drawn, for a terminal that limits them. It is off by default: this build was measured taking 120,000 chart objects, and the profile's own maximum is 1,203.
- No DLL, no internet access and no files: the indicator only reads the chart it is attached to.
Trading leveraged products carries a high level of risk and may not be suitable for all investors. Rigid Volume Profile is an analysis tool, not financial advice. Test it on a demo account first.