Trade Odds Pro
- 指标
- 版本: 1.13
- 激活: 10

Trade Odds Pro tells you, before you enter, how often the same trade reached Take Profit before Stop Loss in the history of your symbol.
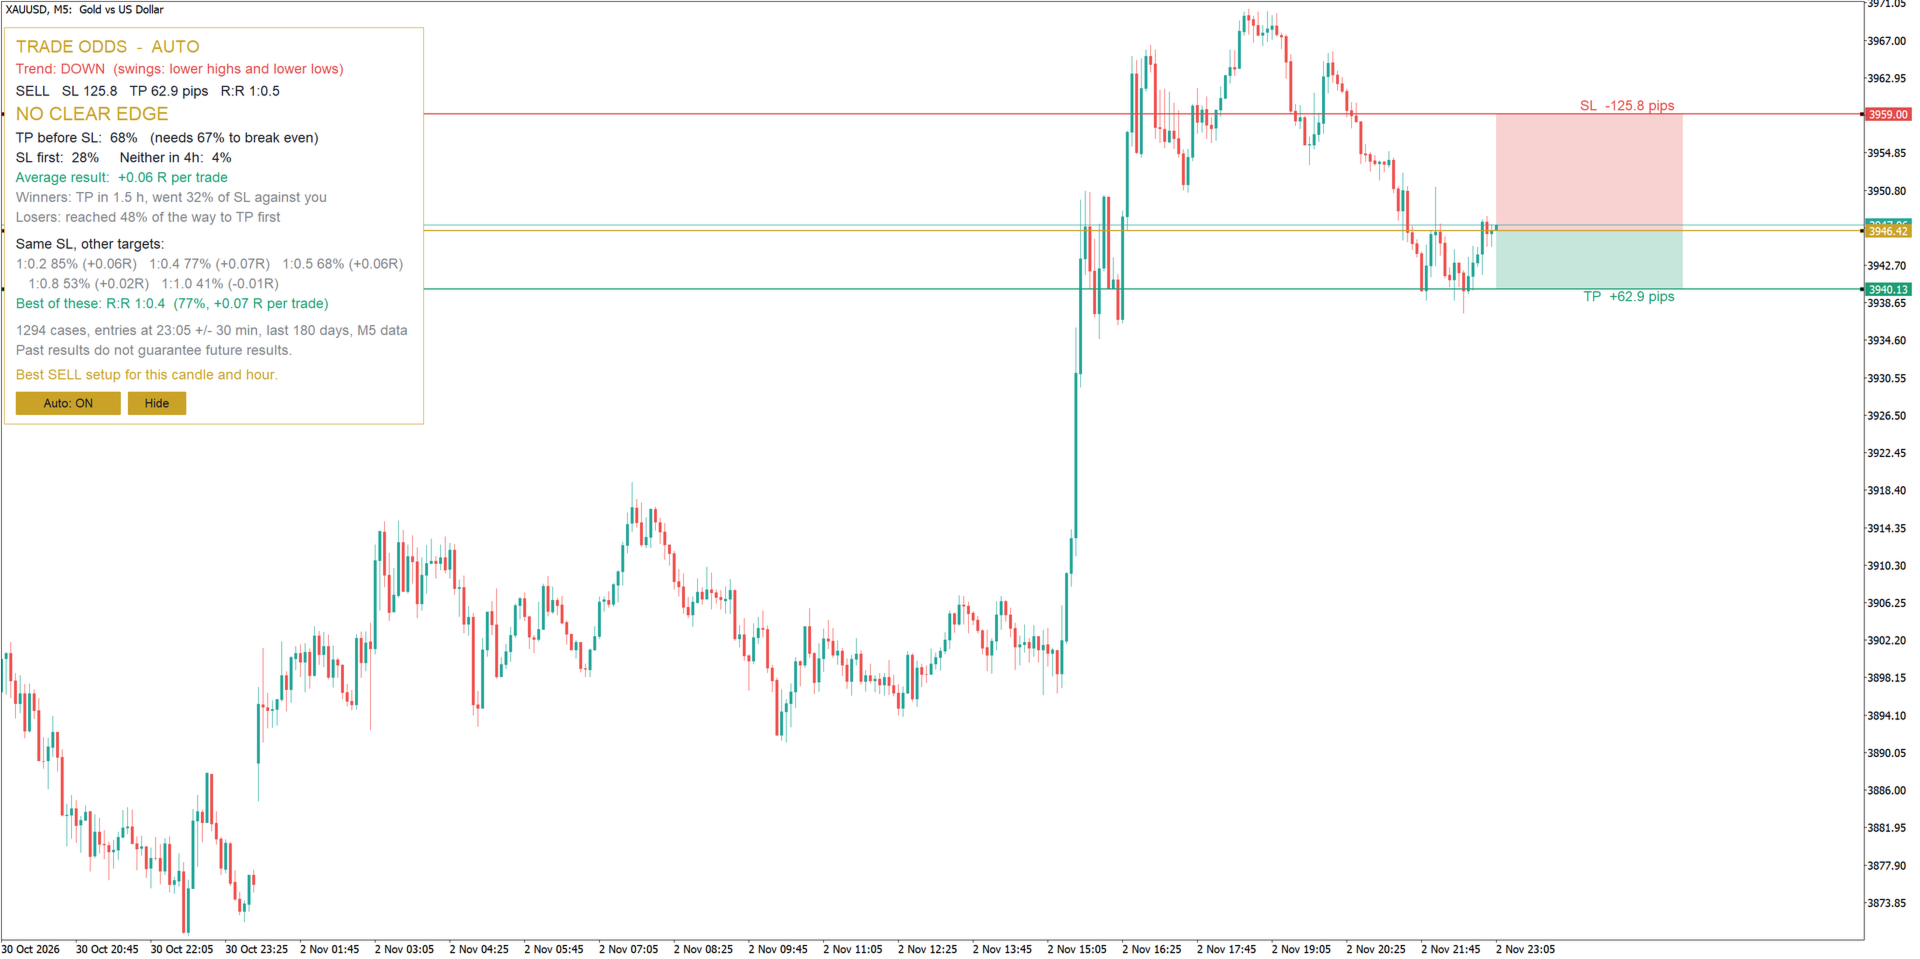
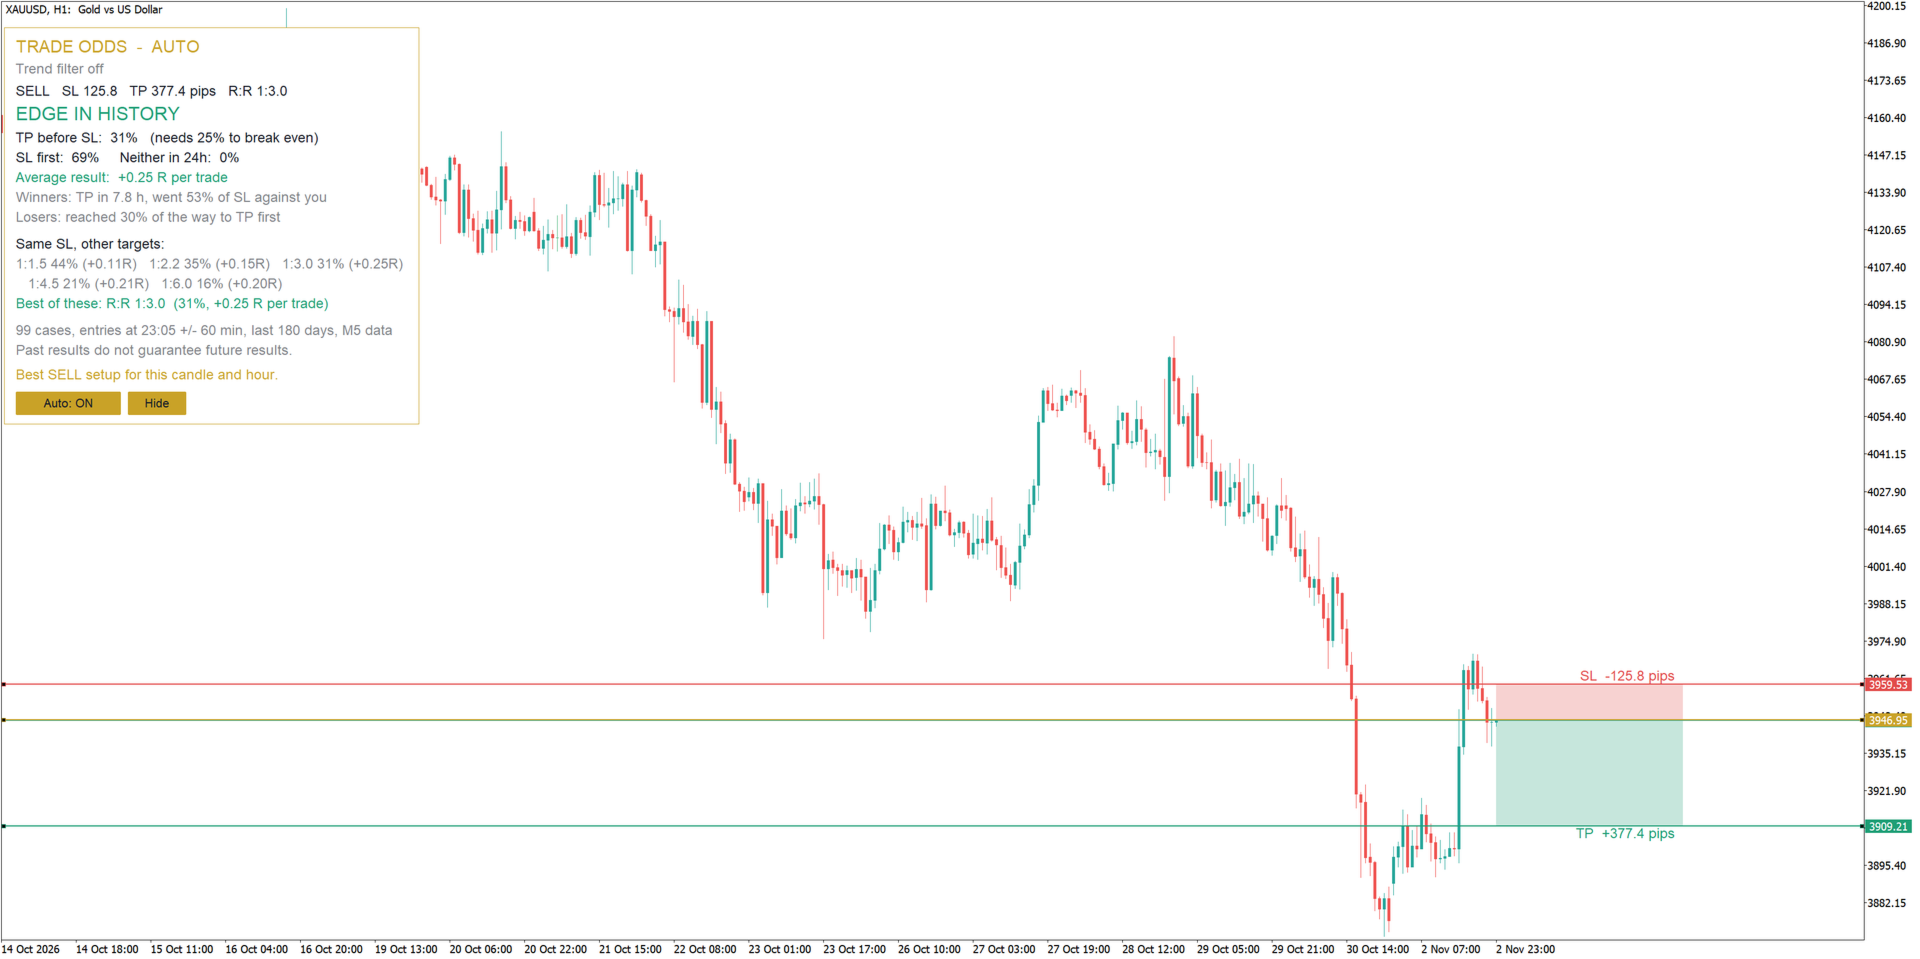
Every trader asks the same questions before a trade: is my stop too tight, is my target realistic, does this setup work at this time of day? Trade Odds Pro answers them with data instead of feeling. Place three lines on the chart - Entry, Stop Loss and Take Profit - and the indicator replays exactly this trade on hundreds or thousands of past entries at the same hour. The result appears instantly in a clear panel: win rate, break-even win rate, average result in R and a simple verdict.
In Auto mode Trade Odds Pro goes one step further. On every new candle it reads the trend, tests 36 combinations of stop size and risk to reward in the trend direction, and draws the setup with the best historical result directly on your chart.
WHAT YOU SEE IN THE PANEL
- Verdict: EDGE IN HISTORY, NO CLEAR EDGE, HISTORY IS AGAINST IT, or TOO FEW CASES when the sample is too small to trust.
- Take Profit before Stop Loss (%) compared with the win rate you need to break even at your risk to reward.
- Stop Loss first (%) and trades that reached neither level within the holding time.
- Average result in R per trade.
- Winners: average time to Take Profit and how far they moved against you first.
- Losers: how close they came to Take Profit before stopping out.
- What if: the same Stop Loss tested with five other targets, with the best one highlighted.
- Number of cases, time window, history length and data used, so you always know what the numbers are based on.
AUTO MODE AND TREND FILTER
- The best Buy or Sell setup is found and drawn automatically on every new candle. No buttons to press.
- Trades are suggested only in the direction of the trend.
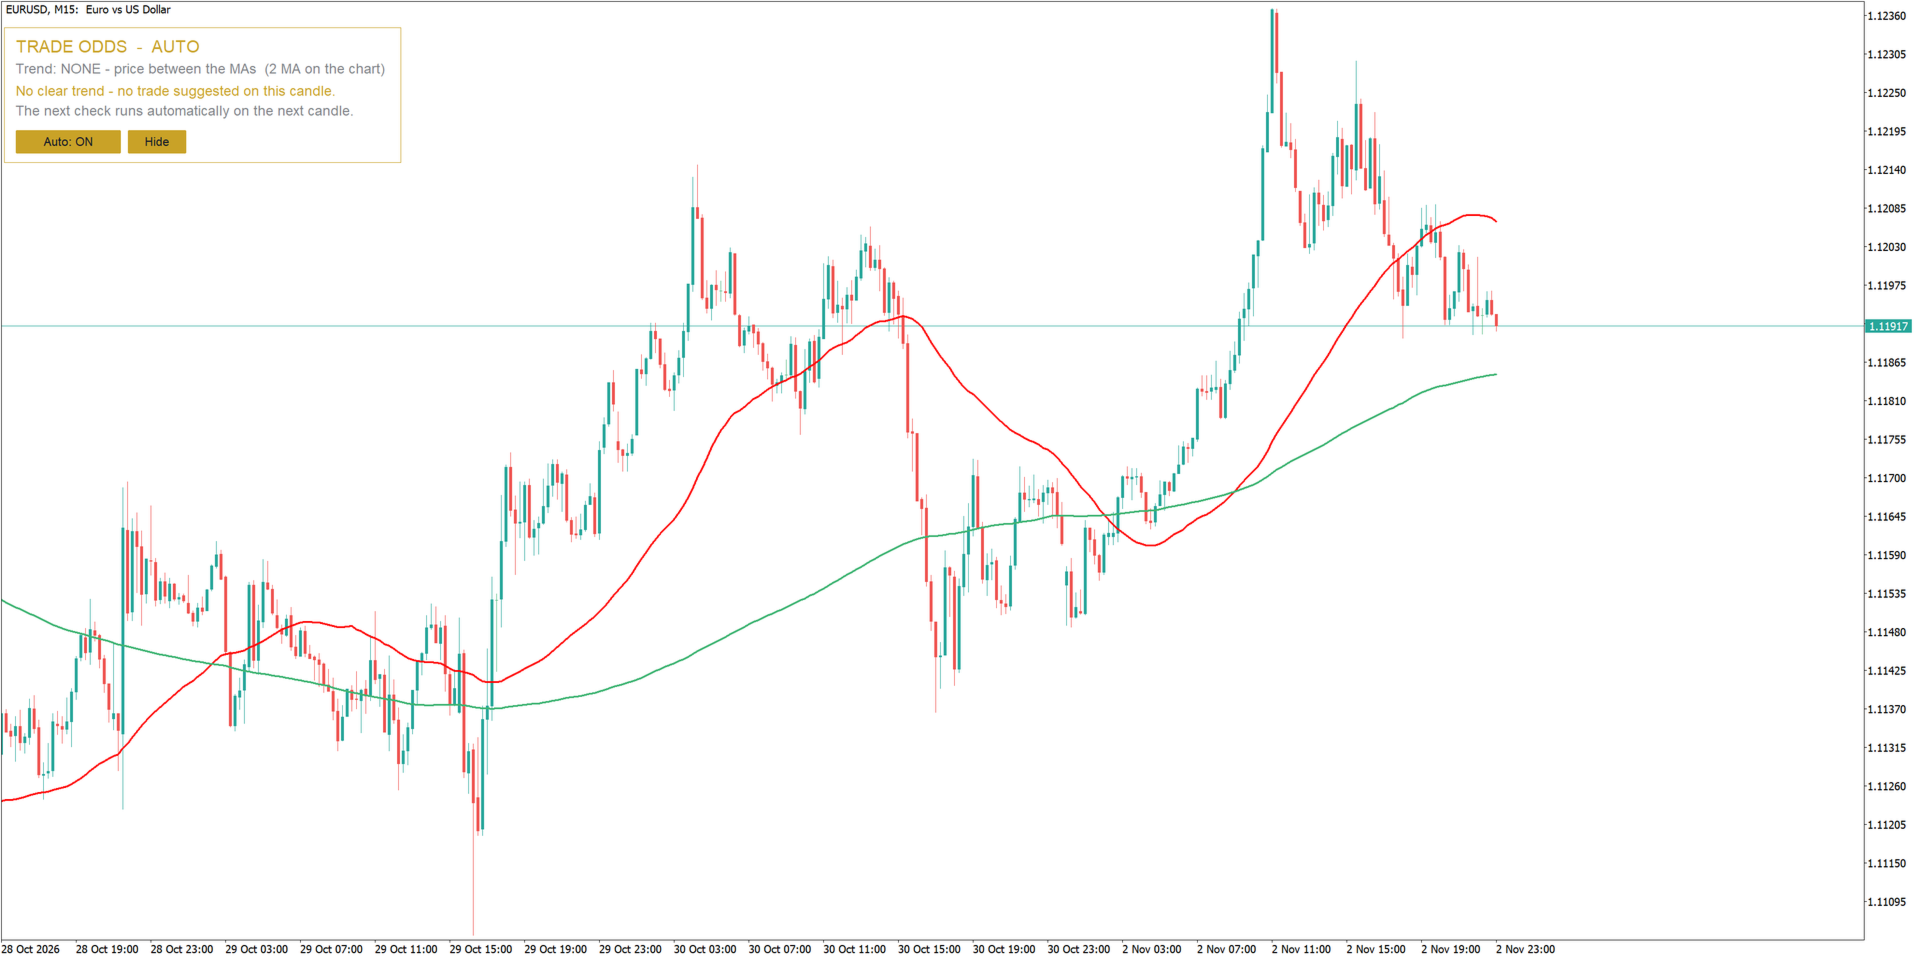
- The trend is read from the moving averages already on your chart - any period, any type. Use your own MAs and the indicator follows them.
- Without moving averages, the trend comes from market structure: higher highs and higher lows, or lower highs and lower lows.
- When the trend is unclear, no trade is suggested. The indicator simply waits for the next candle.
- The filter can be switched off to test both directions.
FULL MANUAL CONTROL
- Drag the Entry, Stop Loss or Take Profit line and the statistics update instantly.
- Drag the shaded Take Profit or Stop Loss zone to move the whole trade, or a corner to move one level.
- Stop Loss and Take Profit size in pips is shown next to the zones.
- Moving anything by hand pauses Auto mode; one click on "Auto: ON" brings it back.
- An open position with SL and TP on the symbol can be tested directly.
HOW THE TEST WORKS
For each past candle at the same time of day (+/- a time window) a virtual trade is opened with the same distances to Stop Loss and Take Profit as on your chart. The trade is followed candle by candle on M5 data (M1 on an M1 chart) until Take Profit or Stop Loss is reached, or until the maximum holding time ends. The current spread is included, weekend holds can be skipped, and when both levels are touched in the same candle the conservative assumption - Stop Loss first - is used by default.
History length, time window and holding time adapt automatically to the chart timeframe: from short scalps on M1 to trades lasting several days on H4. Every value can also be set manually.
RECOMMENDATIONS
- Symbols: forex pairs, gold (XAUUSD), indices.
- Timeframes: all; designed for intraday trading on M1 to H1.
- Works on any account type. No DLL, no external connections. The indicator never opens, modifies or closes trades.
INPUT PARAMETERS
History
- History to test in days - 0 = automatic for the timeframe (default 0).
- Which past entries to test - same time of day or any time of day (default: same time of day).
- Time window +/- in minutes - 0 = automatic (default 0).
- Maximum holding time in hours - 0 = automatic (default 0).
- Skip entries that would hold over the weekend (default true).
- When SL and TP are hit in the same bar - Stop Loss first or skip the case (default: Stop Loss first).
- Include the current spread (default true).
Lines
- Default SL distance, x ATR 14 (default 1.0).
- Default TP distance, x SL (default 2.0).
- Use SL/TP of an open position on this symbol (default true).
- Find the best SL/TP when the timeframe changes (default true).
Automatic setup
- Find the best setup automatically on every new candle (default true).
- Trend source - Auto (moving averages on the chart, otherwise swing highs and lows), Moving averages, Swing highs and lows, or No trend filter (default: Auto).
- Swing strength - bars on each side of a high or low (default 3).
- Bars to search for swing highs and lows (default 300).
Panel and colours
- Panel position from the right and from the top (default 12 / 30).
- Font size (default 9), panel background (default true), shaded zones (default true).
- Text, accent, positive and negative result colours; Entry, Stop Loss and Take Profit line colours.
Zones
- Take Profit and Stop Loss zone colours (default: from the line colours).
- Zone colour strength, 5-100 % (default 25).
- Zone length in bars to the right (default 25).