AMD OrderFlow Advance MT5
- 指标
- 版本: 1.0
- 激活: 15

Professional Overview: AMD MODEL PRO PLUS v4 + Uptrick Flow Expansion Trend (Combined)
Executive Summary
This is an institutional-grade trading indicator that merges two powerful methodologies into a single, dual-confirmation system:
· AMD Model Pro Plus v4 - ICT-style Power of 3 (PO3) session-based market structure analysis
· Uptrick Flow Expansion Trend - Adaptive flow midline with trend detection
The combination creates a system where macro session structure (AMD) aligns with micro price action momentum (FET) for high-probability trade signals, eliminating the need for multiple chart windows or separate indicator instances.
1. How Advanced Is It?
Technical Complexity Rating: 9.5/10
This is not a simple moving average crossover or RSI-based system. It represents a sophisticated synthesis of institutional trading concepts with adaptive algorithmic processing.
Core Advanced Components
Protected Swing Market Structure Shift (MSS) Detection - Unlike basic indicators that mark breakouts from simple swing points, this system uses fractal swing detection that identifies true protected levels. It doesn't just look at a candle's open price; it searches back up to 100 bars for a genuine swing high or low that represents real market structure. When price breaks that protected level, you get a legitimate MSS confirmation rather than a false breakout signal.
Kaufman Efficiency Ratio Integration - The FET component doesn't use static parameters. It continuously calculates market efficiency (the ratio of net movement to total movement) and dynamically adjusts its sensitivity. When markets are directional, the indicator becomes more responsive; when they're choppy, it filters out noise. This is the same principle used by institutional algo traders to adapt to changing market conditions.
Session-Adaptive Logic - This is perhaps the most sophisticated feature. The system doesn't blindly assume Asian = Accumulation, London = Manipulation, New York = Distribution. It actively monitors the Asian session range against a rolling 10-day average daily range. If Asia expands beyond 55% of normal daily volatility, the system automatically shifts roles: London becomes Accumulation, New York becomes Manipulation+Distribution. This adapts to real market behavior rather than forcing a rigid template.
Fair Value Gap (FVG) Retest Confirmation - Entry isn't triggered at the moment of MSS break. The system waits for price to retrace into the FVG (the three-candle imbalance) or a boundary zone. This mimics institutional entry techniques where smart money enters on retests rather than chasing breakouts. The zone is visually displayed so you can see exactly where you should be looking for entry.
Dual Entry Modes - You have two distinct ways to trade:
· Standard Confirmed Entry - Waits for displacement candle confirmation, FVG formation, and retracement into the zone. Lower risk, higher probability.
· Early Entry (Manipulation Reversal) - Optional higher-risk mode that enters immediately at MSS confirmation, skipping displacement and FVG retest requirements. Separate RR management keeps this isolated from your standard trades.
Economic Calendar Integration - The indicator doesn't just display news; it actively filters trading signals. It scans both base and quote currencies for events at or above your specified importance level, flags entries near news, and can even suppress alerts if you choose. This prevents you from getting caught in news-driven volatility that could invalidate your technical setup.
Protected vs Fallback MSS - When the system cannot find a genuine fractal swing point (which happens in fast markets), it intelligently falls back to using the sweep candle's open as the MSS level. This prevents the indicator from freezing when conditions are suboptimal, while clearly labeling the fallback so you know the confirmation is weaker.
2. Best Way to Trade This Indicator
Primary Strategy: New York Manipulation/Distribution Focus
The most reliable setups occur during the New York session when the market is completing the Power of 3 cycle. Here's how to approach it:
For Bullish Bias
Start by checking the previous two daily candles on the dashboard. If both D-1 and D-2 closed bullish, you have macro confirmation that buyers are in control. Next, verify that the FET Trend on the dashboard says "Bullish" with aqua-colored candles and an aqua flow midline. This confirms momentum aligns with your bias. Now locate the purple dashed MSS Level line on your chart. Your entire trade premise rests on price staying above this level.
Wait for price to sweep below the Asian or London low (depending on session mode). This is the Manipulation phase creating liquidity for institutions to buy. When price then breaks back above the protected swing level (the MSS), you have confirmation that manipulation has failed and distribution is beginning. Look for price to retrace into the FVG Entry Zone (khaki-colored box) or the boundary zone (silver box). When price touches this zone, a black arrow appears with "Enter Here (BUY)" and your entry is triggered. Place your stop loss at the MSS extreme with the buffer added, and set your take profit at 2x or 3x risk.
For Bearish Bias
The process is reversed. Both D-1 and D-2 should be bearish. FET Trend should read "Bearish" with magenta candles and flow line. The MSS Level line must remain intact - price should stay below it. Wait for price to sweep above Asian or London high (creating sell-side liquidity), then break back below the protected swing low to confirm MSS. Watch for price to retrace up into the FVG Entry Zone, where a black arrow appears with "Enter Here (SELL)". Place stop loss above the MSS extreme with buffer, and target 2x or 3x risk.
---
The MSS Level: Your Most Critical Reference Point
The Market Structure Shift level is the single most important element on your chart. It's drawn as a purple dashed or dash-dot line and labeled "MSS Level" or "MSS Level (fallback)" if a protected swing wasn't found.
How to Read the MSS
When the purple line appears, it marks the exact price level of the protected swing that was broken. For bullish setups, this is the swing high that price broke above - the level that now acts as support. For bearish setups, this is the swing low that price broke below - the level that now acts as resistance.
Why MSS Matters
If price stays on the correct side of the MSS level after the break, your trend continuation premise is valid. If price crosses back through the MSS level after your entry, the setup is invalidated. This is why the MSS level serves as your primary stop-loss anchor - it's the line between a valid trend continuation and a failed breakout.
---
How FET Confirms Your Trade Direction
The Flow Expansion Trend acts as your momentum filter, preventing you from trading against the prevailing flow.
Interpreting FET Signals
When the Adaptive Flow Midline is aqua and candles are the same color, upside momentum is confirmed. Only consider long positions in this environment. When the midline is magenta and candles match, downside momentum is confirmed. Only consider short positions. When the midline is yellow, the market is neutral or ranging - this is a waiting period where no trades should be taken.
Dashboard Metrics to Monitor
The FET Efficiency percentage tells you how directional the market is. Above 60% means strong trend development - ideal for momentum trades. Between 30% and 60% indicates a developing trend where you might wait for a breakout confirmation. Below 30% means compressed or ranging conditions - avoid trading until efficiency improves.
Flow Strength normalized against ATR shows you the velocity of price movement relative to volatility. Strong positive values confirm bullish momentum; strong negative values confirm bearish momentum. Weak values near zero suggest the trend lacks conviction.
The Bars Since Signal metric tells you how fresh the current trend is. A value of 1-5 bars means the signal just changed - this is prime entry territory. Values above 20 bars suggest the trend may be getting stale, and you should be more selective about entries.
---
3. Complete Trading Workflow
Step-by-Step Entry Process
Step 1: Check Daily Bias
Look at the dashboard's "Prev Day (D-1)" and "Prev Day (D-2)" readings. When both are bullish, you have macro confirmation for long bias. When both are bearish, short bias is confirmed. If they're mixed, wait for one more day of confirmation or accept a lower-probability setup.
Step 2: Verify FET Direction
The dashboard shows "FET Trend: Bullish/Bearish/Neutral" with corresponding colors. Your trade bias must match this reading. Never trade bullish when FET shows bearish, and vice versa. The system also shows you the Market State - if it says "Compressed," this is a warning that conditions aren't ideal for breakout trades.
Step 3: Locate MSS Level
Find the purple dashed line on your chart. For a bullish setup, price should be above this line. For bearish, price should be below it. If the MSS level has already been broken in the wrong direction, the setup is dead - move to the next trade opportunity.
Step 4: Wait for Manipulation Sweep
Watch price action carefully. You need to see a clear sweep of the Asian or London session high/low (depending on whether the system has shifted). This creates the liquidity grab that institutional traders use to enter positions. The Manipulation box on your chart will show you exactly where this range is.
Step 5: Confirm MSS Break
After the sweep, price must break back through the protected swing level. For bullish setups, this means a close above the MSS level. For bearish, a close below. The purple dashed line appears when this happens, and the phase changes to "DISTRIBUTION - awaiting retest" on your dashboard.
Step 6: Entry Trigger
Price must retrace into the Entry Zone. This is displayed as either a khaki-colored box (FVG) or a silver-colored box (boundary fallback). When price touches this zone, a black arrow appears with "Enter Here (BUY)" or "Enter Here (SELL)". The phase changes to "DISTRIBUTION - ENTRY TRIGGERED".
Step 7: Trade Management
Your Stop Loss is automatically drawn as a red dashed line at the MSS extreme plus your buffer. Your Take Profit is drawn as a black dashed line at your specified RR multiple. Alternatively, if you've enabled Early Entry, you'll see magenta dashed lines with separate SL/TP levels - these represent higher-risk, earlier entries that can capture larger moves.
---
4. Visual Guide to Chart Elements
AMD Model Components
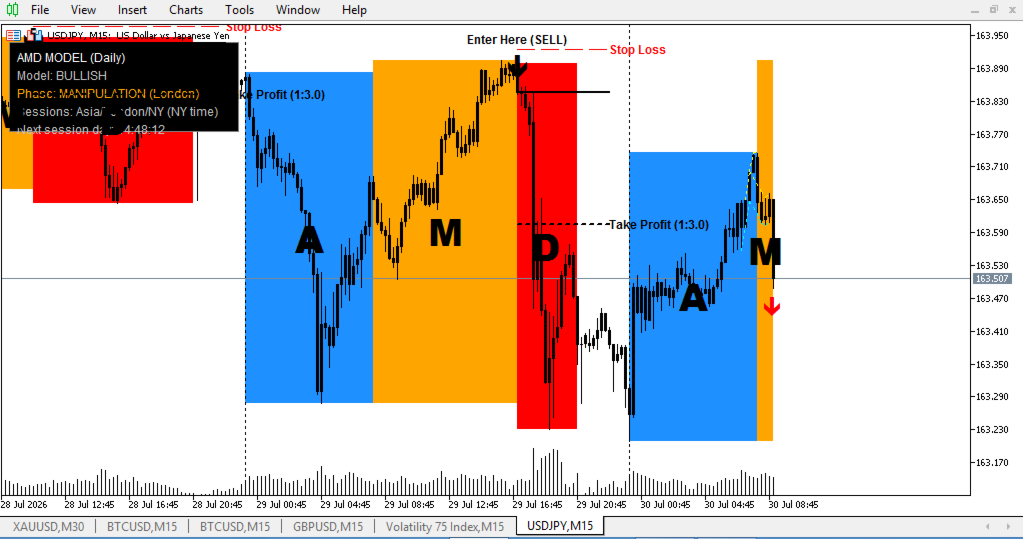
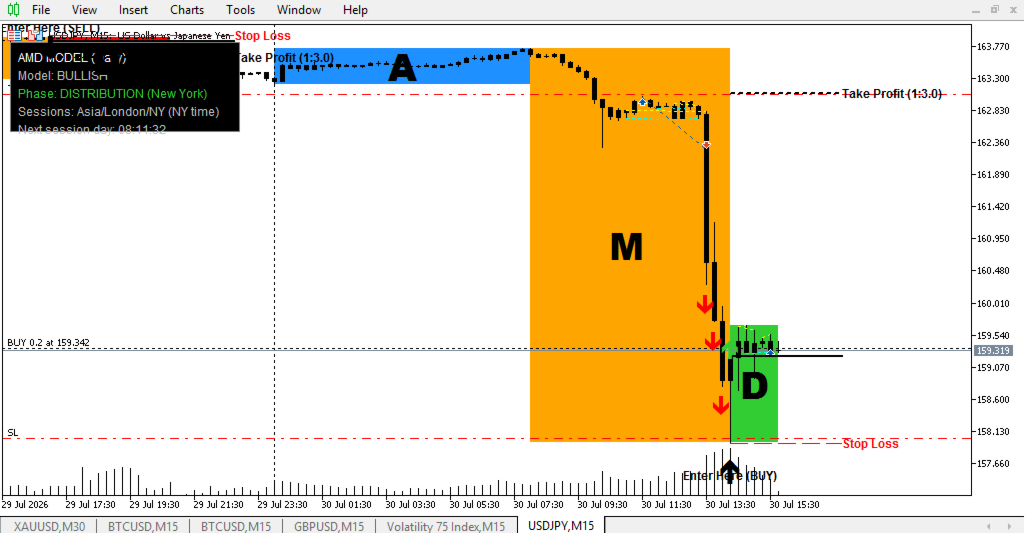
The Accumulation Box (A) appears as a DodgerBlue rectangle marking the initial session range - typically Asian session unless the system has shifted to London Accumulation. Inside this box, a bold "A" letter sits centered.
The Manipulation Box (M) appears as an Orange rectangle showing where the liquidity sweep occurred. This box extends from the sweep start to the MSS formation. A bold "M" letter sits centered inside.
The Distribution Box (D) appears as Green for bullish or Red for bearish, marking the confirmed trend phase. A bold "D" letter sits centered inside.
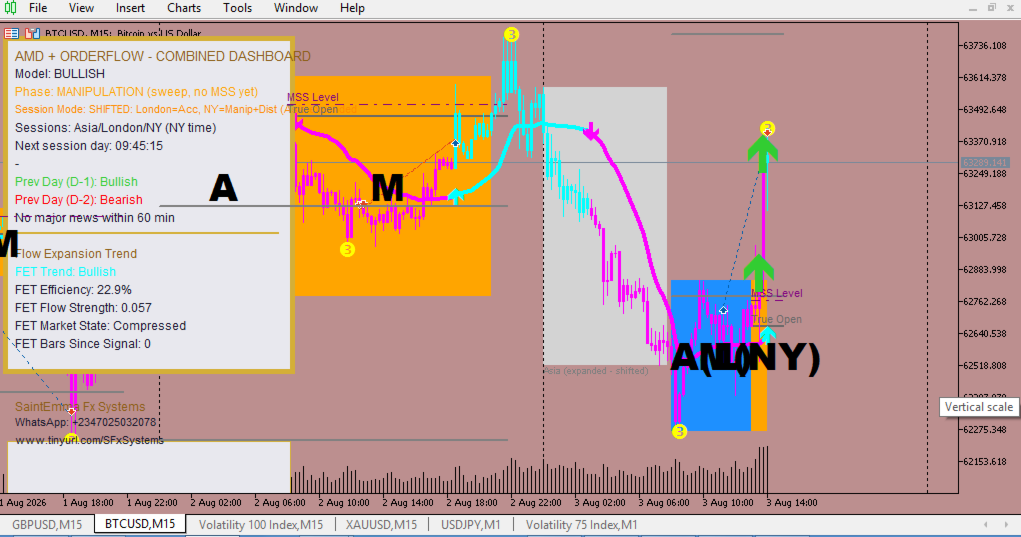
The MSS Level is a Purple dashed or dash-dot line extending forward from the MSS formation point, labeled "MSS Level" or "MSS Level (fallback)" when a protected swing wasn't found.
The Entry Zone appears as a Khaki box when an FVG was identified, or a Silver box when using the boundary fallback. It's labeled with the zone type and status (awaiting retest, filled, or invalidated).
The True Open Line is a DimGray solid line projecting forward from the Manipulation session's first bar open. This represents the session's starting reference point.
The Entry Arrow is a Black Arrow (width 6 for visibility) appearing at the entry time with "Enter Here (BUY/SELL)" text. The arrow is large and bold so you can clearly see the entry signal.
The Early Entry Arrow appears in Magenta with "MANIPULATION REVERSAL - EARLY ENTRY (BUY/SELL)" text when the optional early entry mode triggers.
The Stop Loss Line is Red and dashed, extending forward from the entry point. It's labeled "Stop Loss" with bold text.
The Take Profit Line is Black and dashed, extending forward from the entry point. It's labeled with the RR multiple.
The Invalidation Marker appears as Red text saying "SETUP INVALIDATED" when price hits the stop level before reaching the entry zone.
The Equal Highs/Equal Lows are Yellow dotted lines for EQH and Aqua dotted lines for EQL, connecting price levels that are within tolerance of each other. These represent liquidity levels.
The Previous Day High/Low appear as Gray dotted lines extending forward from the start of the session, labeled "PDH" and "PDL". These serve as additional liquidity targets.
FET Components
The Adaptive Flow Midline is a color-changing line that shifts between Aqua (bullish), Magenta (bearish), and Yellow (neutral). It's drawn with a 4-point width for clear visibility.
The Trend-Colored Candles match the midline color when enabled - Aqua for bullish, Magenta for bearish, Yellow for neutral. This makes trend direction immediately visible at a glance.
The Up Signals appear as Aqua arrows (width 6, bold) below price when a bullish trend reversal is detected.
The Down Signals appear as Magenta arrows (width 6, bold) above price when a bearish trend reversal is detected.
Dashboard Information (Upper-Left Corner)
The combined dashboard shows your complete trading picture at a glance. The top section displays the AMD Model bias, current phase, session mode, and a timer counting down to the next NY session day. The Entry Zone levels are displayed when available. If Early Entry is enabled, its status appears on its own line. The previous two days' candle colors are shown for macro context. Any news warnings appear with countdown timers.
Below the divider, the FET section shows the current trend, efficiency percentage, flow strength, market state, and bars since the last signal change. All metrics update in real-time.
Branding Footer (Lower-Left Corner)
A separate small panel displays the developer branding and contact information, keeping the main dashboard uncluttered while maintaining proper attribution.
---
5. Session Timing and Optimal Trading Windows
The indicator is calibrated to New York time, with the Asian session starting at 00:00 NY time, London at 08:00 NY time, and New York at 13:00 NY time. The New York session ends at 21:00 NY time.
New York Session (13:00-21:00 NY time) is your primary trading window. This is when Distribution occurs and the highest-probability setups form. The confluence of London and NY overlap (13:00-16:00 NY time) is particularly strong.
London Session (08:00-13:00 NY time) serves as the Manipulation phase. While you can trade during this session, the higher-probability entries come during NY. Use London to observe price action and position yourself for the NY move.
Asian Session (00:00-08:00 NY time) is typically Accumulation. This is generally a low-volatility period best suited for observation rather than trading. However, if the system detects Asian expansion, roles shift and you may see London become Accumulation with NY handling both Manipulation and Distribution.
---
6. Risk Parameters and Position Management
Stop Loss Placement
Your stop loss is automatically placed at the Manipulation extreme (the lowest low for bullish setups, the highest high for bearish setups) plus your buffer. This buffer (default 20 points) accounts for spread and normal price noise. The SL is drawn as a red dashed line and labeled clearly.
Take Profit Targeting
The standard confirmed entry uses your chosen RR multiple (default 3.0) from entry to stop loss. This gives you a clear 1:3 risk-reward profile. The early entry mode uses its own separate RR multiple (default 2.0) since the risk is higher due to earlier entry with less confirmation.
Invalidation Management
If price hits your stop loss before reaching the entry zone, the setup is marked as invalidated. The Entry Zone label changes to show "INVALIDATED" and the phase reflects this status. You should not re-enter the same setup once invalidated.
News Risk Management
When high-impact news is detected within your warning window (default 60 minutes), entries are flagged with "!! NEWS RISK - CAUTION !!" text near the entry point. You can choose to suppress alerts entirely when news is imminent, preventing notifications during high-risk periods.
---
7. Advanced Feature Deep Dive
Session Shifting: Adaptive Logic
The system continuously monitors whether the Asian session is consolidating or expanding. It compares the Asian range against the average daily range over the last 10 days. If Asia's range exceeds 55% of the average daily range, it's treated as expansion rather than consolidation.
When expansion is detected, the roles shift automatically. London becomes the new Accumulation phase, and New York handles both Manipulation and Distribution. This prevents the indicator from forcing a standard PO3 template onto a market that's behaving differently. The original Asian high and low are retained as an additional liquidity pool that New York can sweep, giving you even more potential entry points.
This adaptation is clearly displayed on the dashboard with "SHIFTED: London=Acc, NY=Manip+Dist (Asia expanded)" so you always know which model is active.
Early Entry Mode: Optional Higher-Risk Approach
When enabled, Early Entry gives you the option to trade the Manipulation reversal directly, before Distribution is fully confirmed. This mode doesn't wait for the displacement candle or FVG retest - it enters as soon as the MSS is confirmed.
The trade is managed separately from your standard entries. It has its own SL, TP, and RR multiple. The visual treatment is distinct - all early entry elements are in Magenta (arrows, lines, labels) so you can immediately distinguish them from standard confirmed entries.
This is designed for experienced traders comfortable with higher risk who want to capture larger moves. The tradeoff is clear: earlier entry means potentially better price but less confirmation, hence the smaller recommended RR ratio (1:2 vs 1:3).
Protected Swing vs Fallback MSS
The indicator prioritizes finding genuine fractal swing points - price levels where a clear swing high or low was formed over multiple bars. When such a level is found and broken, you get a "MSS Level" label indicating high-quality structure break.
However, markets aren't always clean. When no protected swing can be found within the search range, the system falls back to using the sweep candle's open price as the MSS level. This is labeled "MSS Level (fallback)" so you know the confirmation is weaker and should be treated with more caution.
This fallback mechanism prevents the indicator from failing to generate signals in fast-moving or irregular markets, while maintaining transparency about signal quality.
---
8. When to Trade and When to Wait
Ideal Trading Conditions
Take a trade when all three of your primary confirmations align: FET Trend matches your AMD bias, the previous two daily candles confirm your bias direction, the MSS level remains intact, and no high-impact news is imminent within 60 minutes. The entry should be a clean retest of the FVG or boundary zone with the arrow clearly visible.
Conditions That Warrant Caution
Be cautious when FET is neutral (yellow) indicating no clear momentum. Also be cautious when the daily candles are mixed (one bullish, one bearish) as this suggests market indecision at the macro level. The news warning flag is there for a reason - if it appears, seriously consider waiting until after the news passes.
Conditions to Skip Entirely
Skip trading when MSS has already been broken in the wrong direction. Skip when the market state shows "Compressed" (efficiency below 30%) as this indicates ranging conditions that often produce false breakouts. Skip when the entry zone is too far from current price or when price has already made a large move away from the zone without retesting.
---
9. What Makes This Indicator Unique
Institutional-Quality Structure Analysis - The protected swing MSS detection, FVG identification, and session-adaptive logic mirror the techniques used by professional institutional traders. This isn't retail-level technical analysis.
Dual Confirmation System - By combining AMD's macro structure analysis with FET's micro momentum detection, you get confirmation at two levels. Trades that pass both filters have significantly higher probability than those passing just one.
Complete Trade Management - The indicator doesn't just generate signals - it gives you entry levels, stop losses, take profits, and invalidation tracking. You have everything you need to manage a trade from start to finish.
Economic Awareness - The news filter integration is rare among MT5 indicators. Being able to see upcoming high-impact news and flag trades near it prevents you from getting caught in news-driven volatility.
Visual Clarity - With all arrows and key levels drawn at width 6, the signals are impossible to miss. The color coding is consistent and intuitive, and the dashboard puts all critical information in one place.
Adaptive Intelligence - The session shifting, protected swing fallback, and Kaufman efficiency integration mean the indicator adapts to changing market conditions rather than applying rigid rules to every situation.
---
10. Final Assessment
This indicator is best described as a comprehensive trading system rather than just a signal generator. It brings together institutional concepts like PO3, MSS, FVG, and protected swings with modern adaptive algorithms like Kaufman efficiency and session-shifting logic. The result is a tool that can serve as a standalone trading framework for traders who understand market structure.
The learning curve is substantial - this isn't an indicator you can plug in and trade blindly. You need to understand what the MSS represents, why the session roles matter, and how the FET confirmation filters signal quality. But for traders willing to invest that time, the payoff is a complete, professional-grade trading system that provides clear entries, defined risk, and integrated news awareness.
The separation of standard and early entries gives you flexibility in risk appetite. The dual confirmation from AMD and FET reduces false signals. The visual clarity ensures you never miss a key level or signal. And the adaptive components mean the system works across different market conditions rather than breaking down when volatility changes.
---
Trade the structure, confirm with momentum, manage with discipline.