TA Inspector

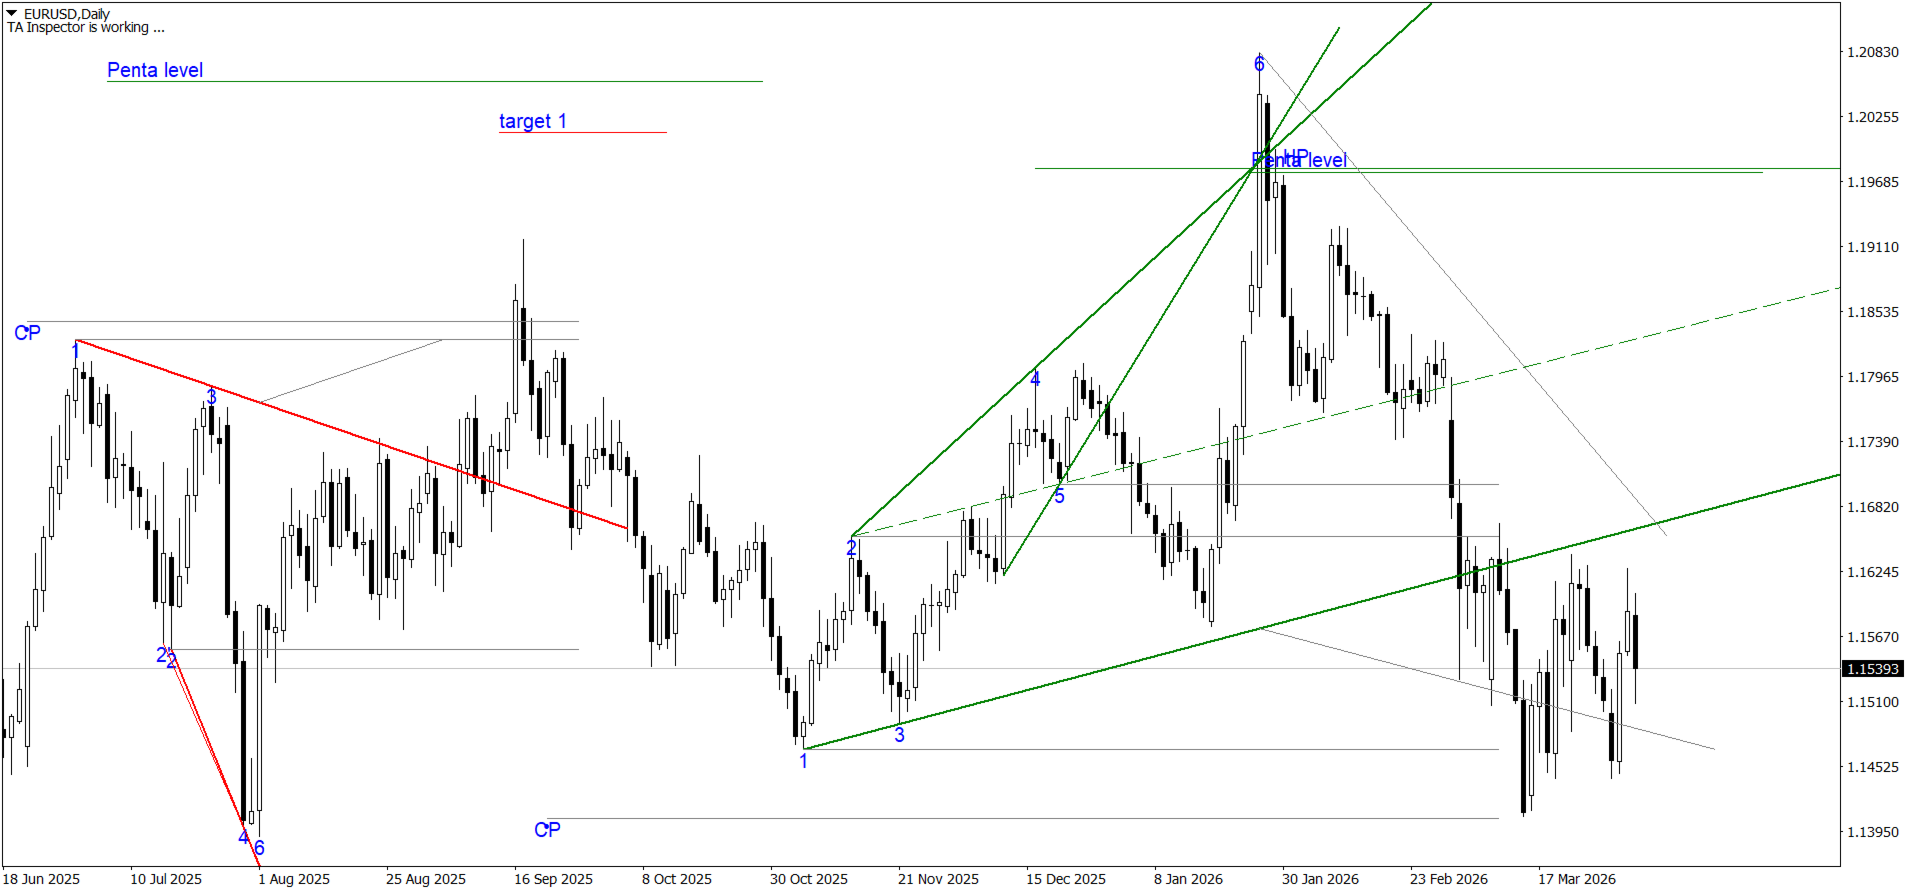
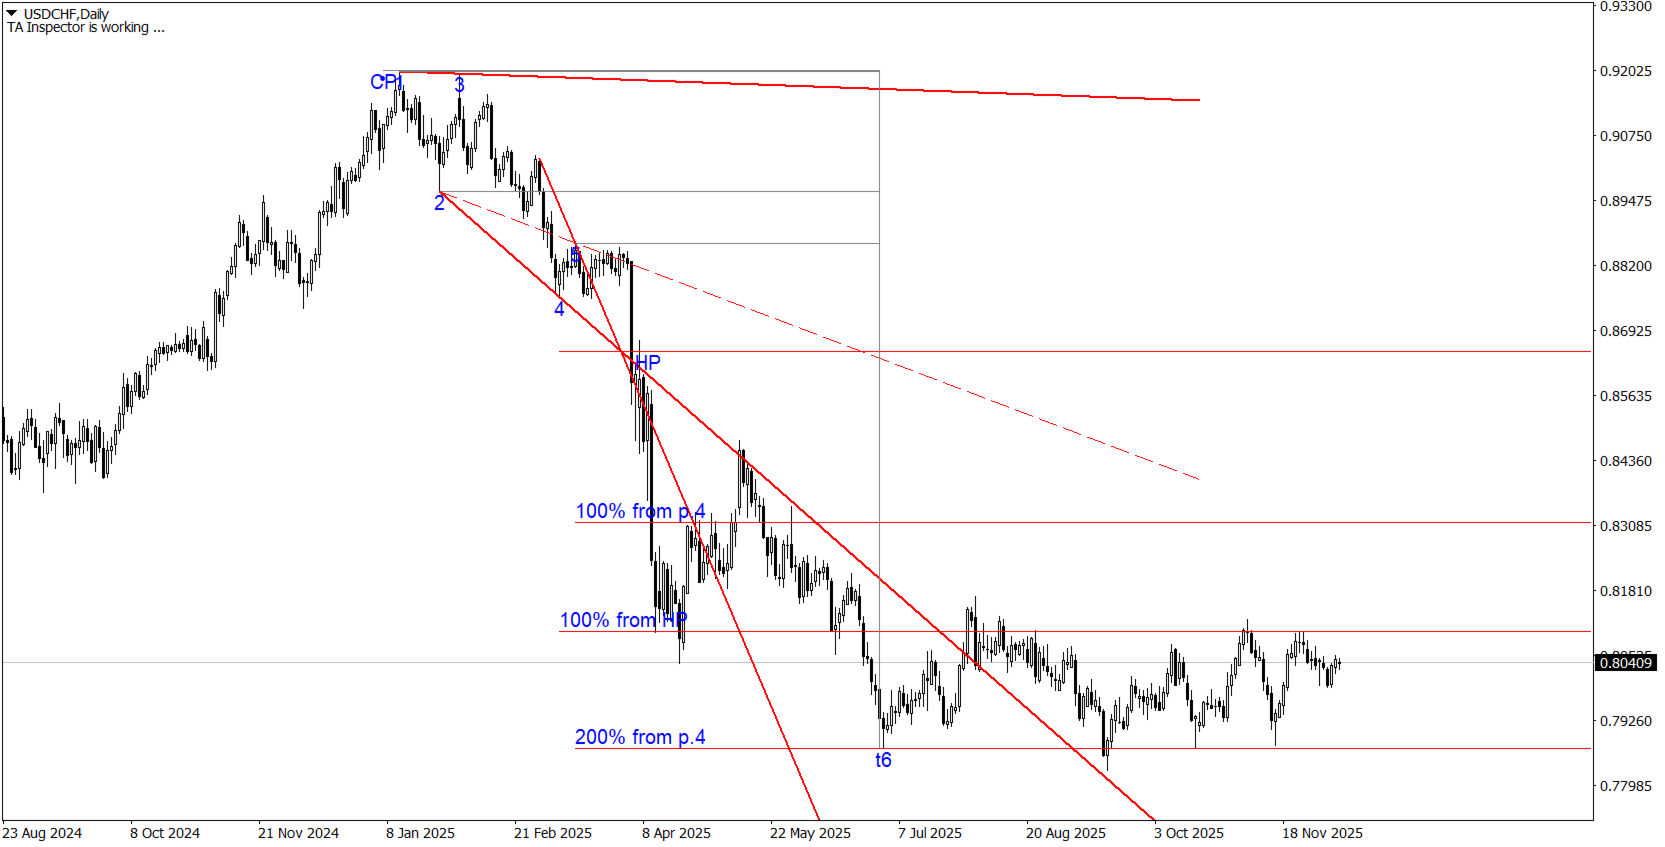
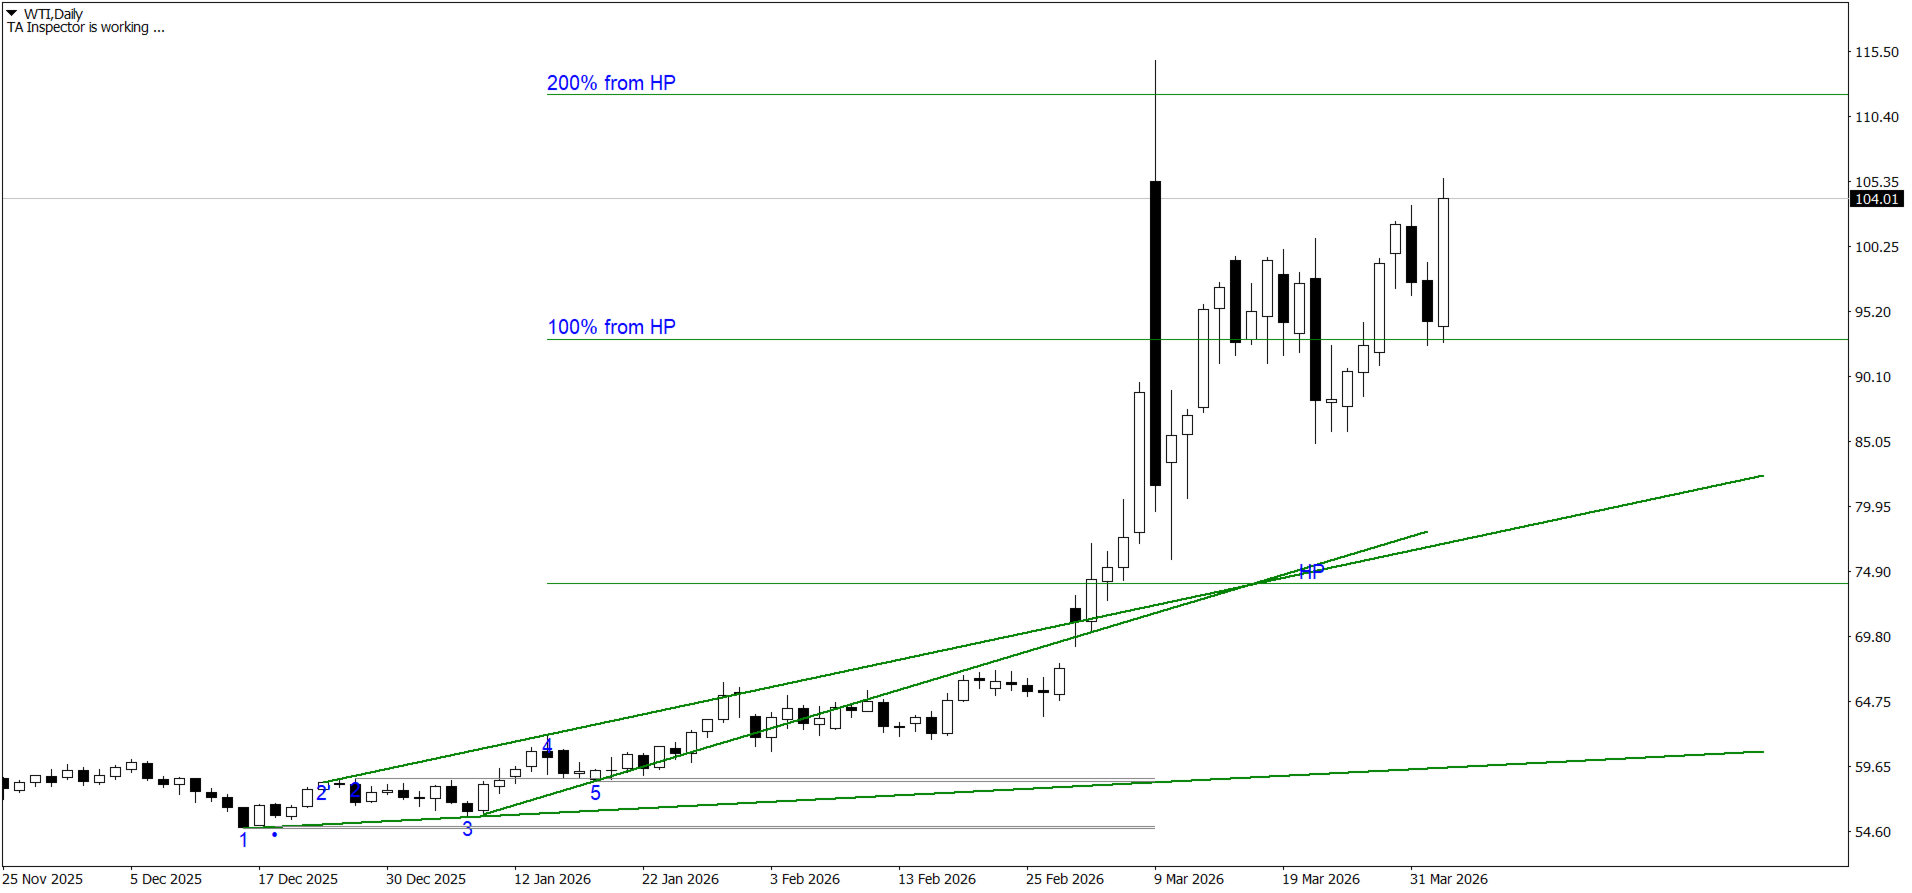
Индикатор TA Inspector - инструмент, который позволит улучшить анализ рынка и поможет определить дальнейшее движение цены на основе геометрических построений и ориентацию целей ценового развития. Индикатор производит самостоятельно построение трендовых линий и предполагаемого расчетного уровня окончания тренда (HP / Hypothetical Point). Индикатор выполняет автоматическое построения моделей метода Tactica Adversa.

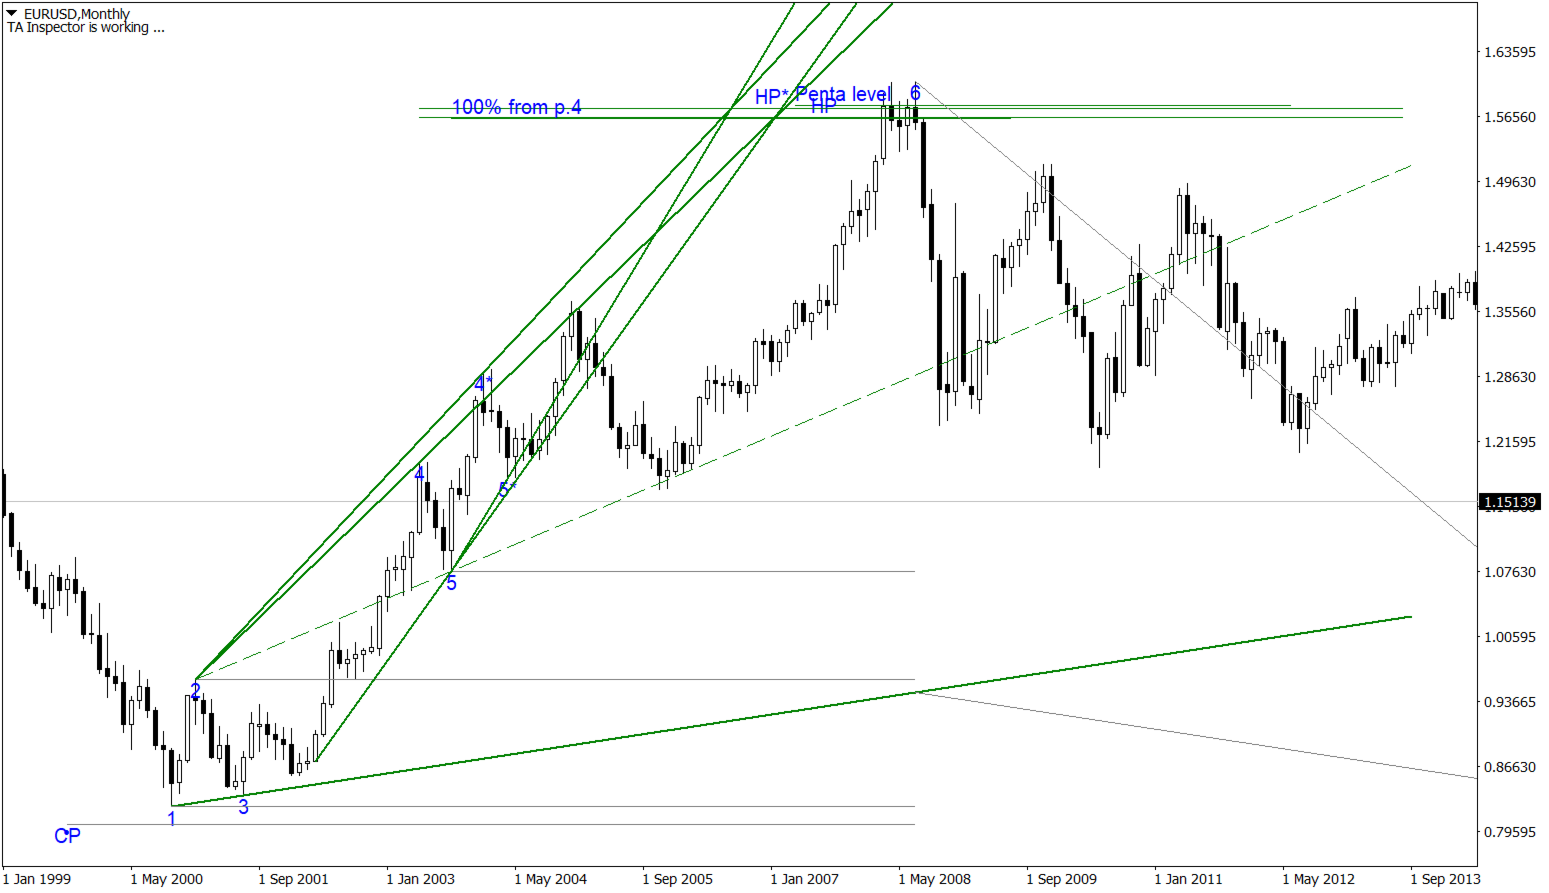
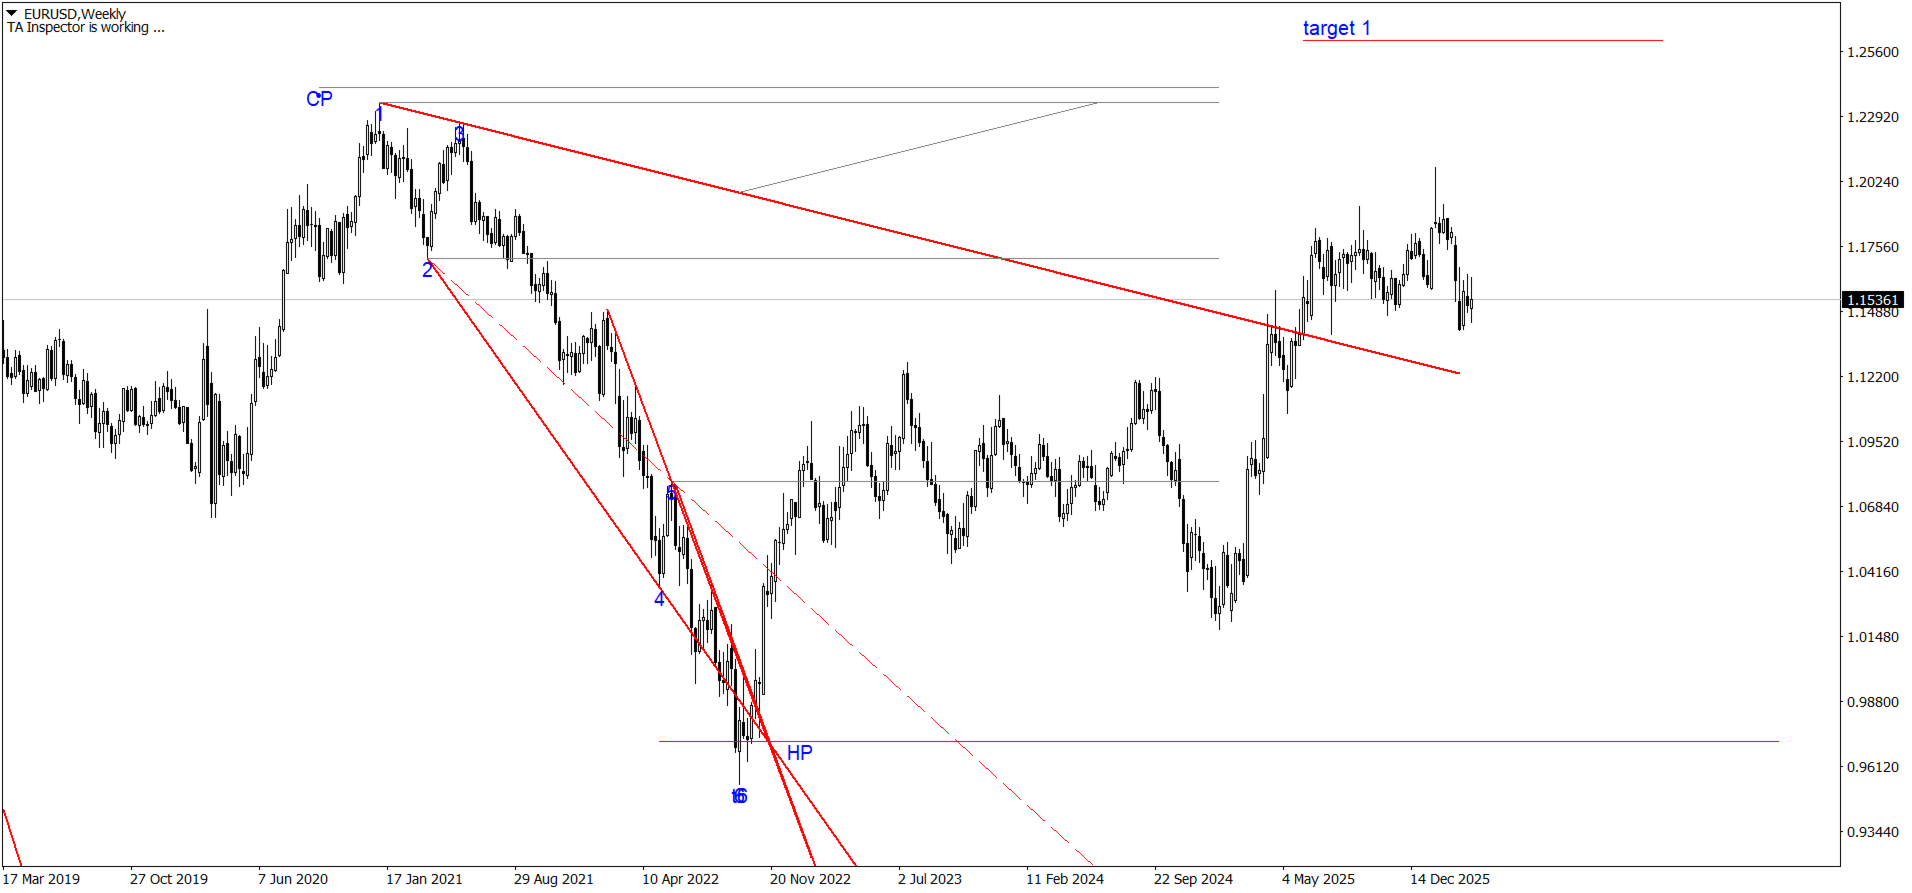
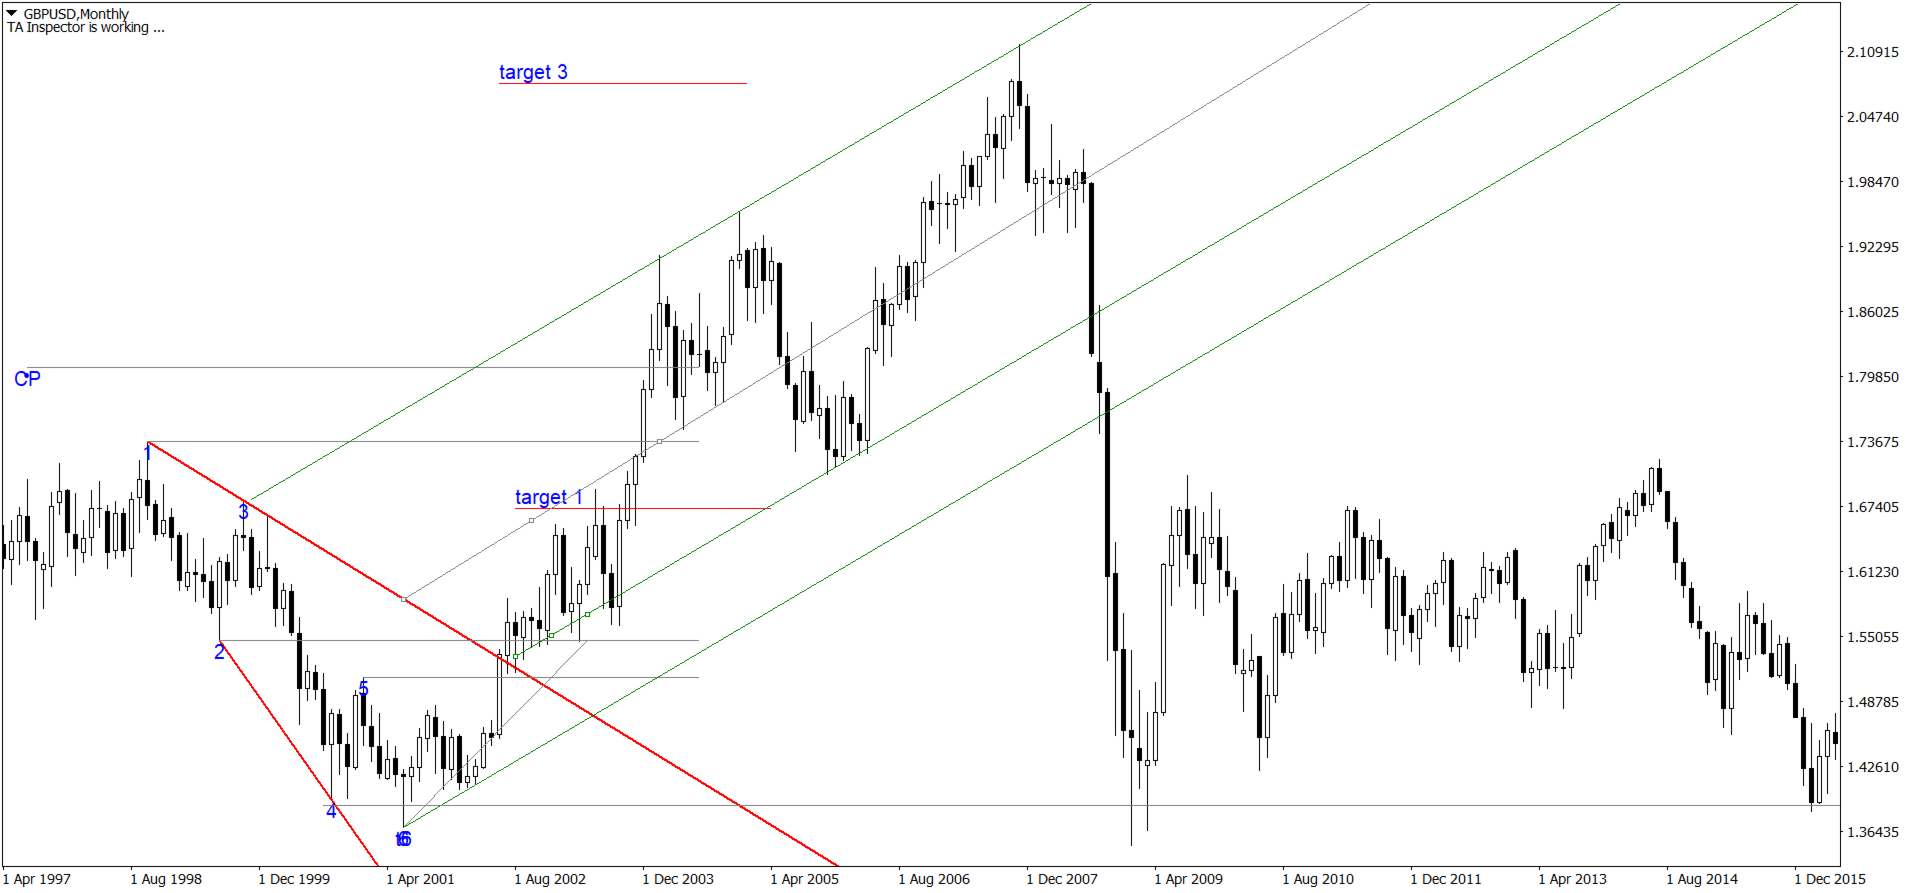
С точки зрения Tactica Adversa движение цены представляет собой последовательную смену Up - и Down – трендов. Каждый тренд описывается Моделью Расширения (МР). Данная модель формируется двумя расходящимися линиями – тренда и целей.

Построение основано на четырёх точках (экстремумах), следующих друг за другом. Последовательность выбора экстремумов для построения МР:

  • для down-тренда: high1 - low2 - high3 - low4 - high5 - low6
  • для up-тренда: low1 - high2 - low3 - high4 – low5 - high6

Таким образом,

  • 1 есть точка начала тренда, а 6 – его окончание;
  • линия целей строится от 2 к 4 и далее;
  • линия тренда строится от 1 к 3 и далее;
  • до формирования 6 точки на выше указанных линиях не может быть более двух точек (причём именно и только тех, через которые эти линии построены!);
  • расчёт первой цели делается от места пробития тренда. Пробитием тренда считается даже однопунктовое касание его ценой.

В случае пробития трендовой Модели Расширения возможна отработка трёх целей:

  • 1 цель – расстояние от шестой точки до точки пробития трендовой, oтложенное в сторону пробития;
  • 3 цель – расстояние от четвёртой точки до первой, отложенное в сторону первой точки;
  • 5 цель - расстояние от точки шесть до сакральной точки (CT), отложенное в противоположную сторону от точки 6.

Действие (т.е. последовательное достижение трёх целей) сформированной МР может быть отменено:

  • если цена после пробития линии тренда достигает 6 точки раньше, чем первой цели;
  • если цена после пробития линии тренда достигает первой цели за время меньшее, чем было затрачено на движение от 6 точки до линии тренда;
  • если в период движения цены от 6 точки к первой цели будет сформирована новая модель.

Отношение расстояния от СТ до 1 к расстоянию от 1 до 3 показывает нам Силу тренда. Если СТ-1 меньше 1-3, то тренд сильный, если СТ-1 больше 1-3 – слабый. Для отмен: модель со слабой линией тренда отменяет предыдущую (только если последняя полностью сформирована!), с сильной – подтверждает.

Ещё одним применением СТ является определение Смены тренда.

Как мы знаем, модели чередуются. Каждая последующая модель, описывающая тренд, сменяет тренд предыдущий. Но это происходит лишь в том случае, когда СТ модели попадает в промежуток между точками 4-6 предыдущей модели.

Одна из стратегий основанная на построении индикатора показана на видео.


Индикатор поддерживает функцию push-уведомлений.


Настройки

  • ShowAllModels - показывать все модели без ограничений, по умолчанию true
  • Point22Shift - количество баров отклонения точки 2* от экстремумов точки 1 и точки 2,  по умолчанию 4
  • TARestriction - количество баров от текущего в прошлое, где будет происходить поиск трендовых линий и моделейпо умолчанию 1500
  • Base13 - максимальное количества баров между точкой 1 и точкой 3 (база), через которые будет построена трендовая линияпо умолчанию 50
  • Point3ToPoint1 - порядок дополнительного экстремума между точкой 1 и точкой 3по умолчанию 5
  • ExteremumToPoint3 - что использовать для сравнения: если true, то использовать Close точки 3, иначе (false) Low для Up и High для Down для сравнения с дополнительным экстремумом между точками 1 и 3, по умолчанию false
  • AbsolutenessPoint3 - если > 0, то проверяем экстремумы между 1 и 3 с заданным порядком, по умолчанию 2
  • AbsolutenessPoint3Count - rоличество допустимых дополнительных экстремумов между 1 и 3, по умолчанию 1

  • CanRestoreModels - cохранение моделей для восстановления после перезапуска терминала, по умолчанию false
  • EnableBreakOutTrendPush - отключение push-уведомлений, по умолчанию включены.
  • BreakOutPushPrefix - префикс для сообщений в push-уведомлениях, по умолчанию "TA"
  • ShowPointLevels - показывать уровни экстремумов по цене, по умолчанию true
  • Show100Proc4 -  если true - постоянная демонстрация 100% от точки 4, если false - демонстрация 100% от т4 ограниченная пробоем трендовой линии, по умолчанию true
  • UpTrendColor - цвет линии up тренда, по умолчанию Green
  • DownTrendColor - цвет линии down тренда, по умолчанию Red
  • ChildTrendColor - цвет линии тренда, по умолчанию DarkOrange
  • MirrorColor - цвет дополнительных линий, по умолчанию Gray
  • LabelColor - цвет текстапо умолчанию Blue
  • LabelSize - размер текста, по умолчанию 10
  • LabelFont - шрифтпо умолчанию "Arial"
  • TextShift - отступ текстапо умолчанию 1


推荐产品
Revolutionize Your Trading with This Powerful Indicator-Based System Are you struggling to find accurate entry and exit points in trading? Do you want a proven, indicator-driven system that helps you maximize profits and minimize risks ? Introducing our Advanced Trading System —a powerful, easy-to-use technical analysis tool designed for forex, stocks, and crypto traders . Key Features & Benefits: Precision Buy & Sell Signals – Our system generates crystal-clear buy (green) and sell (red
This Indicator is use the ZigZag to calculate the Upper and  Lower Bound and the uptrend and the downtrned. Red for downtrend, Green for uptrend and Yellow is for the horizontal trend this horizontal trend also bookmarked the upper limited and the lower limited the the price swings.  Or in simple the Support and the Resistance level. However, You may use the Heikin Ashi to confirm the trend of the buy sell signal above. I cannot guarantee the win rate, Nevertheless, you must study well the timef
Mama-Fama Smoothed — True Non-Repainting Indicator   (MT4) 100% Non-Repainting Logic Signals are generated only after candles are fully closed No signals on the current forming bar Once an arrow appears, it never moves, disappears, or changes MTF Safe (Multi-Timeframe) Higher timeframe data is read only from CLOSED HTF candles The current (forming) HTF candle is explicitly excluded No future data leakage — safe for backtesting and live trading Closed-Bar Confirmation Buy/Sell arrows are
Max Volume
Maksim Slovakov
Подкрашивает аномально большие тиковые объёмы в красный цвет. Имеет следующие настройки: "Процент" по умолчанию "70"  (Процент на который аномальный объём должен быть больше предыдущего) "Уровень" по умолчанию "500" (Количество тиков, больше которого будем брать во внимание аномальный объём) Внимание! Данный индикатор был разработан для мелких таймфреймов M1,M5,M15. Идея в том, что на таких Таймфреймах увеличение количества тиков говорит об увеличении количество сделок, увеличения интереса к цен
经典永不过时,货币平衡对冲套利是最初量化交易中常见的一种货币套利方式,然而常规的对冲套利由于点差、滑点、隔夜利息、手续费等原因,让获利并不容易实现。 为了实现获利,我们在这款策略里做出了优化,打破平衡套利的概念,利用入场机会的判断、进场时间的错开、增加或减少货币组的仓位等因素,打破平衡但又保持相对稳定,进而实现非平衡的间接套利,历经多年测试,已经住了市场的考验。 策略特点: 1、策略目标货币对USDJPY、EURJPY与EURUSD,启用逻辑USDJPY与EURJPY优先对冲,产生盈利达到目标值离场,反之出现亏损时,计算EUR与USD的强弱程度,启动EURUSD货币进行再次对冲。 2、达到一定设定值还不能实现套利时,可以进一步加大(或减小)USDJPY与EURJPY仓位的比例。 3、非无脑对冲,而是可以根据不同周期的趋势拐点判断方向后入场交易,这样增加了进场后快速套利的可能性 4、使用时【加载到EURUSD货币】,选择自己想要操作的周期,常规选择H1图 5、虽没有严格的要求,但低点差、低过夜费、低手续费对策略会更加友好 策略展示链接 https://www.mql5.com/
Weddell Pro
Dmitriy Kashevich
Weddell Pro is a good trading tool that is suitable for both a beginner and an experienced trader. It can be used both separately and combined with other strategies and indicators Configured for currency pairs was tested several times on cryptocurrency but did not show a high result Currency pairs USD/EUR AUD/CAD GBP/USD Showed itself very well here The percentage of correct transactions is above 68%, which does not make it perfect and bad Doesn't draw or disappear The red arrow shows a t
Ea 555
Aleksandr Nadein
The EA works with pending orders.Recommended Currency Pair GPBUSD H1.With good market valontility gives a good profit.Advisor is fully automated for working in the market.It is also possible to use auto-management.It is possible to use the swap size, ideal for strong volatility or at night.When trading, two pending orders are placed, when one works, the second is deleted. Trading is not intermittent.
Green Frog EA
Ramzi Abuwarda
绿蛙EA:您的最佳专业EA专家 在外汇交易的世界中,市场迅猛而果断地移动,拥有可靠的盟友可以改变一切。请允许我介绍绿蛙EA,这款顶尖的专业EA专家,旨在为交易者提供无与伦比的准确性和高效性。 绿蛙EA是先进技术与多年外汇行业经验的结晶。由一支经验丰富的交易员和软件工程师团队开发,这款出色的EA脱颖而出,提供稳定的结果并创造丰厚的利润。 绿蛙EA的独特之处在于其能够适应不断变化的市场条件。它利用精密的算法和实时数据分析快速识别有利可图的机会,并以非凡的精确性执行交易。该EA的智能交易策略使其能够在各种市场情况下运作,无论是趋势市场、波动市场还是盘整市场,始终保持最佳表现。 绿蛙EA拥有用户友好的界面,使其对于经验丰富的交易员和新手都非常易于操作。用户只需点击几下,即可根据自己的交易偏好和风险承受能力自定义EA。此外,该EA提供详细的绩效报告,让交易员能够分析自己的成果并做出明智的决策。 可靠性是绿蛙EA成功的基石。其强大的风险管理系统确保资本的保全,通过设置严格的止损订单和利润目标来保护投资。交易者可以放心,因为该EA采用严格的风险评估协议来减轻潜在损失。 绿蛙EA出色的业
Deep Analyst Expert Advisor    (mt5  https://www.mql5.com/en/market/product/163998 ) Deep Analyst   is a professional analytical tool powered by a specialized algorithm designed for deep analysis of market cycles and price amplitude fluctuations. By analyzing market conditions over a specific timeframe, the Expert Advisor determines price strength and amplitude using a unique indicator system based exclusively on real-time data. When the global trend and its vector shift, the algorithm automati
Channel Arg Control
Vitalii Zakharuk
The Channel Arg Control indicator, in addition to lines, reflects entry signals in the form of arrows. But how to do that? At first glance, this is not an easy task. But not for the Channel Arg Control indicator, this indicator will tell you whether you have configured the indicator correctly, while you can specify the history interval in the bars that interests you. And yet, how does the indicator tell you? Look at the numbers on the chart near the arrows! This is exactly what you thought, the
MagicIshimoku
Evgeniy Zhdan
The trading robot works on the basis of determining price consolidation zones due to three overlapping Ishimoku indicator readings with different settings according to the Golden Ratio number. This analysis method allows you to predict price movement with high accuracy. Each position has Stop Loss and Take Profit. Each position is controlled by a short trailing stop. Recommended trading tools, 5m: EURUSD, GBPUSD, USDJPY, USDCAD. Settings: MaxRisk - Percentage risk for the calculation of the tr
Insight Investor: Advanced Multi-Currency Forex Trading Bot Introduction In the fast-paced world of Forex trading, having the right tools can significantly enhance your trading experience. Insight Investor is an advanced multi-currency trading bot designed to automate and optimize your trading operations. This expert advisor employs modern algorithms to analyze market conditions and execute trades, aiming to deliver consistent results while maintaining controlled risk levels. Key Features of Ins
Limitless MT4
Dmitriy Kashevich
Limitless MT4 is a universal indicator suitable for every beginner and experienced trader. works on all currency pairs, cryptocurrencies, raw stocks Limitless MT4 - already configured and does not require additional configuration And now the main thing Why Limitless MT4? 1 complete lack of redrawing 2 two years of testing by the best specialists in trading 3 the accuracy of correct signals exceeds 80% 4 performed well in trading during news releases Trading rules 1 buy signal - the ap

产品定位 AdaptiveTrendGrid 是一款面向专业交易者的全自动趋势跟踪与网格组合策略 EA。它以 日内趋势锚定 为核心,沿行情方向动态铺设多级挂单网格,同时内置 八层渐进式风险防御体系 和 量化市场监控模块 ,在追求趋势利润的同时,对回撤进行闭环管控。系统尤其针对黄金(XAUUSD)等波动敏感品种做过深度适配,兼顾标准账户与美分账户。 建议使用资金:10,000 美元以上。 设计理念 传统的网格策略容易在单边不回头或剧烈波动中遭受重创。AdaptiveTrendGrid 的设计目标就是 让网格具备“趋势判断力”和“环境适应力” ——它不仅在行情启动时能及时介入,更会在市场转向压缩、回撤超标或异常波动出现时,逐级启动防御方案,包括暂停开仓、部分减仓、反向对冲、波动收缩适应,直至极端情况下完全清仓。整套逻辑如同给网格装上了一层层安全气囊,力求把单日灾难性亏损的概率压到最低。 核心功能简述 1. 趋势网格引擎 每个交易日,在设定的起始时段捕捉价格极端点作为锚定基准。 围绕锚定价在上下两侧自动生成多级、多手数倍数的挂单(Buy Stop/Sell Stop),形成双向突破网格。
The Smart Liquidation Clusters  is a custom technical indicator designed for the MetaTrader 4 (MT4) platform. It calculates and visualizes   estimated liquidation zones   based on price action and internal algorithms, displaying them as a dynamic heatmap on the chart. These zones are known by several names, sometimes referred to as liquidity pools, liquidity levels, leverage levels, liquidation heatmap levels, leverage heatmap zones, or leverage heatmap levels. These zones represent   potential
QuantumAlert Stoch Navigator is a free indicator available for MT4/MT5 platforms, its work is to provide "alerts" when the market is inside "overbought and oversold" regions in the form of "buy or sell" signals. This indicator comes with many customization options mentioned in the parameter section below, user can customise these parameters as needful. Join our   MQL5 group , where we share important news and updates. You are also welcome to join our private channel as well, contact me for the p
FREE
QuantEx Pivot Indicator
Savia Forex Software Solutions
QuantEx Pivot Indicator is a practical MT4 technical analysis tool designed to help traders identify important Fibonacci-based pivot, support, and resistance levels directly on the chart. The indicator monitors price action and plots key levels using a structured calculation framework, giving traders a clearer view of potential reaction zones across different market conditions. QuantEx Pivot Indicator can be used on compatible currency pairs, indices, commodities, stocks, metals, and cryptocurre
Sweet Waffle
Christophe Godart
The arrows are calculated with: -     2 Parabolic  parameters -     2 ADX parameters -     4 Stochastic parameters We recommend to combine it with Parabolic, ZigZag or Elliot waves indicator. Always trade the trend! If you make sure to draw your trend lines and support/resistance zones you will just have to wait for the signal to appear. Take the trade. For Binary Options it is advisable to set the expiry time to 5-15 min in M1 chart. THIS INDICATOR IS ZERO REPAINT Best assets to trade: - EUR
UT Bot Alerts for MT4
Ulises Calderon Bautista
5 (1)
UT Bot Alerts — 基于ATR的自适应追踪止损系统 将TradingView上QuantNomad开发的传奇指标「UT Bot Alerts」完整移植到MQL5和MQL4。 原始概念由HPotter提出,初始实现由Yo_adriiiiaan完成,Pine Script v4警报版本由QuantNomad(Vadim Cissa)开发——他是TradingView上拥有超过10万粉丝的知名量化开发者。原始脚本在TradingView上获得了 超过110万次浏览和35,500次收藏 ,是有史以来最受欢迎的开源交易指标之一。 本移植版以 100%的逻辑忠实度 复现了原始算法:相同的4分支递归追踪止损逻辑、相同的交叉检测、相同的信号生成。在已确认K线上不会重绘。 什么是UT Bot Alerts? UT Bot Alerts是一个 趋势跟踪信号系统 ,基于一个简洁而优雅的核心概念:利用平均真实波幅(ATR)动态调整与价格距离的自适应追踪止损。 在上升趋势中,追踪止损只向上移动,绝不下降——锁定利润。在下降趋势中,止损只向下移动,绝不上升。当价格穿越追踪止损线时,系统切换方向并生成
FREE
Hurst Buy and Sell Mt4
Victor Alfonso Molina Botello
Hurst Buy and Sell  This innovative indicator, inspired by xAI Grok intelligence, uses the Hurst exponent to identify the nature of the market and generate buy/sell signals. The EA for this indicator (Hurst Razer PRO EA MT5) is now available, you can see it by clicking here!  https://www.mql5.com/es/market/product/153441?source=Site+Profile+Seller  If you want more signals from the indicator, change the minimum number of bars between consecutive signals. The lower the value, the more signals it
FREE
Trend driver bars is the manual trading system, which defines current trend continue or it's pull-back/reverse. "Driver" bars - are price action patterns that has powerfull affect on market, defining it's near future direction. Generally, driver bars represents trend "skeleton" and often anticipates new market impulse. System plots arrows when market shows 3 pattenrs in a row(most powerfull combo-pattern), and makes fast scalping of incomming movement. Loss positions closes by common profit. Lot
Trend Gap Indicator
Roberto Alexander Quan
A Gap often occurs when the price moves with "strength" in a given direction (either up or down).  This Gap is formed when, in looking at 3 consecutive candles, the wicks of the 1st and 3rd candles do not overlap.  When this happens, the indicator creates a rectangle where the Gap is located. It identifies a zone where the price could potentially go back to (mitigation).   The Gap/rectangle is mitigated when the price returns and completely covers the rectangle. Note that the indicator also show
OFFER!   OFFER ! After 3 weeks the unlimited price will be 500$ and in the future you will regret why you didn't make a purchase at this lowest price. Dear Traders, the atomic power Entries Indicator is one of the indicators that if used wisely and correctly can help you to find an edge over the market.  The indicator will work for all forex pairs, all markets and all timeframes. Still it is your duty to find the most effective timeframe for you. When the sell or buy arrow appears you will get a
Multi Timeframe ZigZag Indicator
Salman A A A T Bakhash
5 (2)
Description: This indicator draw ZigZag Line in multiple time frame also search for Harmonic patterns before completion of the pattern. Features: Five instances of ZigZag indicators can be configured to any desired timeframe and inputs. Draw Harmonic pattern before pattern completion. Display Fibonacci retracement ratios. Configurable Fibonacci retracement ratios. Draw AB=CD based on Fibonacci retracement you define. You can define margin of error allowed in Harmonic or Fibonacci calculations
FREE
Railis
Vasiliy Luka
Долгосрочный,  эксперт. Эксперт может открывать  ордера в обе стороны. Он уникален тем что каждый ордер работает только с амим сабой и не путается с другими. Когда открытые ордера создают первый уровень без убытка, открываются стопы на определенном уровне,максимально приближон к текущей цене. Убыточный ордер ставит противоположный запоминая убыок и открывает стопы при достижении прибыльности -  Profit=1;.  Каждый ордер запомипает свой баланс на определенном уровне  -  Min Dist=200; Поставте в па
KingMaker Ultimate Scalper Expert Advisor TimeFrame - 5 Mins Minimum Balance - 200$ Pairs - Major Currency Pairs , Like - EURUSD, GBPUSD, USDJPY .... etc Run Low Spread Forex Broker Or ECN Broker Money Management Adjust Risk Management SafeMode - True/False Setting : You Have Deposit 200$ , Run EA On 2 or 3 Currency Pairs Only  Automatic Increase And Decrease Lot Size 
介绍二元智能系统:您的终极交易伴侣 二元智能系统不仅仅是一个指标,它是一个精心设计的复杂交易工具,为交易者提供精确的交易信号和市场洞察。该系统建立在先进的算法和广泛的技术指标基础上,是您解锁交易成功的关键。 指标组件: 移动平均百分比(MAP):   该组件计算多个移动平均线的加权平均值,为趋势识别提供强大的基础。MAP会根据市场条件动态调整,提供有关当前趋势方向的见解。 商品通道指标(CCI):   CCI通过分析价格偏离平均值来衡量超买和超卖情况。二元智能系统的CCI集成确保了从整体上识别潜在的反转点。 移动平均线收敛/发散(MACD):   系统中的MACD组件超越了简单的价格交叉。它评估MACD线和信号线的收敛和发散,揭示隐藏的交易机会并确认趋势强度。 平均方向指数(ADX):   使用ADX,二元智能系统量化趋势动量。它可以准确地识别强劲的趋势并帮助您避免弱势、不确定的市场阶段,从而增强您的交易决策。 多空力量:   通过这些指标,可以利用多空情绪的综合力量。这对市场情绪的全面了解有助于进行明智的交易入场。 随机指标:   二元智能系统中的随机指标有助于识别超买和超卖情况,并
Supernova Trading Indicator – See the Market Like Never Before Supernova isn’t just an indicator — it’s your secret weapon. Powered by advanced algorithms and real-time analysis, Supernova cuts through the noise and reveals high-probability entry and exit points with stunning clarity. No more guesswork. No more hesitation. Whether you're trading forex, crypto, or stocks, Supernova adapts to any strategy and any timeframe — delivering clean, confident signals that help you trade faster, smarter,
SmartLines
Sergey Naymushin
На счёте более 11000$. Я на 100% уверен в своём роботе! Доверьтесь и вы! Ссылка на мониторинг:   https://www.mql5.com/ru/signals/631995 Для начала торговли достаточно небольшого депозита. Идеален для быстрого разгона депозита!!! Подходит для мультивалютной торговли. Невосприимчивость к большой задержке и величине спреда. Принцип работы Эксперт торгует сеткой с мартингейлом. Рекомендации Рекомендую использовать мультивалютную торговлю. Для этого запустите советника на 4 - 8 валютных парах!!!
Advanced Market Sessions is a professional, all-in-one market session tracker designed for serious day traders and swing traders. It accurately tracks the Sydney, Tokyo, London, and New York sessions with bulletproof precision — ensuring your session times are always mathematically correct, even if your PC clock is wrong, out of sync, or you travel between timezones. WHY TRADERS CHOOSE THIS INDICATOR: BULLETPROOF TIME ACCURACY Sessions always open and close at the exact correct real-world
该产品的买家也购买
Miraculous 指标 – 100% 不重绘的外汇和二元期权工具,基于江恩九方图 这个视频介绍的 Miraculous 指标 是一款专为外汇和二元期权交易者开发的高精度、强大交易工具。该指标的独特之处在于它建立在传奇的 江恩九方图 和 江恩振动法则 之上,使其成为现代交易中可用的最精确预测工具之一。 Miraculous 指标 完全不重绘 ,这意味着它的信号在 K 线收盘后不会改变或消失——你看到的就是你得到的。这为交易者提供了可靠且一致的基础,让他们能够自信地进出场交易。 主要特点: 基于江恩九方图和江恩理论构建 100% 不重绘的信号系统 适用于所有时间周期(M1、M5、H1、H4、日线、周线) 适用于外汇和二元期权交易 清晰的买卖信号,准确率高 可用于剥头皮、日内交易或波段交易 兼容大多数 MT4 平台 这款工具旨在帮助初学者和专业交易者做出更好、更明智的决策。无论您是交易货币、指数还是二元期权,Miraculous 指标都将为您在市场中提供所需的优势。
Breakout Arrows Mt4
Michael Oko Oboh
5 (1)
Trend Breakout Arrows Indicator The Trend Breakout Arrows Indicator is a momentum-based signal tool designed to identify potential bullish and bearish breakout opportunities. It displays clear arrow signals directly on the price chart, helping traders quickly recognize possible trend changes and continuation setups. Up Arrow (Buy Signal) A magenta up arrow appears below a candle when bullish momentum begins to strengthen. This signal indicates that buying pressure may be overtaking selling press
FFx Engulfing Setup Alerter gives trade suggestions with Entry, Target 1, Target 2 and StopLoss. Below are the different options available: Entry suggestion - pips to be added over the break for the entry 3 different options to calculate the SL - by pips, by ATR multiplier or at the pattern High/Low 3 different options to calculate the 2 TPs - by pips, by ATR multiplier or at Risk/Reward Offset the dashboard - any place on the chart Remove the suggestion once the price reached the SL line Lines
FFx InsideBar Setup Alerter gives trade suggestions with Entry, Target 1, Target 2 and StopLoss. Below are the different options available: Entry suggestion - pips to be added over the break for the entry Minimum candle size - to avoid too close buy/sell entry suggestions 3 different options to calculate the SL - by pips, by ATR multiplier or at the pattern High/Low 3 different options to calculate the 2 TPs - by pips, by ATR multiplier or at Risk/Reward Offset the dashboard - any place on the c
FFx OutsideBar Setup Alerter gives trade suggestions with Entry, Target 1, Target 2 and StopLoss. Below are the different options available: Entry suggestion - pips to be added over the break for the entry. 3 different options to calculate the SL - by pips, by ATR multiplier or at the pattern High/Low. 3 different options to calculate the 2 TPs - by pips, by ATR multiplier or at Risk/Reward. Offset the dashboard - any place on the chart. Remove the suggestion once the price reached the SL line.
FFx PinBar Setup Alerter gives trade suggestions with Entry, Target 1, Target 2 and StopLoss. Below are the different options available: Entry suggestion - pips to be added over the break for the entry Minimum candle size - to avoid too small candles 3 different options to calculate the SL - by pips, by ATR multiplier or at the pattern High/Low 3 different options to calculate the 2 TPs - by pips, by ATR multiplier or at Risk/Reward Offset the dashboard - any place on the chart Remove the sugges
FFx MACD Divergences
Eric Venturi-Bloxs
The purpose of this new version of the MT4 standard indicator provided in your platform is to display in a sub-window multiple timeframes of the same indicator with its divergences. See the example shown in the picture below. But the display isn't like a simple MTF indicator. This is the real display of the indicator on its timeframe. Here's the options available in the FFx divergences indicator: Select the timeframes to be displayed (M1 to Monthly) Define the width (number of bars) for each tim
FFx RSI Divergences
Eric Venturi-Bloxs
The purpose of this new version of the MT4 standard indicator provided in your platform is to display in a sub-window multiple timeframes of the same indicator with its divergences. See the example shown in the picture below. But the display isn't like a simple MTF indicator. This is the real display of the indicator on its timeframe. Here's the options available in the FFx divergences indicator: Select the timeframes to be displayed (M1 to Monthly) Define the width (number of bars) for each tim
FFx CCI Divergences
Eric Venturi-Bloxs
The purpose of this new version of the MT4 standard indicator provided in your platform is to display in a sub-window multiple timeframes of the same indicator with its divergences. See the example shown in the picture below. But the display isn't like a simple MTF indicator. This is the real display of the indicator on its timeframe. Here's the options available in the FFx divergences indicator: Select the timeframes to be displayed (M1 to Monthly). Define the width (number of bars) for each ti
The FFx Dashboard MTF alerter will show you on a single chart all the timeframes (M1 to Monthly) with their own status for the indicator. 2 Alert Options: Single timeframe: each selected timeframe alert separately when a signal occurs Multi timeframes: all selected timeframes must agree for an alert to be triggered Both options have an input to select the timeframes to be used for the alert(s). How to Understand the Status: Green/Red square: histogram above/below 0 line Green square + Red bord
The FFx Dashboard MTF alerter will show you on a single chart all the timeframes (M1 to Monthly) with their own status for the indicator. 2 Alert Options: Single timeframe: each selected timeframe alert separately when a signal occurs Multi timeframes: all selected timeframes must agree for an alert to be triggered Both options have an input to select the timeframes to be used for the alert(s). How to understand the status: Green/Red square: RSI above/below 50 line Green square + Red border: R
The FFx Dashboard MTF alerter will show you on a single chart all the timeframes (M1 to Monthly) with their own status for the indicator. 2 Alert Options: Single timeframe: each selected timeframe alert separately when a signal occurs Multi timeframes: all selected timeframes must agree for an alert to be triggered Both options have an input to select the timeframes to be used for the alert(s). How to understand the status: Green/Red square: Stoch above/below 50 line Green square + Red border:
The FFx Dashboard MTF alerter will show you on a single chart all the timeframes (M1 to Monthly) with their own status for the indicator. 2 Alert Options: Single timeframe: each selected timeframe alert separately when a signal occurs Multi timeframes: all selected timeframes must agree for an alert to be triggered Both options have an input to select the timeframes to be used for the alert(s). How to understand the status: Green/Red square: Price above/below Cloud (Kumo) Green square + Red bo
The FFx Dashboard MTF alerter will show you on a single chart all the timeframes (M1 to Monthly) with their own status for the indicator. 2 Alert Options: Single timeframe: each selected timeframe alert separately when a signal occurs Multi timeframes: all selected timeframes must agree for an alert to be triggered Both options have an input to select the timeframes to be used for the alert(s). How to understand the status: Green/Red square: MA pointing Up/Down Green square + Red border: MA po
The FFx Dashboard MTF alerter will show you on a single chart all the timeframes (M1 to Monthly) with their own status for the indicator. 2 Alert Options: Single timeframe: each selected timeframe alert separately when a signal occurs. Multi timeframes: all selected timeframes must agree for an alert to be triggered. Both options have an input to select the timeframes to be used for the alert(s). How to understand the status: Green square: Price above PSAR Red square: Price below PSAR Options
The FFx Dashboard MTF alerter will show you on a single chart all the timeframes (M1 to Monthly) with their own status for the indicator. 2 Alert Options: Single timeframe: each selected timeframe alert separately when a signal occurs Multi timeframes: all selected timeframes must agree for an alert to be triggered Both options have an input to select the timeframes to be used for the alert(s). How to understand the status: Green/Red square: CCI above/below levels (ie. 100/-100) Grey square: C
The FFx Dashboard MTF alerter will show you on a single chart all the timeframes (M1 to Monthly) with their own status for the indicator. 2 Alert Options: Single timeframe: each selected timeframe alert separately when a signal occurs Multi timeframes: all selected timeframes must agree for an alert to be triggered Both options have an input to select the timeframes to be used for the alert(s). How to understand the status: Green/Red square: ADX above level Grey square: ADX below level Red bor
The FFx Dashboard MTF alerter will show you on a single chart all the timeframes (M1 to Monthly) with their own status. 2 Alert Options: Single timeframe: each selected timeframe alert separately when a signal occurs Multi timeframes: all selected timeframes must agree for an alert to be triggered Both options have an input to select the timeframes to be used for the alert(s). How to understand the status: Green/Red square: bullish/bearish candle Options available in the FFx Dashboard Alerter
The indicator of a Professional Trader is an arrow indicator for predicting the direction of price movement. I have been working on this indicator since 2014. You can use this indicator as your main indicator, use its entry signals, and use it as your only indicator to find entry points. About the product: Recommended TF [H4-D1-W1]   . The indicator predicts the direction of the next candle. Fits a variety of tools; Flexibility in settings for different instruments and intervals through the MO
THE GRAFF III
Charles Harper
The [GRAFF] III manual trading system is based on multiple MetaTrader (MT4) indicators. Together, the entire PACK of GRAFF III indicators makes an advanced trading tool. The system consists of over 20 different custom-built indicators which have been carefully selected and tested in the long term to produce strong and efficient trading signals. The particular indicators are based on different mathematical formulas, so the entire system is calibrated to remove false signals from its own indicator
FFx Universal Strength Meter PRO is more than a basic strength meter. Instead of limiting the calculation to price, it can be based on any of the 19 integrated strength modes + 9 timeframes. With the FFx USM, you are able to define any period for any combination of timeframes. For example, you can set the dashboard for the last 10 candles for M15-H1-H4… Full flexibility! Very easy to interpret... It gives a great idea about which currency is weak and which is strong, so you can find the best pai
Pan PrizMA CD Phase is an analogue of the МetaТrader 5 indicator , and is an option based on the Pan PrizMA indicator. Details . Averaging by a quadric-quartic polynomial increases the smoothness of lines, adds momentum and rhythm. Extrapolation by the sinusoid function near a constant allows adjusting the delay or lead of signals. The value of the phase - wave status parameter (which is close in meaning to the trigonometric phase or the angle of the radius-vector rotation in the trigonometric p
FFx Basket Scanner
Eric Venturi-Bloxs
MetaTrader 5 version available here : https://www.mql5.com/en/market/product/24882 FFx Basket Scanner is a global tool scanning all pairs and all timeframes over up to five indicators among the 16 available. You will clearly see which currencies to avoid trading and which ones to focus on. Once a currency goes into an extreme zone (e.g. 20/80%), you can trade the whole basket with great confidence. Another way to use it is to look at two currencies (weak vs strong) to find the best single pairs
NostradamusMT4
Andrey Spiridonov
1 (1)
NostradamusMT4 is a powerful indicator from the set of professional trader. The indicator is based on Andrei Spiridonov's original price calculation method (ESTIMATED PRICE) for the current candle price. Advantages The indicator does not redraw. It works on any timeframes. Works with any trading instruments. Perfectly suitable for scalping and trading binary options. Parameters Color - color of the ESTIMATED PRICE FUTURE line. How to work with the indicator The indicator forms the ESTIMATED P
FFx Pivot SR Suite PRO
Eric Venturi-Bloxs
MetaTrader 5 version available here: https://www.mql5.com/en/market/product/25794 FFx Pivot SR Suite PRO is a complete suite for support and resistance levels. Support and Resistance are the most used levels in all kinds of trading. Can be used to find reversal trend, to set targets and stop, etc. The indicator is fully flexible directly from the chart 4 periods to choose for the calculation: 4Hours, Daily, Weekly and Monthly 4 formulas to choose for the calculation: Classic, Camarilla, Fibonac
REX complete 3in1
Christophe Godart
This is the complete REX package. It consists of the lite, pro and ULTRA version.  Perfect for beginners and intermediates. REX complete is 100% non repaint. The strategy is based on a mix of different strategies, statistics, including pivot points, oscillators and patterns.  As the trading idea consists of a variety of some classic indicators like Momentum, Williams Percent Range, CCI, Force Index, WPR, DeMarker, CCI, RSI and Stochastic, it is clear that the fundamental indicators have being u
Let´s try to make some real money! Call me profit addicted. I thought why not try to make THE dream come reality. With discipline, a clear strategy and this indicator I focus on entering the perfect trades. This indicator is very easy to use as you will get perfect entry points for Put or Call trades. The arrows are calculated with: -     Momentum  parameters -     Candle stick patterns -     Fundamental Price action We recommend to combine it with Parabolic, ZigZag or Elliot waves indicator
Pisces TheProfitZone
Nuttawut Khiawkiri
Pisces TheProfitZone "Pisces TheProfitZone MT4 Indicator Powered byFxGangster" This indicator will calculate new support and resistant zone everyday, and that give us a trading zone such as thats telling us TP and SL, So it still telling us for where should the price will go reach? Fore Example. Uptrend : If Price can stay upper a Line and price close higher above a Line, then the price will continue go up to reach next Line. Downtrend : If Price can't pass to stay upper a Line and the price
筛选:
无评论
回复评论