TA Inspector

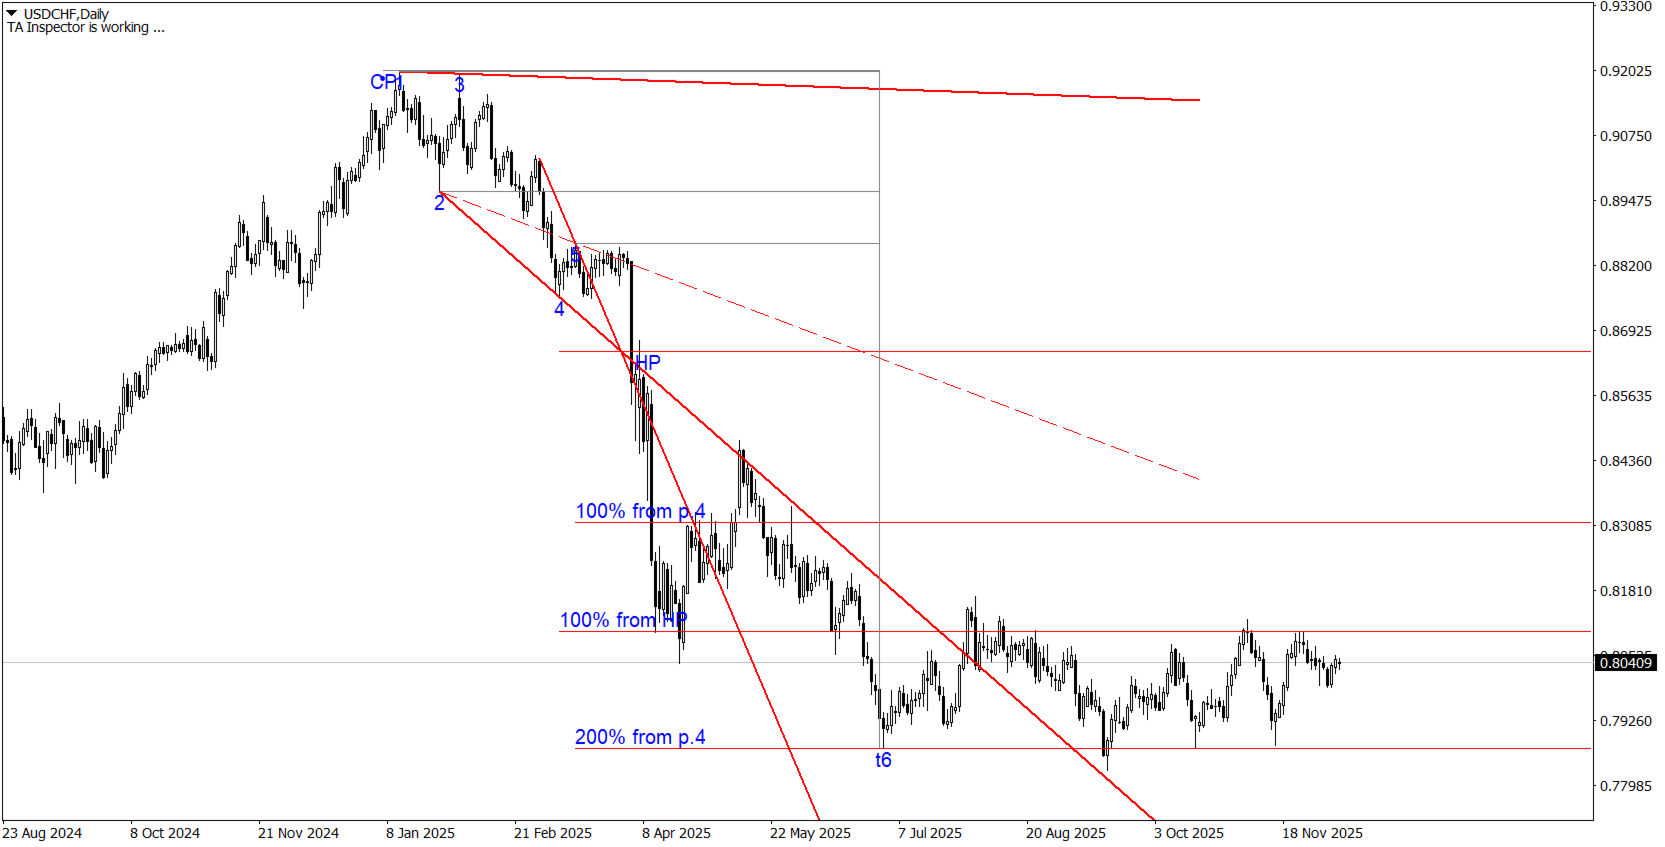
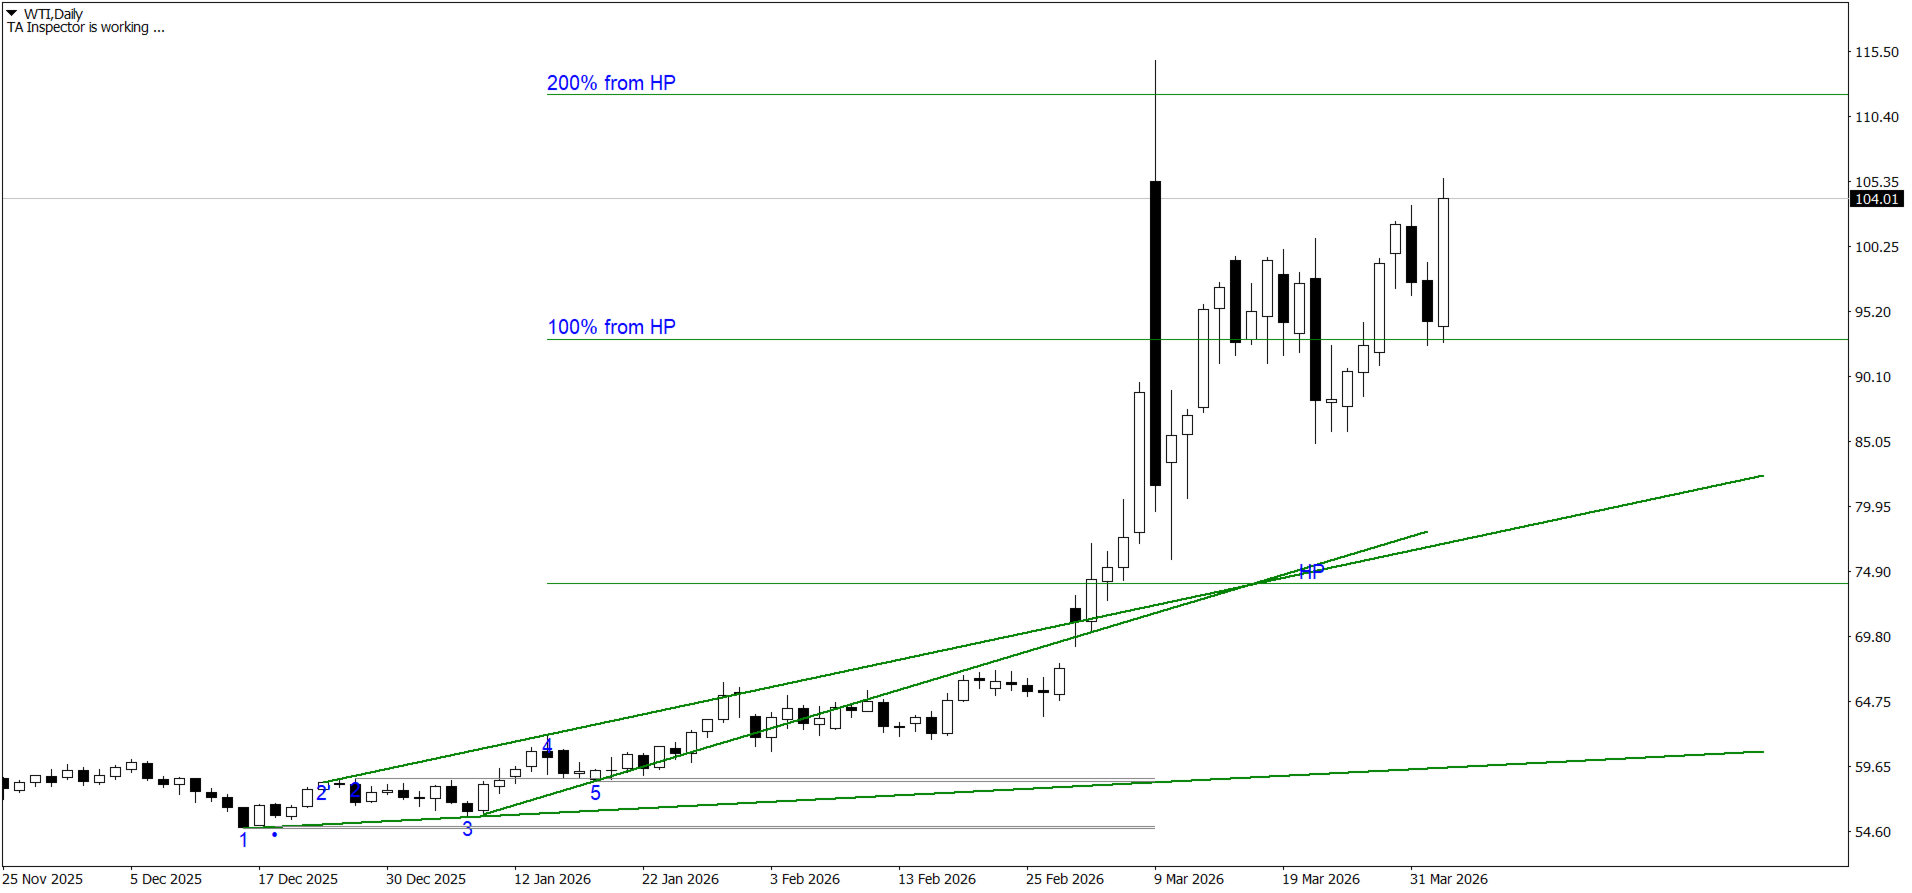
Индикатор TA Inspector - инструмент, который позволит улучшить анализ рынка и поможет определить дальнейшее движение цены на основе геометрических построений и ориентацию целей ценового развития. Индикатор производит самостоятельно построение трендовых линий и предполагаемого расчетного уровня окончания тренда (HP / Hypothetical Point). Индикатор выполняет автоматическое построения моделей метода Tactica Adversa.

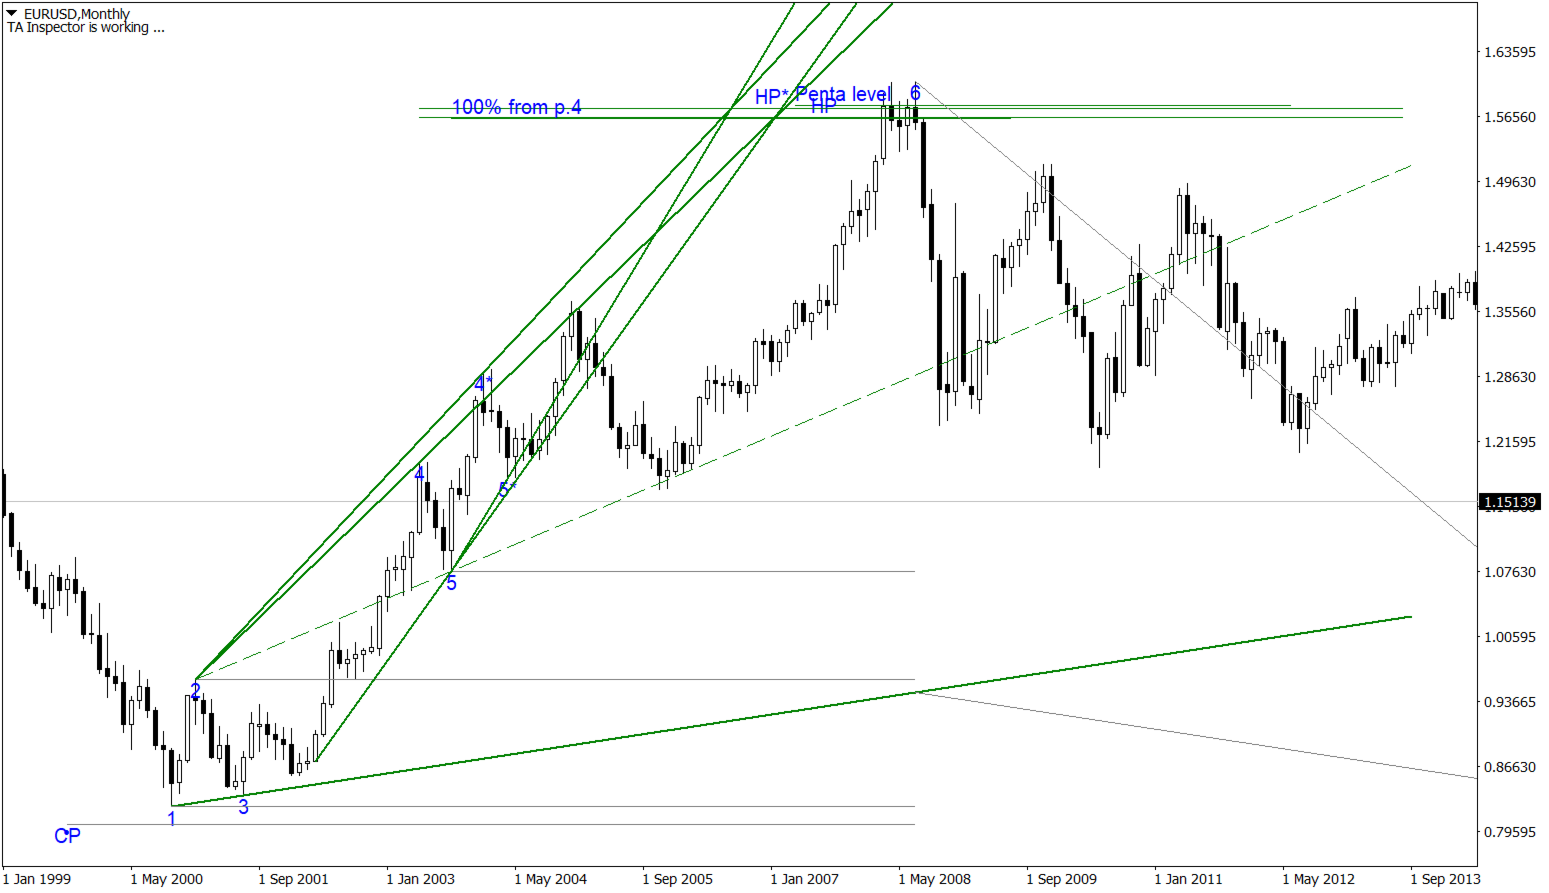
С точки зрения Tactica Adversa движение цены представляет собой последовательную смену Up - и Down – трендов. Каждый тренд описывается Моделью Расширения (МР). Данная модель формируется двумя расходящимися линиями – тренда и целей.

Построение основано на четырёх точках (экстремумах), следующих друг за другом. Последовательность выбора экстремумов для построения МР:

  • для down-тренда: high1 - low2 - high3 - low4 - high5 - low6
  • для up-тренда: low1 - high2 - low3 - high4 – low5 - high6

Таким образом,

  • 1 есть точка начала тренда, а 6 – его окончание;
  • линия целей строится от 2 к 4 и далее;
  • линия тренда строится от 1 к 3 и далее;
  • до формирования 6 точки на выше указанных линиях не может быть более двух точек (причём именно и только тех, через которые эти линии построены!);
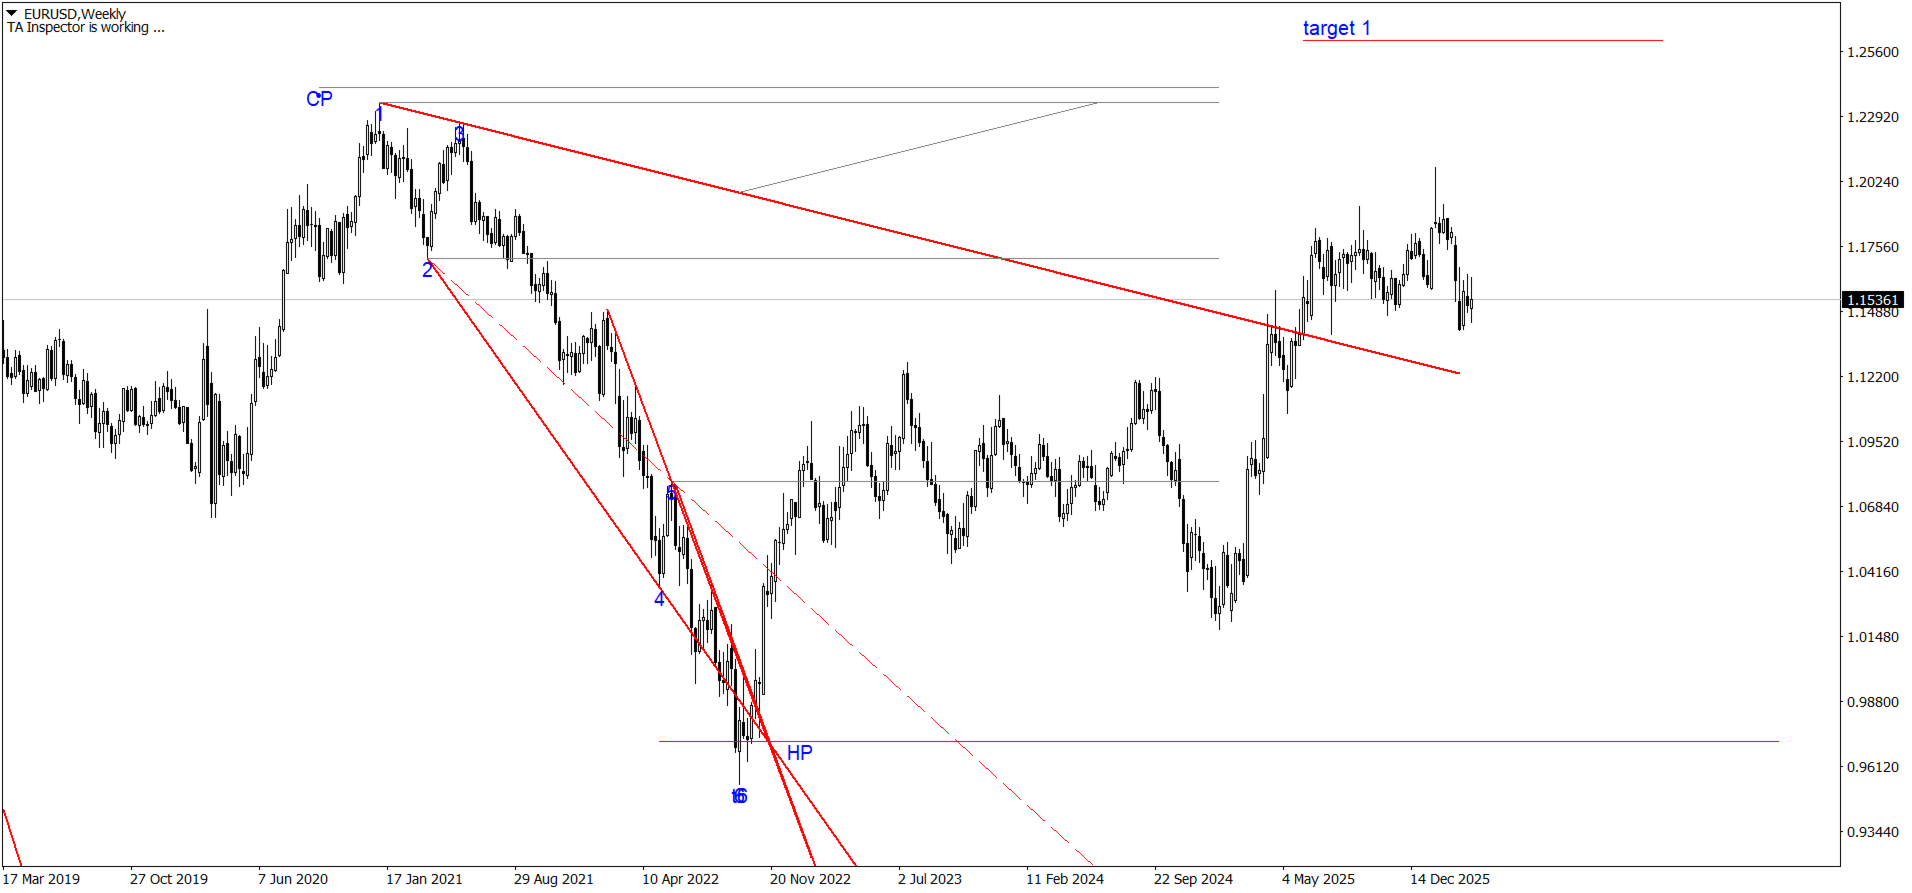
  • расчёт первой цели делается от места пробития тренда. Пробитием тренда считается даже однопунктовое касание его ценой.

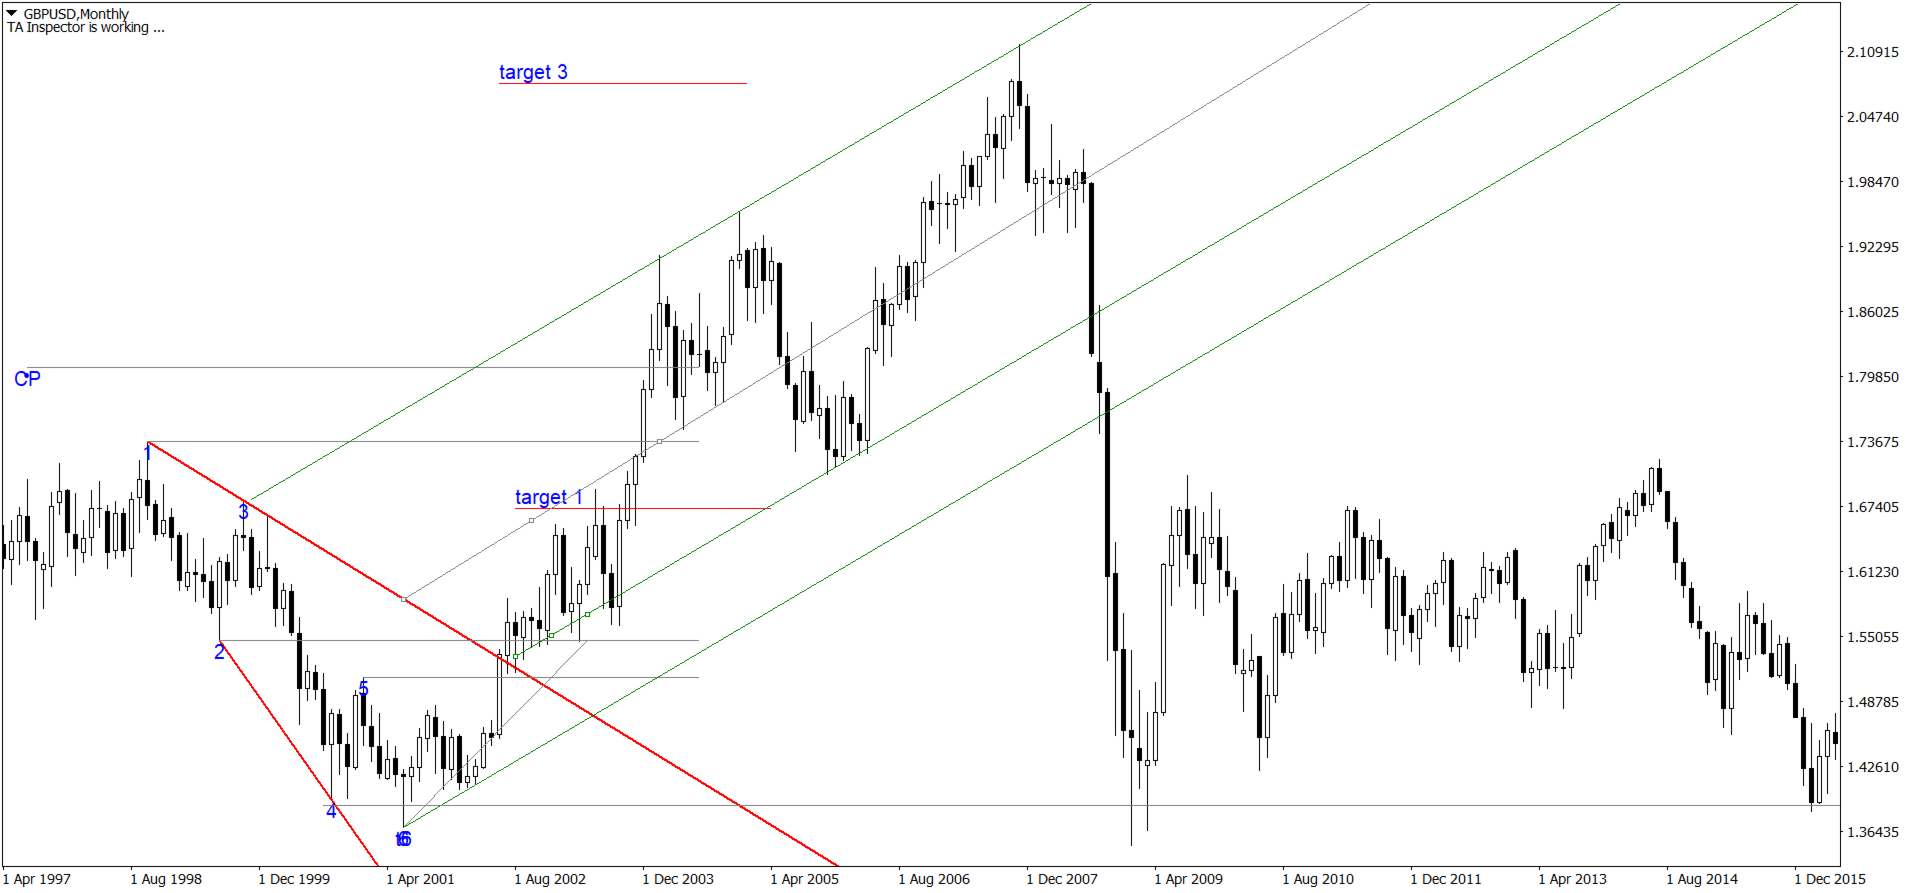
В случае пробития трендовой Модели Расширения возможна отработка трёх целей:

  • 1 цель – расстояние от шестой точки до точки пробития трендовой, oтложенное в сторону пробития;
  • 3 цель – расстояние от четвёртой точки до первой, отложенное в сторону первой точки;
  • 5 цель - расстояние от точки шесть до сакральной точки (CT), отложенное в противоположную сторону от точки 6.

Действие (т.е. последовательное достижение трёх целей) сформированной МР может быть отменено:

  • если цена после пробития линии тренда достигает 6 точки раньше, чем первой цели;
  • если цена после пробития линии тренда достигает первой цели за время меньшее, чем было затрачено на движение от 6 точки до линии тренда;
  • если в период движения цены от 6 точки к первой цели будет сформирована новая модель.

Отношение расстояния от СТ до 1 к расстоянию от 1 до 3 показывает нам Силу тренда. Если СТ-1 меньше 1-3, то тренд сильный, если СТ-1 больше 1-3 – слабый. Для отмен: модель со слабой линией тренда отменяет предыдущую (только если последняя полностью сформирована!), с сильной – подтверждает.

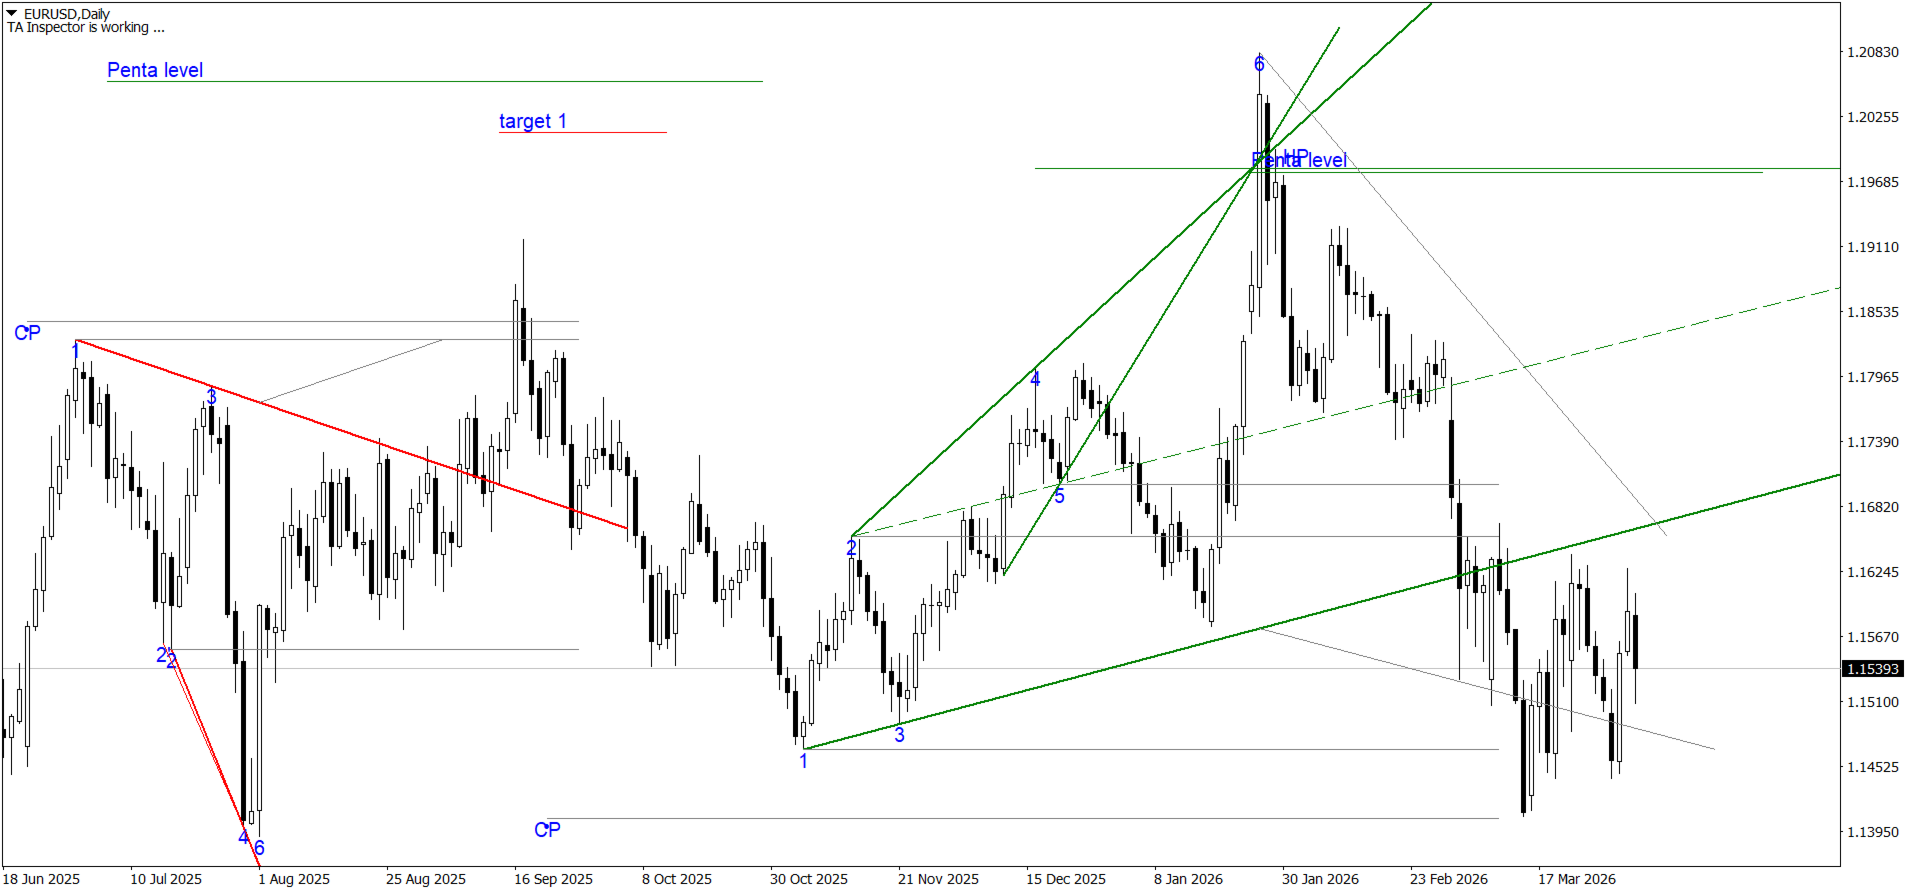
Ещё одним применением СТ является определение Смены тренда.

Как мы знаем, модели чередуются. Каждая последующая модель, описывающая тренд, сменяет тренд предыдущий. Но это происходит лишь в том случае, когда СТ модели попадает в промежуток между точками 4-6 предыдущей модели.

Одна из стратегий основанная на построении индикатора показана на видео.


Индикатор поддерживает функцию push-уведомлений.


Настройки

  • ShowAllModels - показывать все модели без ограничений, по умолчанию true
  • Point22Shift - количество баров отклонения точки 2* от экстремумов точки 1 и точки 2,  по умолчанию 4
  • TARestriction - количество баров от текущего в прошлое, где будет происходить поиск трендовых линий и моделейпо умолчанию 1500
  • Base13 - максимальное количества баров между точкой 1 и точкой 3 (база), через которые будет построена трендовая линияпо умолчанию 50
  • Point3ToPoint1 - порядок дополнительного экстремума между точкой 1 и точкой 3по умолчанию 5
  • ExteremumToPoint3 - что использовать для сравнения: если true, то использовать Close точки 3, иначе (false) Low для Up и High для Down для сравнения с дополнительным экстремумом между точками 1 и 3, по умолчанию false
  • AbsolutenessPoint3 - если > 0, то проверяем экстремумы между 1 и 3 с заданным порядком, по умолчанию 2
  • AbsolutenessPoint3Count - rоличество допустимых дополнительных экстремумов между 1 и 3, по умолчанию 1
  • CanRestoreModels - cохранение моделей для восстановления после перезапуска терминала, по умолчанию false
  • EnableBreakOutTrendPush - отключение push-уведомлений, по умолчанию включены.
  • BreakOutPushPrefix - префикс для сообщений в push-уведомлениях, по умолчанию "TA"
  • ShowPointLevels - показывать уровни экстремумов по цене, по умолчанию true
  • Show100Proc4 -  если true - постоянная демонстрация 100% от точки 4, если false - демонстрация 100% от т4 ограниченная пробоем трендовой линии, по умолчанию true
  • UpTrendColor - цвет линии up тренда, по умолчанию Green
  • DownTrendColor - цвет линии down тренда, по умолчанию Red
  • ChildTrendColor - цвет линии тренда, по умолчанию DarkOrange
  • MirrorColor - цвет дополнительных линий, по умолчанию Gray
  • LabelColor - цвет текстапо умолчанию Blue
  • LabelSize - размер текста, по умолчанию 10
  • LabelFont - шрифтпо умолчанию "Arial"
  • TextShift - отступ текстапо умолчанию 1


추천 제품
Revolutionize Your Trading with This Powerful Indicator-Based System Are you struggling to find accurate entry and exit points in trading? Do you want a proven, indicator-driven system that helps you maximize profits and minimize risks ? Introducing our Advanced Trading System —a powerful, easy-to-use technical analysis tool designed for forex, stocks, and crypto traders . Key Features & Benefits: Precision Buy & Sell Signals – Our system generates crystal-clear buy (green) and sell (red
This Indicator is use the ZigZag to calculate the Upper and  Lower Bound and the uptrend and the downtrned. Red for downtrend, Green for uptrend and Yellow is for the horizontal trend this horizontal trend also bookmarked the upper limited and the lower limited the the price swings.  Or in simple the Support and the Resistance level. However, You may use the Heikin Ashi to confirm the trend of the buy sell signal above. I cannot guarantee the win rate, Nevertheless, you must study well the timef
Mama-Fama Smoothed — True Non-Repainting Indicator   (MT4) 100% Non-Repainting Logic Signals are generated only after candles are fully closed No signals on the current forming bar Once an arrow appears, it never moves, disappears, or changes MTF Safe (Multi-Timeframe) Higher timeframe data is read only from CLOSED HTF candles The current (forming) HTF candle is explicitly excluded No future data leakage — safe for backtesting and live trading Closed-Bar Confirmation Buy/Sell arrows are
Max Volume
Maksim Slovakov
Подкрашивает аномально большие тиковые объёмы в красный цвет. Имеет следующие настройки: "Процент" по умолчанию "70"  (Процент на который аномальный объём должен быть больше предыдущего) "Уровень" по умолчанию "500" (Количество тиков, больше которого будем брать во внимание аномальный объём) Внимание! Данный индикатор был разработан для мелких таймфреймов M1,M5,M15. Идея в том, что на таких Таймфреймах увеличение количества тиков говорит об увеличении количество сделок, увеличения интереса к цен
Currency balance hedging arbitrage is a common currency arbitrage method in the original quantitative trading, but conventional hedging arbitrage is not easy to achieve due to spreads, slippage, swaps, handling fees and other reasons. In order to achieve profits, we have made optimizations in this strategy, breaking the concept of balanced arbitrage, using factors such as the judgment of entry opportunities, the staggered entry time, and increasing or decreasing the position of currency pairs, e
MT4용 Crypto_Forex 지표 "프랙탈 채널" - 이 지표는 프랙탈의 고점/저점을 기반으로 실제 로컬 추세선을 보여줍니다. - 그래픽 분석을 사용하는 트레이더에게 유용합니다. - 저항선 로컬 추세선 - 빨간색 - 지지선 로컬 추세선 - 파란색 - 프랙탈 개수, 추세선 색상 및 너비를 결정하는 몇 가지 매개변수가 있습니다. - 이 지표는 현재 시장 상황을 파악하는 데 유용합니다. - 강세장 - 두 선 모두 상승할 때 - 약세장 - 두 선 모두 하락할 때 - 횡보장 - 두 선 모두 반대 방향으로 움직일 때 ............................................................................................. 여기를 클릭하여 고품질 트레이딩 로봇과 지표를 확인하세요! 이 제품은 MQL5 웹사이트에서만 제공되는 오리지널 상품입니다.
Weddell Pro
Dmitriy Kashevich
Weddell Pro is a good trading tool that is suitable for both a beginner and an experienced trader. It can be used both separately and combined with other strategies and indicators Configured for currency pairs was tested several times on cryptocurrency but did not show a high result Currency pairs USD/EUR AUD/CAD GBP/USD Showed itself very well here The percentage of correct transactions is above 68%, which does not make it perfect and bad Doesn't draw or disappear The red arrow shows a t
This indicator works on MT4 and is very easy to use. When you receive a signal from it, you wait for that candle with the signal to close and you enter your trade at the beginning of the next new candle . A red arrow means sell and a green arrow means buy. All arrows comes with Alert  like for easy identification of trade signal. Are you okay with that? 1 minute candle 1 minute expire
CRT Multi-Timeframe Market Structure & Liquidity Sweep Indicator Non-Repainting | Multi-Asset | MT5 Version Available MT5 Version:   https://www.mql5.com/en/market/product/162075 Full User Guide — explains what each feature does and why:   https://www.mql5.com/en/blogs/post/767525 Quick Start User Guide  — explains how to configure and in what order:  https://www.mql5.com/en/blogs/post/767540 Indicator Overview CRT Ghost Candle HTF Fractal is a complete institutional-grade market structure too
Ea 555
Aleksandr Nadein
The EA works with pending orders.Recommended Currency Pair GPBUSD H1.With good market valontility gives a good profit.Advisor is fully automated for working in the market.It is also possible to use auto-management.It is possible to use the swap size, ideal for strong volatility or at night.When trading, two pending orders are placed, when one works, the second is deleted. Trading is not intermittent.
Green Frog EA
Ramzi Abuwarda
제목: 최고의 프로페셔널 EA 전문가 - 그린 프로그 EA 외환 거래의 세계에서는 시장이 빠르고 결정적으로 움직이기 때문에 신뢰할 수 있는 동반자가 있으면 큰 차이를 만들 수 있습니다. 그린 프로그 EA를 소개합니다. 최고의 프로페셔널 전문가 어드바이저(EA)로, 뛰어난 정확성과 효율성으로 트레이더들을 지원합니다. 그린 프로그 EA는 최첨단 기술적 발전과 외환 산업에서의 경험을 결합한 결과물입니다. 경험 많은 트레이더들과 소프트웨어 엔지니어들로 구성된 팀에 의해 개발되었으며, 꾸준한 결과를 제공하고 상당한 수익을 창출합니다. 그린 프로그 EA의 차별점은 변화무쌍한 시장 상황에 대응할 수 있는 능력입니다. 정교한 알고리즘과 실시간 데이터 분석을 기반으로, 이 EA는 신속하게 수익성 있는 기회를 식별하고 높은 정밀도로 거래를 실행합니다. EA의 지능적인 트레이딩 전략은 트렌드, 변동성이 큰 시장, 그리고 레인지 시장과 같은 다양한 시장 상황에서도 최적의 성과를 보장합니다. 그린
Deep Analyst Expert Advisor    (mt5  https://www.mql5.com/en/market/product/163998 ) Deep Analyst   is a professional analytical tool powered by a specialized algorithm designed for deep analysis of market cycles and price amplitude fluctuations. By analyzing market conditions over a specific timeframe, the Expert Advisor determines price strength and amplitude using a unique indicator system based exclusively on real-time data. When the global trend and its vector shift, the algorithm automati
Channel Arg Control
Vitalii Zakharuk
The Channel Arg Control indicator, in addition to lines, reflects entry signals in the form of arrows. But how to do that? At first glance, this is not an easy task. But not for the Channel Arg Control indicator, this indicator will tell you whether you have configured the indicator correctly, while you can specify the history interval in the bars that interests you. And yet, how does the indicator tell you? Look at the numbers on the chart near the arrows! This is exactly what you thought, the
Hammer Shooting Star v1.1 – Advanced Candlestick Pattern Scanner Author: LIANG1990 Are you searching for a reliable tool to identify market reversals with precision? Hammer Shooting Star v1.1  is a professional MT4 indicator designed to scan and detect high-quality Hammer and Shooting Star candlestick formations. Unlike basic pattern indicators, this tool applies multiple built-in filters (shape, size, trend alignment, and contextual conditions) to reduce false signals and highlight only the cle
MagicIshimoku
Evgeniy Zhdan
The trading robot works on the basis of determining price consolidation zones due to three overlapping Ishimoku indicator readings with different settings according to the Golden Ratio number. This analysis method allows you to predict price movement with high accuracy. Each position has Stop Loss and Take Profit. Each position is controlled by a short trailing stop. Recommended trading tools, 5m: EURUSD, GBPUSD, USDJPY, USDCAD. Settings: MaxRisk - Percentage risk for the calculation of the tr
Insight Investor: Advanced Multi-Currency Forex Trading Bot Introduction In the fast-paced world of Forex trading, having the right tools can significantly enhance your trading experience. Insight Investor is an advanced multi-currency trading bot designed to automate and optimize your trading operations. This expert advisor employs modern algorithms to analyze market conditions and execute trades, aiming to deliver consistent results while maintaining controlled risk levels. Key Features of Ins
Limitless MT4
Dmitriy Kashevich
Limitless MT4 is a universal indicator suitable for every beginner and experienced trader. works on all currency pairs, cryptocurrencies, raw stocks Limitless MT4 - already configured and does not require additional configuration And now the main thing Why Limitless MT4? 1 complete lack of redrawing 2 two years of testing by the best specialists in trading 3 the accuracy of correct signals exceeds 80% 4 performed well in trading during news releases Trading rules 1 buy signal - the ap
Precautions for subscribing to indicator This indicator only supports the computer version of MT4 Does not support MT5, mobile phones, tablets The indicator only shows the day's entry arrow The previous history arrow will not be displayed (Live broadcast is for demonstration) The indicator is a trading aid Is not a EA automatic trading No copy trading function The indicator only indicates the entry position No exit (target profit)  The entry stop loss point is set at 30-50 PIPS Or the front hi
The Smart Liquidation Clusters  is a custom technical indicator designed for the MetaTrader 4 (MT4) platform. It calculates and visualizes   estimated liquidation zones   based on price action and internal algorithms, displaying them as a dynamic heatmap on the chart. These zones represent   potential areas of liquidity concentration , where stop-loss clusters or liquidation events   may   occur. Please note: The levels shown are   model-based estimations   and   do not represent actual or guara
QuantumAlert Stoch Navigator is a free indicator available for MT4/MT5 platforms, its work is to provide "alerts" when the market is inside "overbought and oversold" regions in the form of "buy or sell" signals. This indicator comes with many customization options mentioned in the parameter section below, user can customise these parameters as needful. Join our   MQL5 group , where we share important news and updates. You are also welcome to join our private channel as well, contact me for the p
FREE
Sweet Waffle
Christophe Godart
The arrows are calculated with: -     2 Parabolic  parameters -     2 ADX parameters -     4 Stochastic parameters We recommend to combine it with Parabolic, ZigZag or Elliot waves indicator. Always trade the trend! If you make sure to draw your trend lines and support/resistance zones you will just have to wait for the signal to appear. Take the trade. For Binary Options it is advisable to set the expiry time to 5-15 min in M1 chart. THIS INDICATOR IS ZERO REPAINT Best assets to trade: - EUR
UT Bot Alerts for MT4
Ulises Calderon Bautista
UT Bot Alerts — Sistema de Trailing Stop baseado em ATR Conversão fiel do lendário indicador "UT Bot Alerts" de QuantNomad do TradingView para MQL5 e MQL4. Conceito original de HPotter, implementação inicial de Yo_adriiiiaan, versão Pine Script v4 com alertas de QuantNomad (Vadim Cissa) — um dos desenvolvedores quantitativos mais seguidos no TradingView com mais de 100 mil seguidores. O script original acumulou mais de 1,1 milhão de visualizações e 35.500 favoritos no TradingView, tornando-o um
FREE
Hurst Buy and Sell Mt4
Victor Alfonso Molina Botello
Hurst Buy and Sell  This innovative indicator, inspired by xAI Grok intelligence, uses the Hurst exponent to identify the nature of the market and generate buy/sell signals. The EA for this indicator (Hurst Razer PRO EA MT5) is now available, you can see it by clicking here!  https://www.mql5.com/es/market/product/153441?source=Site+Profile+Seller  If you want more signals from the indicator, change the minimum number of bars between consecutive signals. The lower the value, the more signals it
FREE
Trend driver bars is the manual trading system, which defines current trend continue or it's pull-back/reverse. "Driver" bars - are price action patterns that has powerfull affect on market, defining it's near future direction. Generally, driver bars represents trend "skeleton" and often anticipates new market impulse. System plots arrows when market shows 3 pattenrs in a row(most powerfull combo-pattern), and makes fast scalping of incomming movement. Loss positions closes by common profit. Lot
Trend Gap Indicator
Roberto Alexander Quan
A Gap often occurs when the price moves with "strength" in a given direction (either up or down).  This Gap is formed when, in looking at 3 consecutive candles, the wicks of the 1st and 3rd candles do not overlap.  When this happens, the indicator creates a rectangle where the Gap is located. It identifies a zone where the price could potentially go back to (mitigation).   The Gap/rectangle is mitigated when the price returns and completely covers the rectangle. Note that the indicator also show
OFFER!   OFFER ! After 3 weeks the unlimited price will be 500$ and in the future you will regret why you didn't make a purchase at this lowest price. Dear Traders, the atomic power Entries Indicator is one of the indicators that if used wisely and correctly can help you to find an edge over the market.  The indicator will work for all forex pairs, all markets and all timeframes. Still it is your duty to find the most effective timeframe for you. When the sell or buy arrow appears you will get a
Multi Timeframe ZigZag Indicator
Salman A A A T Bakhash
5 (2)
Description: This indicator draw ZigZag Line in multiple time frame also search for Harmonic patterns before completion of the pattern. Features: Five instances of ZigZag indicators can be configured to any desired timeframe and inputs. Draw Harmonic pattern before pattern completion. Display Fibonacci retracement ratios. Configurable Fibonacci retracement ratios. Draw AB=CD based on Fibonacci retracement you define. You can define margin of error allowed in Harmonic or Fibonacci calculations
FREE
Railis
Vasiliy Luka
Долгосрочный,  эксперт. Эксперт может открывать  ордера в обе стороны. Он уникален тем что каждый ордер работает только с амим сабой и не путается с другими. Когда открытые ордера создают первый уровень без убытка, открываются стопы на определенном уровне,максимально приближон к текущей цене. Убыточный ордер ставит противоположный запоминая убыок и открывает стопы при достижении прибыльности -  Profit=1;.  Каждый ордер запомипает свой баланс на определенном уровне  -  Min Dist=200; Поставте в па
DSS Signal AM
Andrii Matviievskyi
This indicator displays DSS Oscillator AM signals on the price chart. The calculation of DSS Oscillator AM values is similar to the stochastic indicator. The confirmation of the indicator's signal is the overcoming by the price of the high/low of the bar on which the signal was given by the indicator. Settings: Price - the price at which the indicator is calculated; EMA_Period - smoothing period; Stoch_Period - oscillator period; OB_Level - overbought level; OS_Level - oversold level; Show_Move
FREE
KingMaker Ultimate Scalper Expert Advisor TimeFrame - 5 Mins Minimum Balance - 200$ Pairs - Major Currency Pairs , Like - EURUSD, GBPUSD, USDJPY .... etc Run Low Spread Forex Broker Or ECN Broker Money Management Adjust Risk Management SafeMode - True/False Setting : You Have Deposit 200$ , Run EA On 2 or 3 Currency Pairs Only  Automatic Increase And Decrease Lot Size 
이 제품의 구매자들이 또한 구매함
Miraculous Indicator – Gann Square of Nine 기반 100% 비리페인트 Forex 및 바이너리 도구 이 영상은 Miraculous Indicator 를 소개합니다. 이 지표는 Forex 및 바이너리 옵션 트레이더를 위해 특별히 개발된 매우 정확하고 강력한 트레이딩 도구입니다. 이 지표가 독특한 이유는 전설적인 **Gann Square of Nine(Gann 9의 사각형)**과 **Gann's Law of Vibration(Gann 진동의 법칙)**에 기반을 두고 있기 때문입니다. 이는 현대 트레이딩에서 가장 정밀한 예측 도구 중 하나로 손꼽힙니다. Miraculous Indicator는 완전히 비리페인트(non-repaint) 됩니다. 즉, 캔들이 마감된 후에도 신호가 변경되거나 사라지지 않습니다. 보이는 것이 곧 결과입니다. 이는 트레이더가 자신감을 가지고 거래에 진입하고 청산할 수 있는 신뢰할 수 있고 일관된 기반을 제공합니다. 주요 특징: Gann
FFx Engulfing Setup Alerter gives trade suggestions with Entry, Target 1, Target 2 and StopLoss. Below are the different options available: Entry suggestion - pips to be added over the break for the entry 3 different options to calculate the SL - by pips, by ATR multiplier or at the pattern High/Low 3 different options to calculate the 2 TPs - by pips, by ATR multiplier or at Risk/Reward Offset the dashboard - any place on the chart Remove the suggestion once the price reached the SL line Lines
FFx InsideBar Setup Alerter gives trade suggestions with Entry, Target 1, Target 2 and StopLoss. Below are the different options available: Entry suggestion - pips to be added over the break for the entry Minimum candle size - to avoid too close buy/sell entry suggestions 3 different options to calculate the SL - by pips, by ATR multiplier or at the pattern High/Low 3 different options to calculate the 2 TPs - by pips, by ATR multiplier or at Risk/Reward Offset the dashboard - any place on the c
FFx OutsideBar Setup Alerter gives trade suggestions with Entry, Target 1, Target 2 and StopLoss. Below are the different options available: Entry suggestion - pips to be added over the break for the entry. 3 different options to calculate the SL - by pips, by ATR multiplier or at the pattern High/Low. 3 different options to calculate the 2 TPs - by pips, by ATR multiplier or at Risk/Reward. Offset the dashboard - any place on the chart. Remove the suggestion once the price reached the SL line.
FFx PinBar Setup Alerter gives trade suggestions with Entry, Target 1, Target 2 and StopLoss. Below are the different options available: Entry suggestion - pips to be added over the break for the entry Minimum candle size - to avoid too small candles 3 different options to calculate the SL - by pips, by ATR multiplier or at the pattern High/Low 3 different options to calculate the 2 TPs - by pips, by ATR multiplier or at Risk/Reward Offset the dashboard - any place on the chart Remove the sugges
FFx MACD Divergences
Eric Venturi-Bloxs
The purpose of this new version of the MT4 standard indicator provided in your platform is to display in a sub-window multiple timeframes of the same indicator with its divergences. See the example shown in the picture below. But the display isn't like a simple MTF indicator. This is the real display of the indicator on its timeframe. Here's the options available in the FFx divergences indicator: Select the timeframes to be displayed (M1 to Monthly) Define the width (number of bars) for each tim
FFx RSI Divergences
Eric Venturi-Bloxs
The purpose of this new version of the MT4 standard indicator provided in your platform is to display in a sub-window multiple timeframes of the same indicator with its divergences. See the example shown in the picture below. But the display isn't like a simple MTF indicator. This is the real display of the indicator on its timeframe. Here's the options available in the FFx divergences indicator: Select the timeframes to be displayed (M1 to Monthly) Define the width (number of bars) for each tim
FFx CCI Divergences
Eric Venturi-Bloxs
The purpose of this new version of the MT4 standard indicator provided in your platform is to display in a sub-window multiple timeframes of the same indicator with its divergences. See the example shown in the picture below. But the display isn't like a simple MTF indicator. This is the real display of the indicator on its timeframe. Here's the options available in the FFx divergences indicator: Select the timeframes to be displayed (M1 to Monthly). Define the width (number of bars) for each ti
The FFx Dashboard MTF alerter will show you on a single chart all the timeframes (M1 to Monthly) with their own status for the indicator. 2 Alert Options: Single timeframe: each selected timeframe alert separately when a signal occurs Multi timeframes: all selected timeframes must agree for an alert to be triggered Both options have an input to select the timeframes to be used for the alert(s). How to Understand the Status: Green/Red square: histogram above/below 0 line Green square + Red bord
The FFx Dashboard MTF alerter will show you on a single chart all the timeframes (M1 to Monthly) with their own status for the indicator. 2 Alert Options: Single timeframe: each selected timeframe alert separately when a signal occurs Multi timeframes: all selected timeframes must agree for an alert to be triggered Both options have an input to select the timeframes to be used for the alert(s). How to understand the status: Green/Red square: RSI above/below 50 line Green square + Red border: R
The FFx Dashboard MTF alerter will show you on a single chart all the timeframes (M1 to Monthly) with their own status for the indicator. 2 Alert Options: Single timeframe: each selected timeframe alert separately when a signal occurs Multi timeframes: all selected timeframes must agree for an alert to be triggered Both options have an input to select the timeframes to be used for the alert(s). How to understand the status: Green/Red square: Stoch above/below 50 line Green square + Red border:
The FFx Dashboard MTF alerter will show you on a single chart all the timeframes (M1 to Monthly) with their own status for the indicator. 2 Alert Options: Single timeframe: each selected timeframe alert separately when a signal occurs Multi timeframes: all selected timeframes must agree for an alert to be triggered Both options have an input to select the timeframes to be used for the alert(s). How to understand the status: Green/Red square: Price above/below Cloud (Kumo) Green square + Red bo
The FFx Dashboard MTF alerter will show you on a single chart all the timeframes (M1 to Monthly) with their own status for the indicator. 2 Alert Options: Single timeframe: each selected timeframe alert separately when a signal occurs Multi timeframes: all selected timeframes must agree for an alert to be triggered Both options have an input to select the timeframes to be used for the alert(s). How to understand the status: Green/Red square: MA pointing Up/Down Green square + Red border: MA po
The FFx Dashboard MTF alerter will show you on a single chart all the timeframes (M1 to Monthly) with their own status for the indicator. 2 Alert Options: Single timeframe: each selected timeframe alert separately when a signal occurs. Multi timeframes: all selected timeframes must agree for an alert to be triggered. Both options have an input to select the timeframes to be used for the alert(s). How to understand the status: Green square: Price above PSAR Red square: Price below PSAR Options
The FFx Dashboard MTF alerter will show you on a single chart all the timeframes (M1 to Monthly) with their own status for the indicator. 2 Alert Options: Single timeframe: each selected timeframe alert separately when a signal occurs Multi timeframes: all selected timeframes must agree for an alert to be triggered Both options have an input to select the timeframes to be used for the alert(s). How to understand the status: Green/Red square: CCI above/below levels (ie. 100/-100) Grey square: C
The FFx Dashboard MTF alerter will show you on a single chart all the timeframes (M1 to Monthly) with their own status for the indicator. 2 Alert Options: Single timeframe: each selected timeframe alert separately when a signal occurs Multi timeframes: all selected timeframes must agree for an alert to be triggered Both options have an input to select the timeframes to be used for the alert(s). How to understand the status: Green/Red square: ADX above level Grey square: ADX below level Red bor
The FFx Dashboard MTF alerter will show you on a single chart all the timeframes (M1 to Monthly) with their own status. 2 Alert Options: Single timeframe: each selected timeframe alert separately when a signal occurs Multi timeframes: all selected timeframes must agree for an alert to be triggered Both options have an input to select the timeframes to be used for the alert(s). How to understand the status: Green/Red square: bullish/bearish candle Options available in the FFx Dashboard Alerter
THE GRAFF III
Antonin Skaryd
The [GRAFF] III manual trading system is based on multiple MetaTrader (MT4) indicators. Together, the entire PACK of GRAFF III indicators makes an advanced trading tool. The system consists of over 20 different custom-built indicators which have been carefully selected and tested in the long term to produce strong and efficient trading signals. The particular indicators are based on different mathematical formulas, so the entire system is calibrated to remove false signals from its own indicator
FFx Universal Strength Meter PRO is more than a basic strength meter. Instead of limiting the calculation to price, it can be based on any of the 19 integrated strength modes + 9 timeframes. With the FFx USM, you are able to define any period for any combination of timeframes. For example, you can set the dashboard for the last 10 candles for M15-H1-H4… Full flexibility! Very easy to interpret... It gives a great idea about which currency is weak and which is strong, so you can find the best pai
Pan PrizMA CD Phase is an analogue of the МetaТrader 5 indicator , and is an option based on the Pan PrizMA indicator. Details . Averaging by a quadric-quartic polynomial increases the smoothness of lines, adds momentum and rhythm. Extrapolation by the sinusoid function near a constant allows adjusting the delay or lead of signals. The value of the phase - wave status parameter (which is close in meaning to the trigonometric phase or the angle of the radius-vector rotation in the trigonometric p
FFx Basket Scanner
Eric Venturi-Bloxs
MetaTrader 5 version available here : https://www.mql5.com/en/market/product/24882 FFx Basket Scanner is a global tool scanning all pairs and all timeframes over up to five indicators among the 16 available. You will clearly see which currencies to avoid trading and which ones to focus on. Once a currency goes into an extreme zone (e.g. 20/80%), you can trade the whole basket with great confidence. Another way to use it is to look at two currencies (weak vs strong) to find the best single pairs
NostradamusMT4
Andrey Spiridonov
1 (1)
NostradamusMT4 is a powerful indicator from the set of professional trader. The indicator is based on Andrei Spiridonov's original price calculation method (ESTIMATED PRICE) for the current candle price. Advantages The indicator does not redraw. It works on any timeframes. Works with any trading instruments. Perfectly suitable for scalping and trading binary options. Parameters Color - color of the ESTIMATED PRICE FUTURE line. How to work with the indicator The indicator forms the ESTIMATED P
FFx Pivot SR Suite PRO
Eric Venturi-Bloxs
MetaTrader 5 version available here: https://www.mql5.com/en/market/product/25794 FFx Pivot SR Suite PRO is a complete suite for support and resistance levels. Support and Resistance are the most used levels in all kinds of trading. Can be used to find reversal trend, to set targets and stop, etc. The indicator is fully flexible directly from the chart 4 periods to choose for the calculation: 4Hours, Daily, Weekly and Monthly 4 formulas to choose for the calculation: Classic, Camarilla, Fibonac
REX complete 3in1
Christophe Godart
This is the complete REX package. It consists of the lite, pro and ULTRA version.  Perfect for beginners and intermediates. REX complete is 100% non repaint. The strategy is based on a mix of different strategies, statistics, including pivot points, oscillators and patterns.  As the trading idea consists of a variety of some classic indicators like Momentum, Williams Percent Range, CCI, Force Index, WPR, DeMarker, CCI, RSI and Stochastic, it is clear that the fundamental indicators have being u
Let´s try to make some real money! Call me profit addicted. I thought why not try to make THE dream come reality. With discipline, a clear strategy and this indicator I focus on entering the perfect trades. This indicator is very easy to use as you will get perfect entry points for Put or Call trades. The arrows are calculated with: -     Momentum  parameters -     Candle stick patterns -     Fundamental Price action We recommend to combine it with Parabolic, ZigZag or Elliot waves indicator
Pisces TheProfitZone
Nuttawut Khiawkiri
Pisces TheProfitZone "Pisces TheProfitZone MT4 Indicator Powered byFxGangster" This indicator will calculate new support and resistant zone everyday, and that give us a trading zone such as thats telling us TP and SL, So it still telling us for where should the price will go reach? Fore Example. Uptrend : If Price can stay upper a Line and price close higher above a Line, then the price will continue go up to reach next Line. Downtrend : If Price can't pass to stay upper a Line and the price
Golden Chip
Daishon Cotman
Golden Chip provides Basic Market Structure, Fibonacci, supply and Demand Zones. Letting you identify when a sell off point is approaching or whne a buy opportunity is arriving. The awesome thing about Golden Chip is that, you will see rejection levels or continuation before ANYBODY ! This indicator moves directly with price and lines up perfectly with the Chart. Some indicators would lag but NOT this one ! Golden Chip is amazing for Clean chart (Naked Chart). GOLDEN CHIP IS ONLY ON METATRADER (
Seconds timeframe generator for MT4  (S1, S5, S10, S15, S20, S30). Features  1. Indicator generates timeframes in real time, with each new tick on the spot. 2. Indicator is also measuring point distance from extreme to extreme when hovered "This additionally shows us how strong movements are". Advantages 1. Easy to spot best entry and exit points. 2. You can easily trade news releases where market is very volatile. 3. You can also easily trade very slow market conditions and spot tre
필터:
리뷰 없음
리뷰 답변