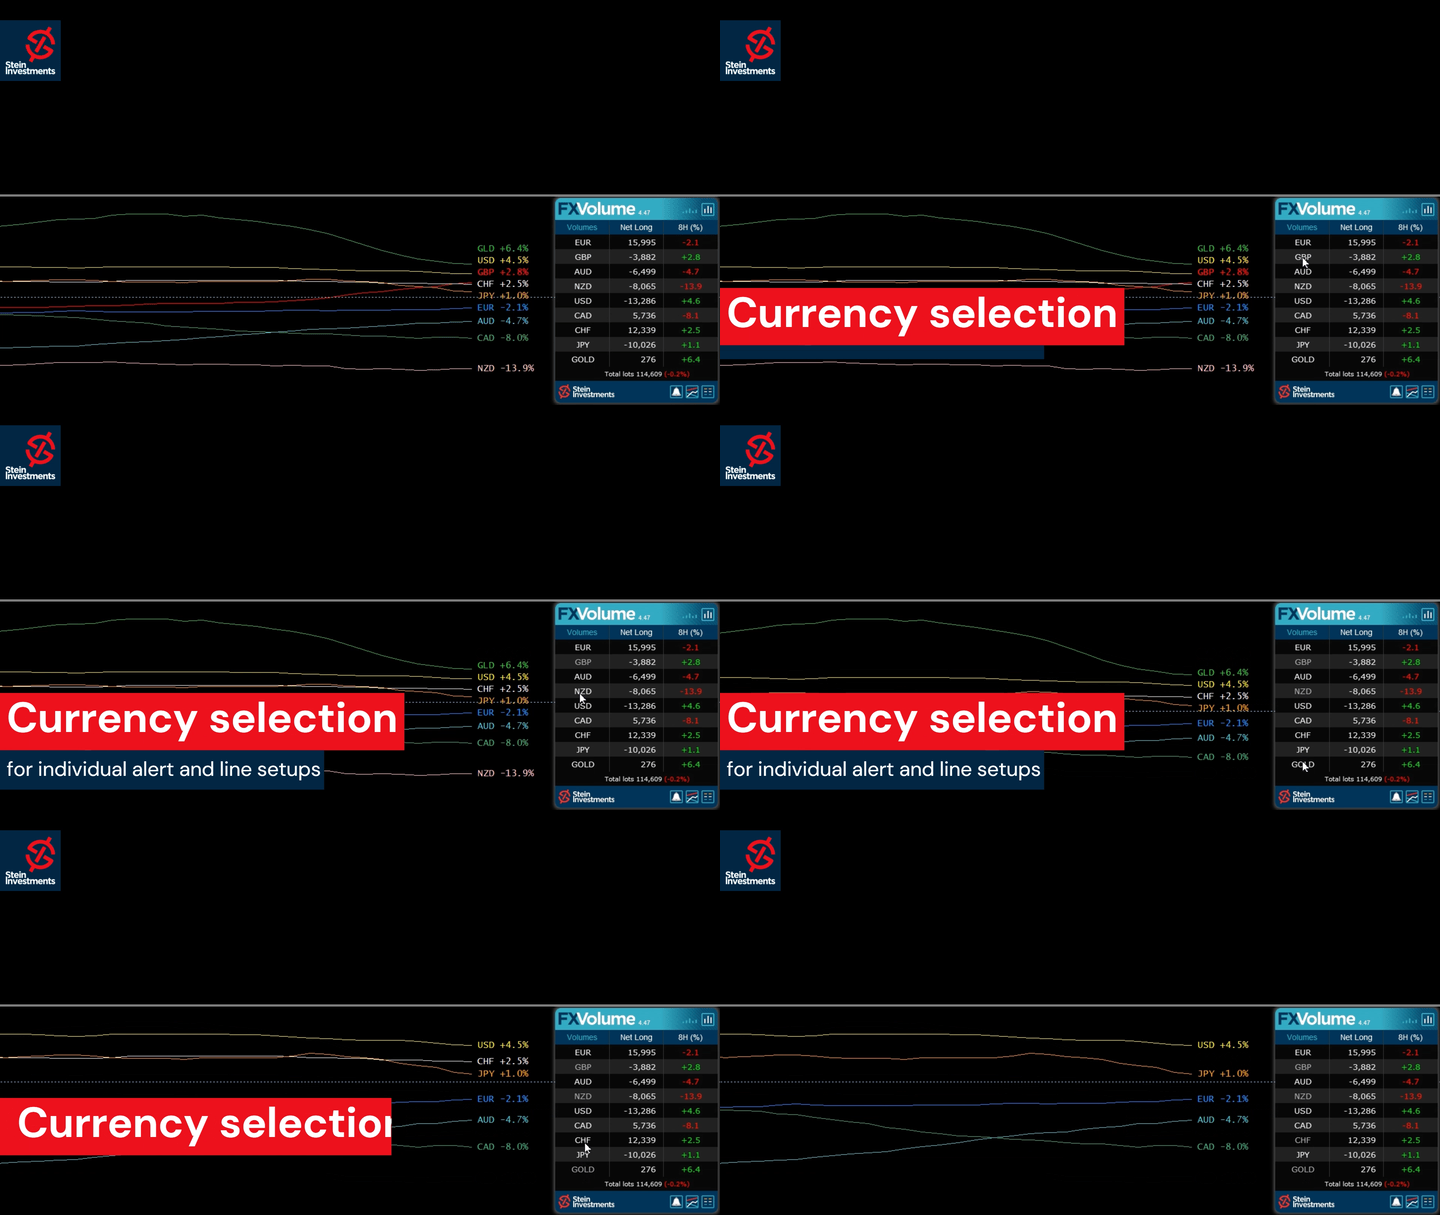
• 概述
  • 评论 (36)
  • 评论 (186)
  • 新特性

FX Volume

4.6

通过mql5Telegram 上"晨间简报 "获取每日市场更新,包括详细信息和屏幕截图

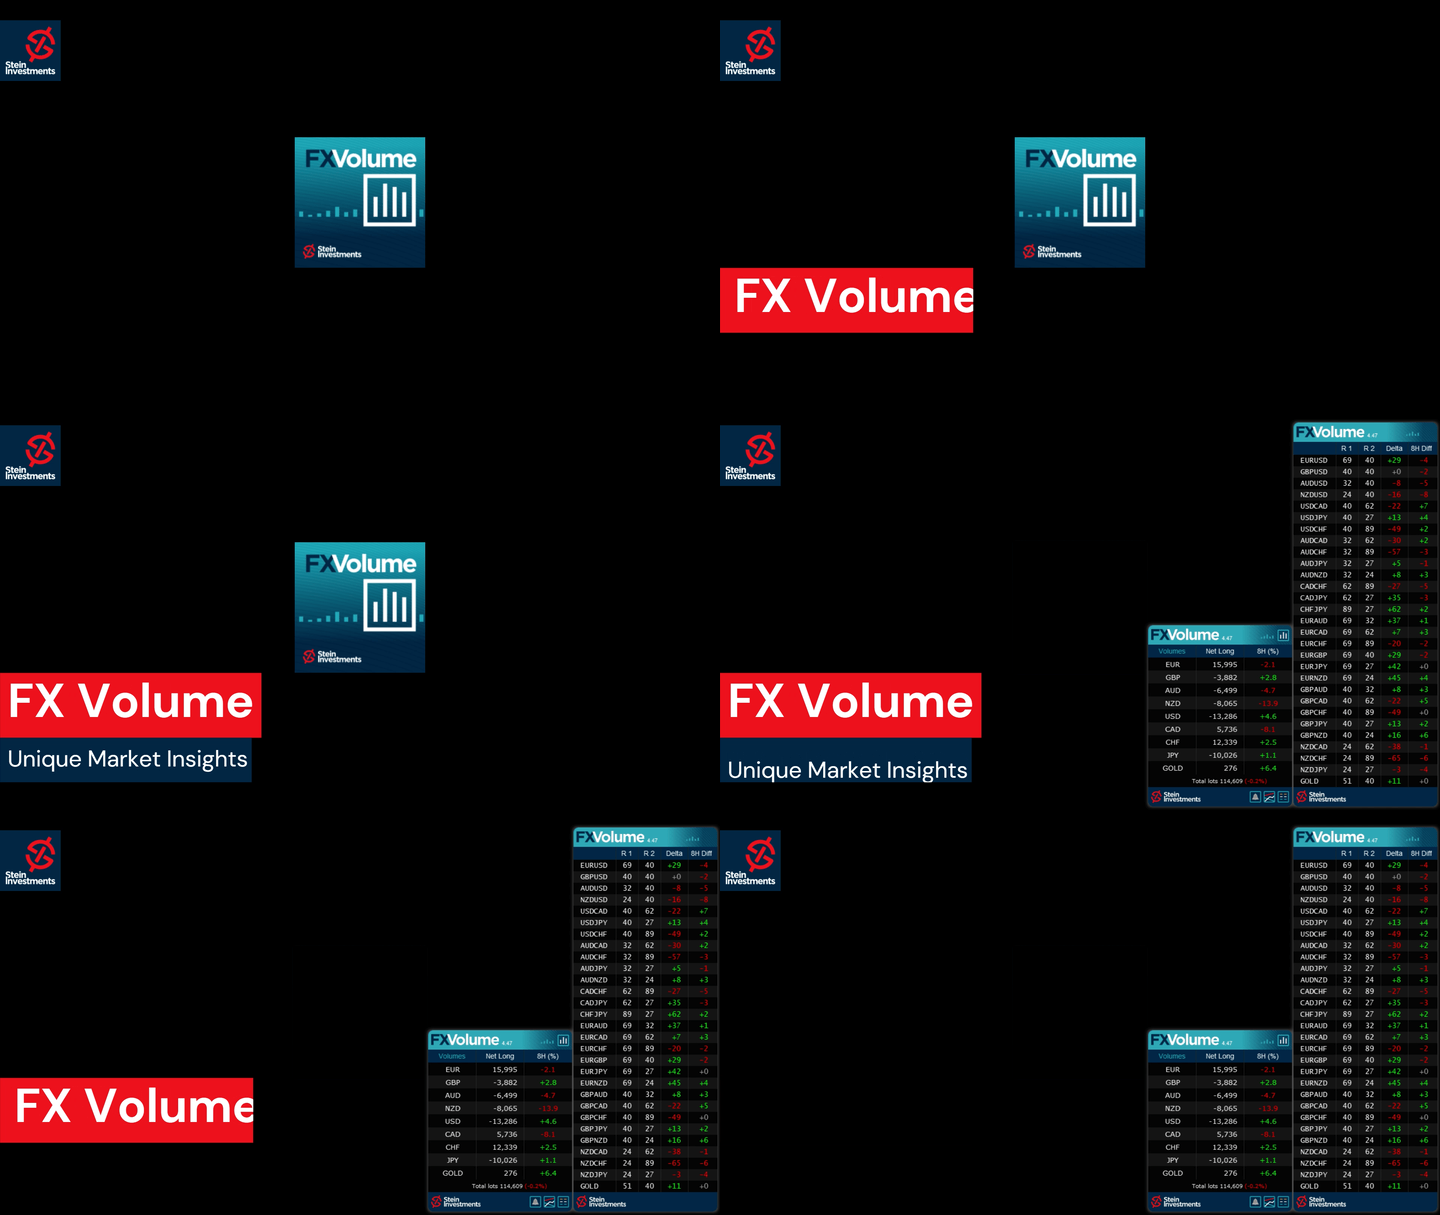
外汇交易量(FX Volume)是第一个也是唯一一个从经纪商角度真正洞察市场情绪的交易量指标。


直接在您的图表上看到这些信息是真正改变游戏规则和突破性的交易解决方案。

受益于独特的市场数据洞察,如

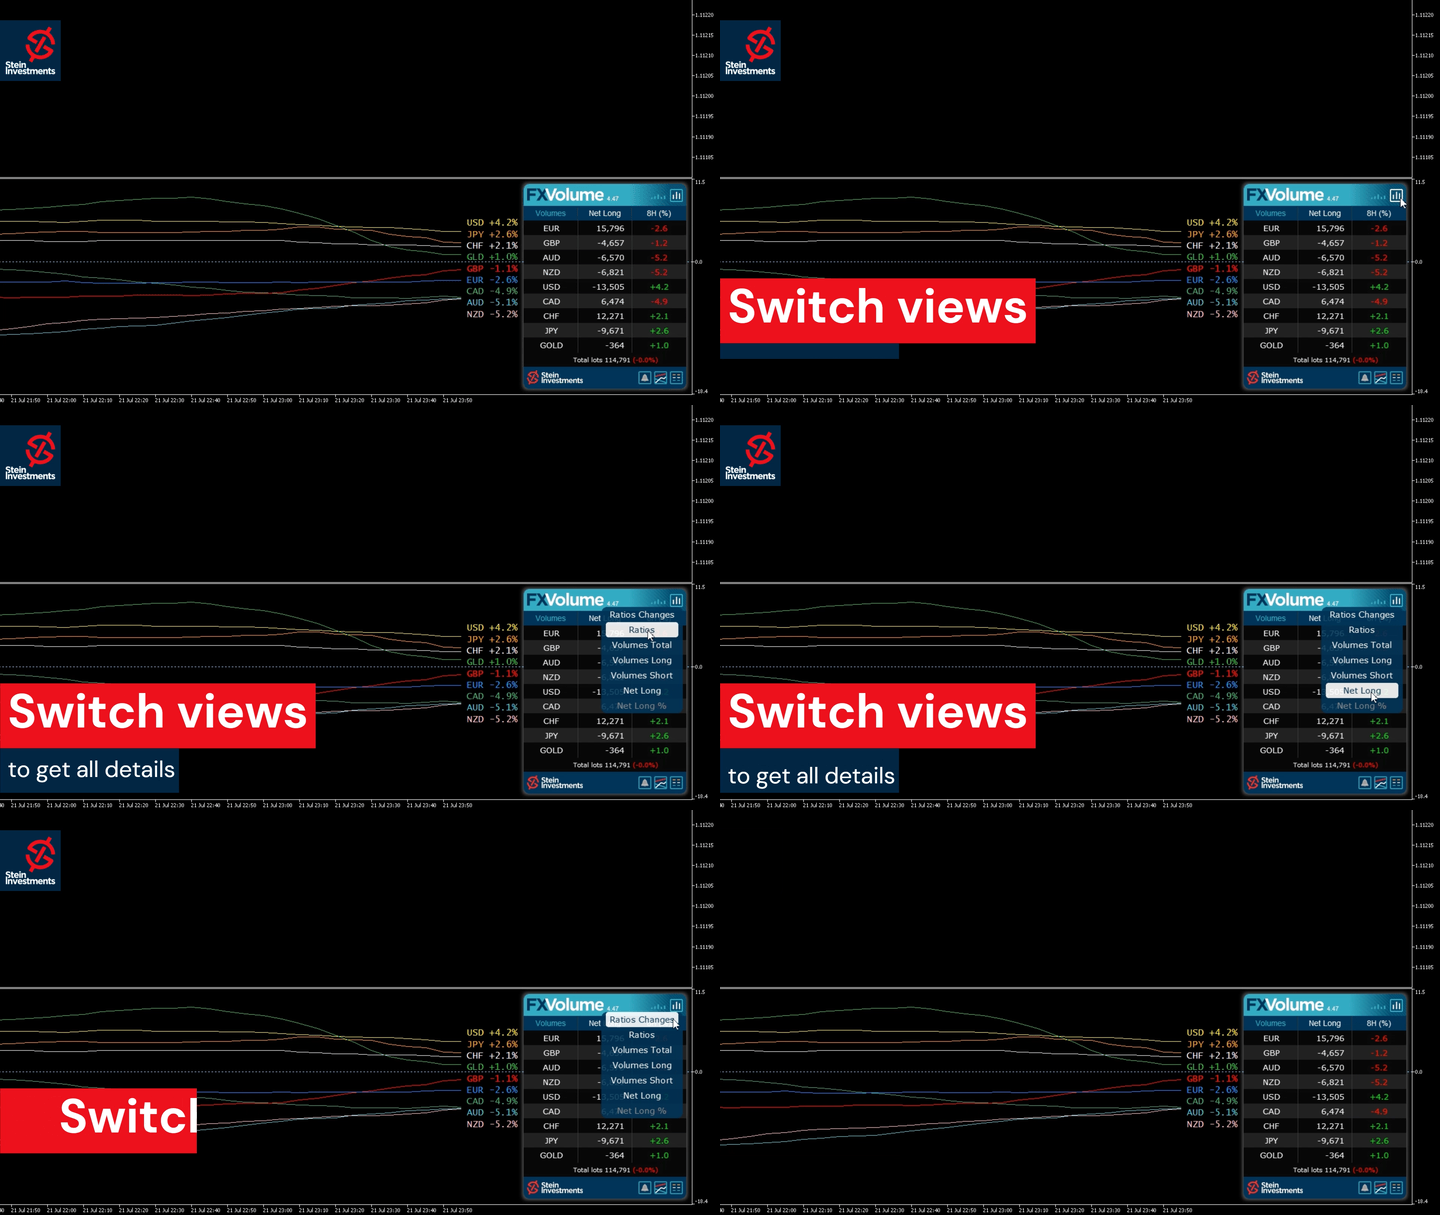
  • 比率(Ratios)显示货币多头和空头头寸的比率(百分比
  • 比率变化显示所选时间段内的多头比率及其百分比变化
  • 总交易量显示货币的总交易量(多头和空头),以手为单位
  • 多头交易量显示货币所有多头头寸的交易量
  • 空头交易量显示所有货币空头头寸的交易量
  • 净多头显示净多头交易量,即所有多头头寸减去所有空头头寸(以手为单位)。
  • 净多头百分比显示货币净多头交易量的变化

请阅读我们的基本教程 -> "如何使用外汇交易量进行交易"

获取更多信息,如常见问题、交易技巧和教程视频,请访问我们的 外汇交易量公共信息频道

安装并运行 SI Connect 以建立与我们数据中心的持续连接


背景信息

我们都知道,外汇是一个分散的市场。这就是为什么我们必须打破常规思维,开发一个独特的解决方案,并编写有史以来最复杂的项目代码,以便在我们的图表中获得这些无价信息。自 2018 年 10 月以来,我们的服务器分析并记录来自世界各地多个不同来源的真实交易量数据。我们收集数据,分析交易量如何变化,并计算出最重要外汇交易货币的指数,但这仅仅是个开始。稍后,我们还将为黄金和石油等其他交易工具提供此类信息。


使用斯坦因投资公司提供的真实交易量数据有什么好处?

1.由于我们经纪人的观点,您可以轻松地与聪明资金进行交易
2.您可以直接在图表上实时获取此类市场情绪数据
3.通过我们实时记录的历史数据库,您可以轻松查看这些信息的价值。

FX Volume 绝对是独一无二的,因为它是唯一能够直接在图表上打印此类数据的工具!


为什么只能租用?

如上所述,FX Volume 是一项持续性服务,其后台基础设施的运行需要成本,管理员和编码员也需要成本,他们负责监控和改进整个结构,如后台数据库和您在图表上加载的图形前端。

这就是为什么我们必须收取合理的经常性费用,但 FX Volume 可以轻松收回成本。
除此之外,我们还为中长期订阅用户提供优惠折扣。


外汇交易量指标设置

  • 经纪商夏令时区和格林尼治标准时间转换 - 请谷歌或咨询您的经纪商支持人员以获得正确的值
  • 与 X 小时前比较 - 为比率和三角洲比较设置一个小时值。默认值为 24 小时前。
  • 显示所有历史行 - 设置为 "false",只查看符号相关货币的历史行。
  • 默认视图 - 在 "比率 "和 "变化 "视图之间进行选择
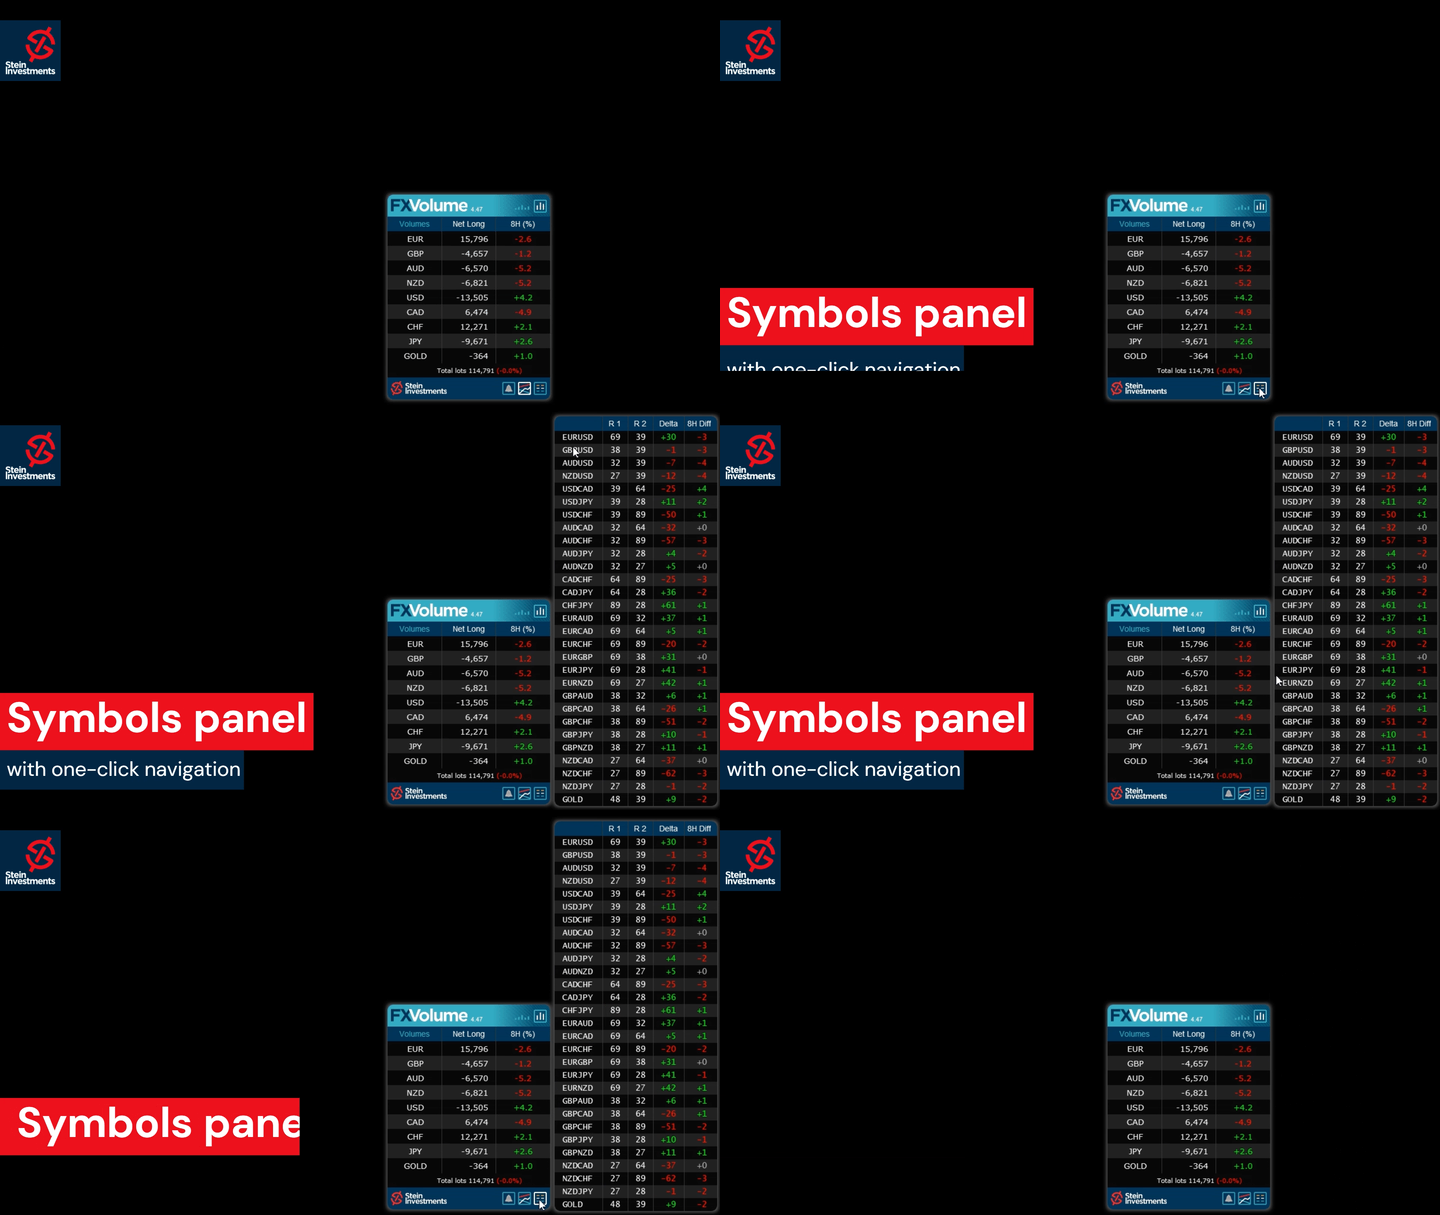
  • 显示符号列表 - 设置为 "false" 可以隐藏主图表中的 28 种符号列表。
  • 缩放系数 - 增大或缩小所有图形元素的大小


您想成为持续盈利的五星级外汇交易商吗?

那就 获取我们的 Stein Investments 交易工具 ,并发送截图给我们,我们将邀请您与 500 名会员进行独家交易聊天。


评论 20
Ingo Reimann
178
Ingo Reimann 2023.12.21 16:13 
 

The best and most precise product that I have had the pleasure of getting to know in my trading career. I can recommend it to everybody. Since I started using these products, trading has also been working. The support from the developers and the community are also in a class of their own.

3316589p
865
3316589p 2022.08.29 20:34 
 

Hi Daniel, Great indicator used in conjunction with Fx Power, an invite for the the chat group would be appreciated

wuzzy66
853
wuzzy66 2022.07.02 09:41 
 

Another excellent product from Daniel who is the creator this indicator lets you make informed Decision ASAP when you know the volume of the trade is been concentrated on tried it on Gold excellent it showed be that there was more volume on the Dollar than Gold and took straight a sell position which paid off no more guess work with this indicator combing it other tools such as the FX power

推荐产品
BoxChart MT4
Evgeny Shevtsov
4.57 (7)
The market is unfair if only because 10% of participants manage 90% of funds. An ordinary trader has slim changes to stand against these "vultures". This problem can be solved. You just need to be among these 10%, learn to predict their intentions and move with them. Volume is the only preemptive factor that faultlessly works on any timeframe and symbol. First, the volume appears and is accumulated, and only then the price moves. The price moves from one volume to another. Areas of volume accumu
33 USD
A technical indicator that calculates its readings on trading volumes. In the form of a histogram, it shows the accumulation of the strength of the movement of the trading instrument. It has independent calculation systems for bullish and bearish directions. Works on any trading instruments and time frames. Can complement any trading system. The indicator does not redraw its values, the signals appear on the current candle. It is easy to use and does not load the chart, does not require additi
79 USD
Blahtech Market Profile
Blahtech Limited
4.61 (18)
Was: $249  Now: $99   Market Profile defines a number of day types that can help the trader to determine market behaviour. A key feature is the Value Area, representing the range of price action where 70% of trading took place. Understanding the Value Area can give traders valuable insight into market direction and establish the higher odds trade. It is an excellent addition to any system you may be using. Blahtech Limited presents their Market Profile indicator for the MetaTrader community. Ins
99 USD
Volume by Price MT4
Brian Collard
5 (13)
Was: $259 Now: $120 — The Volume by Price Indicator for MetaTrader 4 features Volume Profile and Market Profile TPO (Time Price Opportunity). Get valuable insights out of currencies, equities and commodities data. Gain an edge trading financial markets. Volume and TPO histogram bar and line charts. Volume Footprint charts. TPO letter and block marker charts including split structures. Versatile segmentation and compositing methods. Static, dynamic and flexible ranges with relative and/or absolu
120 USD
Blahtech Supply Demand
Blahtech Limited
4.63 (35)
Was: $299  Now: $99   Supply Demand uses previous price action to identify potential imbalances between buyers and sellers. The key is to identify the better odds zones, not just the untouched ones. Blahtech Supply Demand indicator delivers functionality previously unavailable on any trading platform. This 4-in-1 indicator not only highlights the higher probability zones using a multi-criteria strength engine, but also combines it with multi-timeframe trend analysis, previously confirmed swings
99 USD
Strong Support
Vasiliy Strukov
5 (23)
支撑位和阻力位长期以来一直是市场分析的有力工具。 强支撑指标绘制基于本地价格最低值的支撑水平,以及基于本地价格最大值的阻力水平。  我的其他发展可以在这里查看 建议与趋势指标一起使用,例如黄金-这将允许您根据趋势进行交易,同时确定整合或趋势反转区域,以及在支撑位和阻力位设置止损和获利。 购买后立即与我联系,以获得设置和个人奖金!  传入参数 - 指示器不需要复杂的设置,主要参数是色标的调整。 支撑位和阻力位长期以来一直是市场分析的有力工具。 强支撑指标绘制基于本地价格最低值的支撑水平,以及基于本地价格最大值的阻力水平。  我的其他发展可以在这里查看 建议与趋势指标一起使用,例如黄金-这将允许您根据趋势进行交易,同时确定整合或趋势反转区域,以及在支撑位和阻力位设置止损和获利。 购买后立即与我联系,以获得设置和个人奖金!  传入参数 - 指示器不需要复杂的设置,主要参数是色标的调整。
30 USD
VolumeProfile
Robert Hess
3.8 (5)
Descption: The Volume Profile displays detailed informations of historical trading activities at certain price levels (Market Profile). So you can locate the areas with the best prices in the market and get an advantage about other market participants. Support: Please do not hesitate to contact me via the MQL5 Platform. I am very grateful about any Bug report, so that i can constantly improve the indicator. I also appreciate any public review for this product.  Features: Customizable Volume
99 USD
History Pattern Search
Yevhenii Levchenko
该指标建立当前报价,可以与历史报价进行比较,并在此基础上进行价格走势预测。指示器有一个文本字段,用于快速导航到所需日期。 选项: 符号 - 选择指标将显示的符号; SymbolPeriod - 选择指标从中获取数据的时段; IndicatorColor - 指示器颜色; HorisontalShift - 由指标绘制的报价移动指定的柱数; Inverse - true 反转引号,false - 原始视图; ChartVerticalShiftStep - 图表垂直移动(键盘上的向上/向下箭头); 接下来是文本字段的设置,您可以在其中输入日期,您可以通过按“回车”立即跳转到该日期。 接下来是文本字段的设置,您可以在其中输入日期,您可以通过按“回车”立即跳转到该日期。
55 USD
Time Bubble
Ahmed Mohamed
Time Bubble ***Specialized for GBPJPY 1H time frame*** (tested for two years with success rates about 82%) Time Circle's smart algorithm detects the price circles with time . give strong signals at the right time as result of combine the price and time. our team spent months to develop this indicator specially for GBPJPY ..with high success rates about 82% win trades over two years .tested from December 2016 to November 2018. *** in last two years total signals 1012 with 829 Wins and
40 USD
Market Profile 3
Hussien Abdeltwab Hussien Ryad
4 (4)
Market Profile 3 MetaTrader 4 indicator  — is a classic Market Profile implementation that can show the price density over time, outlining the most important price levels, value area, and control value of a given trading session. This indicator can be attached to timeframes between M1 and D1 and will show the Market Profile for daily, weekly, monthly, or even intraday sessions. Lower timeframes offer higher precision. Higher timeframes are recommended for better visibility. It is also possible t
FREE
UPD1 Profile Levels
Vitaliy Kuznetsov
5 (6)
该指标在指定柱数的工作直方图上找到最大和最低价格量(市场概况)的水平。   复合型材 。 柱状图的高度是全自动的,并适应任何仪器和时间框架。 作者的算法被使用,并且不重复众所周知的类似物。 两个直方图的高度近似等于蜡烛的平均高度。 智能警报将帮助您了解有关交易量水平的价格。 概念Smart Money   。 Low Volume - Imbalance. 用于寻找良好的市场环境,确定市场结构并作为二元期权的过滤器。 它是价格的磁铁。 High Volume - Liquidity. 用于退出累积时的测试。 输入参数   。 基本   。 Bars Count - 要计数和显示的条数   。 Signal Fractal = 5 (对于颜色信号电平)。 水平将在以下条件下成为信号:顶部和底部有五个直方图不超过它   。 Min Candles For High Volume Level - 在水平蜡烛的最小数量,以便它可以成为一个信号   。 按钮设置   。 Visual Button - 按钮显示(启用/禁用)   。 Corner - 按钮的卡角   。 X i
45 USD
AQ XFifteen
HIT HYPERTECH INNOVATIONS LTD
4.36 (11)
Χ15 indicator is a MetaTrader 4 tool that allows you to BUILD & BACKTEST ON REAL TIME your own strategies quickly, easily and efficiently. It contains 15 of the most popular technical analysis indicators that you can use, each one in a different way. Choose the indicators that you want to use, select how you will use them and you will see on the chart BUY (green) and SELL (red) arrows implementing your strategy. Choose Take Profit and Stop Loss and you will see the results of your strategy with
FREE
The Chaikin Oscillator is a technical indicator developed by Marc Chaikin that combines price and volume data to measure the accumulation and distribution of a financial instrument. It aims to identify potential buying and selling opportunities in the market. The Chaikin Oscillator is calculated by subtracting a 10-day exponential moving average of the Accumulation Distribution Line (ADL) from a 3-day exponential moving average of the ADL. Here's how to use the Chaikin Oscillator indicator in tr
250 USD
这是一个预测蜡烛收盘价的指标。 该指标主要用于 D1 图表。 该指标适用于传统外汇交易和二元期权交易。 该指标可以用作独立的交易系统,也可以作为您现有交易系统的补充。 该指标分析当前蜡烛,计算蜡烛本身内部的某些强度因素,以及前一根蜡烛的参数。 因此,该指标预测市场走势的进一步方向和当前蜡烛的收盘价。 由于这种方法,该指标既适用于短期盘中交易,也适用于中长期交易。 该指标允许您设置指标在分析市场情况期间将产生的潜在信号的数量。 在指标设置中有一个特殊的参数。 此外,该指标可以通过图表上的消息、电子邮件以及推送通知的形式通知新信号。感谢您的关注!交易愉快! 购买后一定要写信给我! 我会给你我的交易指标的建议! 还可以获得奖金!
65 USD
Intraday Volume Profile Forex MT4   Intraday Volume Profile  - This is a visualization tool for understanding the high activity zone and low activity zone, as part of the  D1  senior timeframe. The volume profile provides an excellent visual image of supply / demand at each price for the selected timeframe. Introducing  POC  - Point of Control, which indicates the price at which the maximum volume was sold, as well as Value Area - the area where 68% of the instrument's assets are traded. POC  -
75 USD
Gioteen Volatility Index (GVI)   - your ultimate solution to overcoming market unpredictability and maximizing trading opportunities. This revolutionary indicator helps you in lowering your losing trades due to choppy market movements. The GVI is designed to measure market volatility, providing you with valuable insights to identify the most favorable trading prospects. Its intuitive interface consists of a dynamic red line representing the volatility index, accompanied by blue line that indicat
100 USD
CumulativeDeltaBars
Stanislav Korotky
This indicator is a conventional analytical tool for tick volumes changes. It calculates tick volumes for buys and sells separately, and their delta on every bar, and displays volumes by price clusters (cells) within a specified bar (usually the latest one). The algorithm used internally is the same as in the indicator VolumeDelta , but results are shown as cumulative volume delta bars (candlesticks). Analogous indicator for MetaTrader 5 exists - VolumeDeltaBars . This is a limited substitution
30 USD
Market Profile Heat indicator  — is a classic Market Profile implementation that can show the price density over time, outlining the most important price levels, value area, and control value of a given trading session. This indicator can be attached to timeframes between M1 and D1 and will show the Market Profile for daily, weekly, monthly, or even intraday sessions. Lower timeframes offer higher precision. Higher timeframes are recommended for better visibility. It is also possible to use a f
150 USD
EZ Binary USJP Pair
Tuan Anh Dao
4 (2)
The indicator allows you to trade binary options. The recommended time frame is М1 and the expiration time is 1,2,3 minutes. The indicator suitable for auto and manual trading. A possible signal is specified as a arrows above/under a candle. You should wait until the candle closes! Arrows are not re-painted Trade sessions: TOKYO section (Half-end) Currency pairs: USD/JPY Working time frame: M1 Expiration time: 1,2,3 minutes. The indicator also shows good results when using the martingale strateg
FREE
Simply The Best Pro
Szymon Palczynski
5 (1)
This indicator displays the histogram and arrows on chart. When Simple The Best Pro are placed on a chart, they identify the trend.  The color of may be blue or red. The blue color stands for upside moves and the red color stands for downside trends. The indicator offers to set Stop Loss (SL) and  Take Profit (TP)  setting. The default value is ATR. Indicator has automatic optimization. The STB is a unique indicator that shows the tendency (button Bars) of a particular signals. The STB tells us
78 USD
MarketProfile EForex
Veridiana Adorno Kendrick
Market Profile Shows where the price has spent more time, highlighting important levels that can be used in trading. It is a powerful tool which is designed to take the fundamental components which comprise every market; price/volume/time, and visually display their relationship in real-time as the market develops for a pre-determined time period. Very powerful tool!
30 USD
Dark Sniper
Dmitriy Kashevich
Dark Sniper arrow indicator. complete lack of redrawing percentage of correct indicator predictions from 80 85% The arrow indicates the direction of the next candle and the possible direction of the trend in the future.  suitable for small m1 timeframes. It is recommended to open deals from 1 to 2 candles. The signal appears on the last candle advantages of the indicator: 1. leading signals. 2.complete lack of redrawing 3. high signal accuracy.
820 USD
The Market Profile Indicator for MT4 displays the price levels and zones where increased trading activity happens. These zones with substantial forex trading activity provide the forex traders with the best entry levels, support, and resistance levels. Moreover, price levels indicate the best reversal zones. As a result, forex traders can identify BULLISH and BEARISH market trends and BUY and SELL entry points as well as the best reversal points. The indicator works well in all intraday timefram
50 USD
AQ XFifteen Pro
HIT HYPERTECH INNOVATIONS LTD
Χ15 indicator is a MetaTrader 4 tool that allows you to  BUILD & BACKTEST ON REAL TIME  your own strategies quickly, easily and efficiently. It contains  15 of the most popular technical analysis indicators  that you can use, each one in a different way. Choose the indicators that you want to use, select how you will use them and you will see on the chart BUY (green) and SELL (red) arrows implementing your strategy. Choose Take Profit and Stop Loss and you will see the results of your strategy w
30 USD
BoxInside MT4
Evgeny Shevtsov
4.56 (9)
This indicator calculates the volume profile and places labels that correspond to the VAH, VAL and POC levels, for each candle individually. Indicator operation features The indicator works on the timeframes from M5 to MN, but it uses the history data of smaller periods: M1 - for periods from M5 to H1, M5 - for the H4 period, M30 - for the D1 period, H4 - for the W1 period, D1 - for the MN period. The color and location of the VAL, VAH and POC labels on the current candle are considered to be
FREE
Moving VVC mt4
Andriy Sydoruk
The   Visual Volatility Clustering   indicator clusters the market based on volatility. The indicator does not redraw and gives accurate data, does not use closing prices. Uses the opening prices or the highs or lows of the previous completed bar. Therefore, all information will be clear and unambiguous. The essence of the indicator is to divide the price market into certain areas according to a similar type of volatility. This can be done in any way. In this example, the indicator is configure
109 USD
该指标的独特之处在于交易量核算算法:在所选时段内直接进行累积,而无需参考当天的开始。可以从计算中排除最后的柱线,那么当前数据对之前形成的显着水平(交易量)的影响较小。 为了更精确的计算,默认使用 M1 图表中的数据。规范了价格量的分配步骤。默认情况下,显示的右边框设置为用于分析的数据开头对应的栏,但如果需要,可以设置为您需要的栏。显示的音量带的长度(右边界)由系数调节,也可以向左或向右移动到 0(当前)条或参照当前条进行镜像。 参数: Accumulation period -  累积量计算周期 Number of excluded last bars - 从计算中排除的最后一根柱线的数量   Accumulation price step -  按价格参数的成交量总和步骤 Graph length multiplier - 显示数据的长度比例 Use data from timeframe - 用于分析的图表(时间范围) Graph show shift - 开始显示数据的移位,如果留为0,则数据将从分析数据周期开始时间对应的条开始显示; “-1”——显示在左侧; “-2” - 显示
35 USD
The Magneto Volume Trigger indicator is designed for determining the volume confirmed by the candlestick pattern and predicting the trend tendency. Indicator setup and use The calculation of values is affected by two parameters - Period and Gate . The lower the value of Gate , the higher the sensitivity of the indicator. Period allows making a sample of data for the specified number of candles. The lower the value of Period , the more the indicator is adapted to the current market conditions.
79 USD
VR Calculate Martingale
Vladimir Pastushak
5 (5)
VR Calculate Martingale 指标是一款强大的订单和头寸计算器,用于计算盈利或亏损。 在订单和头寸计算器的帮助下,交易者可以计算任何外汇货币、股票或加密货币的平均价格。 您已经可以连接指标并启动在真实订单和头寸上叠加虚拟订单的功能。 通过创建其他虚拟头寸,您将能够计算任何事件的发展。 该指标包括手数计算器、持仓平均计算器、止盈和止损水平计算器。 在特殊功能的帮助下,您可以模拟当前价格在任何方向的变动,并计算一个或多个仓位的利润或亏损。 你有很多买入和卖出头寸吗?VR Calate Martingale-将计算平均价格,您可以在零或小额利润中平仓所有仓位。 您将能够按平均价格对订单进行分组,并找到最有利可图的解决方案来平仓一个或多个仓位。 技术支持,设置,演示版本的程序可以要求在作者的配置 文件。. 使用指示器是简单直观的,大多数操作都是用鼠标执行的。 该指标安装简单,适用于初学者和专业交易者。 VR Calculate Martingale 使用虚拟订单工作,这允许您自动进行所有计算,而无风险。 指示器的特点: 使用订单链法计算交易。 同时按照买卖的方向建立权证链条。
34 USD
GND Tail Candle
Nguyen Dang Giang
A tall upper shadow occurs when the price moves during the period, but goes back down, which is a bearish signal. A tall lower shadow forms when bears push the price down, but bulls pull it back up, which leaves a long line or shadow. This is considered a bullish signal. Some technical analysts believe a tall or long shadow means the stock will turn or reverse. Some believe a short or lower shadow means a price rise is coming. In other words, a tall upper shadow means a downturn is coming, whil
60 USD
该产品的买家也购买
TrendMaestro
Stefano Frisetti
5 (2)
note: this indicator is for METATRADER4, if you want the version for METATRADER5 this is the link: TRENDMAESTRO recognizes a new TREND in the bud, he never makes mistakes. The certainty of identifying a new TREND is priceless. DESCRIPTION TRENDMAESTRO identifies a new TREND in the bud, this indicator examines the volatility, volumes and momentum to identify the moment in which there is an explosion of one or more of these data and therefore the moment in which prices have strong probability of f
777 USD
PZ Swing Trading
PZ TRADING SLU
5 (4)
Swing Trading 是第一个旨在检测趋势方向的波动和可能的反转波动的指标。它使用在交易文献中广泛描述的基准摆动交易方法。该指标研究多个价格和时间向量,以追踪总体趋势方向,并检测市场超卖或超买并准备好进行修正的情况。 [ 安装指南 | 更新指南 | 故障排除 | 常见问题 | 所有产品 ] 市场波动的利润不会被窃取 指示器始终显示趋势方向 彩色价格带代表机会基准 彩色虚线表示可能的反转波动 该指标分析其自身的质量和性能 它实现了一个多时间仪表板 可定制的趋势和波动周期 它实现了电子邮件/声音/推送警报 指示器为非重涂或重涂 什么是摇摆交易 摇摆交易是一种尝试在一天到一周内从证券中获得收益的交易方式,尽管某些交易最终可以保持更长的寿命。摇摆交易者使用技术分析来买入弱点和卖出力量,并有耐心等待这些机会的发生,因为在发生一波抛售浪潮之后购买证券而不是陷入抛售更有意义。 机会基准 关于历史数据的大量研究证明,适合于波动交易的市场倾向于在基线价格带上下交易,基线价格带由图表显示,使用平均真实区间计算得出。波动交易者使用基线,该策略是购买常态和卖出躁狂,或做空常态并掩盖沮丧。
249 USD
"Dragon's Tail"是一种综合交易系统,而不仅仅是一个指标。这个系统以分钟为单位分析每一个蜡烛,这在市场波动性高的情况下特别有效。 "Dragon's Tail"系统确定市场的关键时刻,称为"公牛和熊的战斗"。基于这些"战斗",系统给出交易方向的建议。在图表上出现箭头的情况下,这表明有可能在指示的方向上开设两个交易。黄线和绿线分别作为第一和第二个交易的获利水平。在达到黄线水平并关闭第一笔交易后,建议在第二笔交易开启的水平上设定止损。 时间框架和工具的选择取决于交易员的偏好,但为了达到最佳结果,建议使用H4和D1的时间框架,并考虑所选工具的差价大小。 "Dragon's Tail"的设置参数可以分为两组: 直接影响交易结果的参数: 历史深度 - 只影响图表上入口点的显示。推荐值:D1 - 10,H4 - 15,H1 - 20。 获利1和获利2 - 影响最终结果。取决于时间框架的推荐值:D1 - 250/450,H4 - 150/250,H1 - 75/150。 负责系统视觉设计的参数。可以根据交易员的意愿进行设置。 重要的是要记住,"Dragon's Tail"是一个需要交易员
1 000 USD
ON Trade Optuma Astro
Abdullah Alrai
5 (3)
当然可以!以下是您提供的文本的中文翻译: 引入 MT4 天文指标:您的终极天体交易伙伴 您准备好将交易体验提升到天文高度了吗?不用再寻找,就在我们的革命性 MT4 天文指标中。这个创新工具超越了传统的交易指标,利用复杂的算法提供无与伦比的天文洞察力和精确计算。 指尖上的宇宙信息: 瞻仰一个详尽的面板,展示了一宝藏般的天文数据。了解行星的地理/太阳心坐标,太阳/地球距离,亮度,伸长度,星座,黄道和赤道坐标,甚至是水平坐标——每个细节都经过精心计算并呈现得美轮美奂。指标生成的垂直线对应于时间值,为您的交易旅程提供了宇宙的视角。 行星线条与关系: 在您的图表上欣赏行星线条的魔力,具有可自定义的比例和角度。通过直观的控制面板轻松切换每个行星线条的可见性。通过连结、六分、四分、三分、对冲和逆行等指标,发现行星关系的艺术。在您选择的时间范围内探索这些宇宙构造,使您能够识别重要的交易机会。 揭示甘恩的智慧: 通过受甘恩启发的平方垂直线揭示潜在的反转时机。这种创新修改将甘恩历经考验的原则带入现实,帮助您提前了解市场的转向和趋势。 月亮引导: 在您的图表上优雅地导航月相,因为新月和满月点缀其间。月亮周期
250 USD
Gann Zone Pro
Kirill Borovskii
This indicator identifies and displays zones, as it were areas of strength, where the price will unfold. The indicator can work on any chart, any instrument, at any timeframe. The indicator has two modes. The indicator is equipped with a control panel with buttons for convenience and split into two modes. Manual mode: To work with manual mode, you need to press the NEW button, a segment will appear. This segment is stretched over the movement and the LVL button is pressed. The level is displayed
470 USD
Weis Wave with Alert
Trade The Volume Waves Single Member P.C.
4.79 (19)
Rental/Lifetime Package Options and Privileges' * For optimum results the yearly or lifetime package is suggested due to live training and Discord  channel trading with the  creator! Rent Monthly Six Months   Yearly/Lifetime Weis Wave with Speed with Alert+Speed Index x x x Manual  x x x Quick Set up Video x x x Blog x x x Lifetime Updates x x x Setup and Training Material x x Free Rectangle Break Alert Tool      x Discord Access Channel "The SI traders" x 2-hour live methodology traini
599 USD
Chaos Indicator
Stefano Frisetti
DESCRIPTION The CHAOS INDICATOR has been developed to be used for the TRADING STRATEGY OF CHAOS, as described in the book. The book is in italian language only and can be obtained only on my website indicated below. DATAS COLLECTED AND SHOWN ON GRAPHS The CHAOS INDICATOR apply easily to any graph and any asset, and it is a TRADING FACILITATOR, as it identify immediately the following items on any graph: - The GP (= RIGHT PRICE) i.e. the price to which the asset should be attracted within 24
380 USD
PZ Harmonacci Patterns
PZ TRADING SLU
3.43 (7)
可以说,这是您可以为MetaTrader平台找到的最完整的谐波价格形成自动识别指标。它检测19种不同的模式,像您一样认真对待斐波那契投影,显示潜在的反转区域(PRZ),并找到合适的止损和获利水平。 [ 安装指南 | 更新指南 | 故障排除 | 常见问题 | 所有产品 ] 它检测19种不同的谐波价格形态 它绘制了主要,衍生和互补的斐波那契投影(PRZ) 它评估过去的价格走势并显示每个过去的形态 该指标分析其自身的质量和性能 它显示合适的止损和获利水平 它使用突破来表明合适的交易 它在图表上绘制所有样式比率 它实现了电子邮件/声音/视觉警报 受斯科特·M·卡尼(Scott M. Carney)的书的启发,该指标旨在满足最纯粹和最熟练的交易者的需求。但是,它采取了一种使交易更容易的方式:在向交易发出信号之前,它会等待Donchian朝正确方向突破,从而使交易信号非常可靠。 斐波那契投影与向量无关 它实现了电子邮件/声音/推送警报 它绘制了ABCD投影 重要提示: 为了符合 Scott M. Carney先生 的商标申诉,某些图案名称已重命名为不言自明的替代方式, Scot
299 USD
Please send me Direct message on MQL5 CHAT after purchasing the Indicator for Training and Installation Support There are some additional files that is important to use with the Indicator . So be sure to contact me after purchasing the Indicator So that I can add you for training and support . If you find any difficulty with installation then send me Direct message here So that I can connect with you via Anydesk or Teamview for the product installation. " Smart Order Block Indicator " to find
249 USD
Gann Price Level
Kirill Borovskii
The indicator is designed to work on any trading platform. The program is based on proprietary algorithms and W.D.Ganna's mathematics, allowing you to calculate target levels of price movement based on three points with the highest degree of certainty. It is a great tool for stock trading. The indicator has three buttons: NEW - call up a triangle for calculation. DEL - delete the selected triangle. DELS - completely remove all constructions. The probability of achieving the goals is more than 80
370 USD
Full STO
Roman Smoroda
完整的 STO 指标(包括三个 STO 指标的所有版本:高级版、黄金版、白银版) - STABLE TRADE OPTION 专为自动二元期权交易而设计。 请仔细阅读!!!!! 重要事项 在一个终端中创建两个不同到期时间的模板,一个为 18:01、18:02,到期时间为 1 至 15 分钟的模板,另一个为 22:00,到期时间为 10 至 20 分钟的模板。 胜率:过去 5 年为 71 资金管理:存款的 0.3 此版本的指标仅用于莫斯科时间 18:01、18:02、22:00 的交易,白银和黄金的到期时间为 1 至 15 分钟,高级版本的到期时间为 10 至 20 分钟。信号出现在蜡烛内部并立即打开交易,如果您使用连接器,则在蜡烛内部打开一个标记。 该指标配置齐全,您无需自行更改。安装并交易 请勿在未经任何检查和测试的情况下购买该指标,我花了两年多时间在真实账户上检查所有版本的sto并查看结果。经过多年测试,我们选择了最佳参数。 应用算法 1. 将指标安装到信号顾问中,信号顾问会自动向经纪商平台发送信号。 - mt2trading.
500 USD
Smart Ai Levels
Aditya Jayswal
Smart Ai Levels  Accumulation & Distribution indicator Smart Ai Levels are Ai controlled indicator which is based on Wyckoff Price cycle theory . It automatically scans the Accumulation & Distribution phases on chart and Ai draws the possible areas before Mark up and Mark down which acts as hot zones and can be traded with confirmation to catch those big price movements . It's a great tool for both Reversal and Breakout Trades suitable to all Trading Styles such as Scalping - Intraday - Swing 
249 USD
Full Forex Market View Dashboard
Opengates Success International
5 (2)
完整的外汇市场视图仪表板指示器 这是一个自定义指标,旨在让交易者全面了解市场上正在发生的事情。 它使用实时数据访问市场并显示成功交易所需的每一点信息。 安装: 在将此指标附加到您的窗口图表之前,请转到您的 MT4 的市场观察面板并隐藏所有您不需要或交易的货币对,并将其余货币对留在那里。 原因是 FFMV 仪表板将显示出现在 MT4 市场观察中的所有货币对。 它最多可以显示 30 个或更少的货币对。 如果它超过您 MT4 的市场观察中的那个,它会模糊和毁坏 FFMV 仪表盘上的字体和图像! 它不会正确显示。 用法:      单人交易      对于篮子交易(见截图如何)      也可用于多单交易      确认从您自己的交易系统等收到的信号的有效性。 成分:      时间范围:从 M1 到 MN1 当前蜡烛状态(买入/卖出      趋势:币种整体走势      影响:货币变动的幅度/波动性,见下文:      建立:货币正在建立      好:货币越来越严重      高:币值值得关注      强:要考虑方向  
650 USD
Target 5X Indicator
Ihab Salloum
5 (1)
The 5X target indicator is an indicator that plots the optimal entry zone and the target for the trading day. It also plots a level where the stoploss can be moved to breakeven for a risk free trade which is 2X. This indicator has time window inputs. The default settings are from 02:00 to 19:00 CET+1 time zone. This indicator is based used with a direction bias for the day. I post the direction bias for several pairs in the comments section. Added a new feature Time Zone to help trade the highes
250 USD
(Nhaa Momo Oscillator indicator)  —  Title: Navigating Forex Markets with Precision: The Stochastic Indicator  Precision and insight are paramount. Enter the Nhaa Momo Stochastic Indicator Dashboard—a beacon of clarity amidst the complexity of market fluctuations. This ingenious tool empowers traders to harness the power of RSI and Stochastic indicators, seamlessly navigating trends across various timeframes with unparalleled accuracy. Picture this: a sleek dashboard at your fingertips, offeri
500 USD
你是否厌倦了使用不可靠的二元期权指标,它们给出错误的信号,导致损失和沮丧?别再犹豫,来试试CLOCK INDICATOR吧!它是目前MT4交易平台上最好的二元期权指标! 凭借先进的算法和强大的技术分析工具,CLOCK INDICATOR是新手和经验丰富的交易者的终极交易工具。它准确预测市场趋势,发现有利可图的交易机会,帮助你最大化利润,减少亏损。 与其他复杂难用的二元期权指标不同,CLOCK INDICATOR安装和自定义都非常简单。你可以根据个人交易偏好调整设置,并且它在所有主要货币对和时间框架上无缝运行。 CLOCK INDICATOR的一大亮点是它不会重绘。一旦信号生成,它就会一直显示在图表上,这样你可以确信自己基于准确信息做出了明智的交易决策。 不要再浪费时间使用不可靠的指标给出错误信号了。立即下载CLOCK INDICATOR,开始在二元期权交易中看到真正的结果吧。无论你是初学者还是经验丰富的专业人士,这个强大的指标一定能让你的交易水平提升到新的高度。
450 USD
MT4平台"鹰眼指标":提升二元期权交易精准性 激发二元期权交易的潜力,带来无与伦比的准确性,"鹰眼指标"登场!作为一款强大的工具,引领交易者在波澜壮阔的金融市场中找到盈利机会。 利用MetaTrader 4(MT4)平台的直观性,"鹰眼指标"结合先进的算法和技术分析,实时提供全面的市场动态。其强大功能使交易者能够基于对价格模式、趋势和关键市场指标的全面评估做出明智的决策。 "鹰眼指标"核心的能力在于准确识别最佳的进出点。通过对价格走势的精确扫描,该指标能够快速检测潜在的反转、突破和趋势延续,使交易者能够抓住最有利可图的交易时机。 "鹰眼指标"提供用户友好的界面,确保交易体验顺畅。通过可定制的设置和可调整的参数,它能够适应个体化的交易风格、偏好和风险承受能力,为每个用户提供量身定制的体验。 "鹰眼指标"真正的力量在于减少情绪交易决策的影响。它提供客观、基于数据的洞察力,作为可靠的伙伴,减轻交易焦虑和不确定性。这个宝贵的工具使交易者能够做出有纪律性和理性的选择,培养更具策略性和盈利性的二元期权交易方法。 作为鹰眼指标的可靠性证明,它在二元期权交易社区中赢得了忠实的追随者。那些拥抱这一革命
450 USD
A. 什么是 A2SR ?   * 这是一个领先的技术指标(没有重绘,没有滞后)。   * Special event :  https://c.mql5.com/1/263/A2SR_Discount_35_percent_in_August_2023.png  -  指导 : -- 在  https://www.mql5.com/en/blogs/post/734748/page4#comment_16532516 -- 和  https://www.mql5.com/en/users/yohana/blog A2SR 在确定支撑(需求)和阻力(供应)水平方面有一种特殊的技术。 与我们在网上看到的普通方式不同,A2SR 在确定实际 SR 级别时有一个独创的概念。 原技术不是从网上拿来的,也没有在网上公开过。 A2SR 将根据您的交易风格自动选择 SR 级别。 即使您正在更改时间范围,但 SR 级别仍将保留在其位置上。 因为实际的 SR 不是从你使用的时间范围内获得的。 A2SR 拥有完整的交易工具 。 实际支持(需求)和阻力(供应)的真正概念。 新闻事件和央行
276 USD
PZ Divergence Trading
PZ TRADING SLU
5 (3)
棘手的发现和频率稀缺是最可靠的交易方案之一。该指标使用您喜欢的振荡器自动查找并扫描常规和隐藏的发散。 [ 安装指南 | 更新指南 | 故障排除 | 常见问题 | 所有产品 ] 容易交易 发现常规和隐藏的分歧 支持许多知名的振荡器 根据突破实现交易信号 显示适当的止损和获利水平 可配置的振荡器参数 可自定义的颜色和尺寸 按条形过滤大小差异 实现绩效统计 它实现了电子邮件/声音/视觉警报 为了提供广阔的市场前景,可以使用不同的振荡器在同一张图表中多次加载该指标,而不会产生干扰。该指标支持以下振荡器: RSI CCI MACD OSMA 随机 动量 很棒的振荡器 加速器振荡器 威廉姆斯百分比范围 相对活力指数 由于差异可能会扩大很多,尤其是在外汇市场中,因此该指标产生了转折:它在等待交易突破之前等待donchian突破确认差异。最终结果是带有非常可靠的交易信号的重新粉刷指示器。 输入参数 幅度:用于寻找差异的之字形周期 振荡器-选择要加载到图表的振荡器。 突破期-交易信号的突破期,以柱为单位。 发散类型-启用或禁用发散类型:隐藏,常规或两者。 最小散度单位为条形-最
249 USD
EZT Trend
Tibor Rituper
4 (1)
EZT 趋势指标将向您显示趋势、回调和入场机会。 提供可选的过滤和所有类型的警报。 添加电子邮件和推送通知警报。 我们还在开发基于该指标的 EA,即将推出。 它是一个多功能指标,由两个颜色直方图和一条线组成。 它是趋势方向和强度的直观表示,您也可以在线上或直方图上多次发现背离。 该指标与自动参数设置配合良好。 这些是针对给定时间范围预先确定的,我们建议使用具有该设置的指标。 在手动模式下,您可以设置自己的参数。 这是一个多时间框架 (mtf) 指标。 该指标与我们的其他指标(例如 MTF rsi 或 MTF cci 或 MACD pro)组合起来效果很好。 交易工具的波动性越大,您寻找最佳入场机会的时间范围就越小。 始终考虑更高的时间范围方向! 为此,您应该使用更多指标实例。 输入 参数模式:可选择“手动参数”或预设的“自动参数”。 自动参数处于多时间范围模式。 示例:当您设置自动 H1 参数时:您可以看到从 H1 时间范围一直到 1 分钟的相同显示。 在此设置中,指标不会在更高的时间范围(例如 H4 或更大)上显示。 手动时间范围:当在第一个菜单中选
299 USD
Introducing the "Magic Trades" for MetaTrader 4 – your ultimate tool for precision trading in dynamic markets. This innovative indicator revolutionizes the way you perceive market trends by harnessing the power of advanced analysis to detect subtle changes in character, paving the way for optimal trading opportunities. The Magic Trades Indicator is designed to empower traders with insightful entry points and well-defined risk management levels. Through its sophisticated algorithm, this indica
500 USD
This is a trend Predictor. Honestly I have to give some credit to some few developers I know personally because they helped pulled this off.  The trend indicator uses special optics to direct the flow of price . it detects where the trend is moving into  It uses price action and a few other embedded custom indicator. You can use it in all timeframes and will be available at a much cooler price.  Please test this Indicator before buying to make sure you like what you see. I can't guarantee th
399 USD
CFF Banks Liquidity
Abdalla Mohamed Kandil
CFF Banks Liquidity     Entry signals without repainting or delays     Error-free opening of trades     Provides signals for any direction sell & Buy How does the CFF Banks Liquidity Works? Our CFF Banks Liquidity trading system based on a very accurate "Trend-Following" Trading Strategy. Here's how to Start using our System 1.      Buy and install the indicator in your terminal. Ask the guide. 2.       Start trading by receiving signals from the indicator telling you about the ideal mom
313 USD
Multi-Time-Frame-Multi Currency Signals Dashboard Indicator It is an Advanced multi-utility dashboard which works with full customization of signal settings and graphical interface. It works with Multi Symbols and Multi-Time frames from 1 SINGLE CHART TEMPLATE. It will automatically open the charts where the latest signals had formed- showing the important levels (Entry, Targets, Stop Loss) Many types of sorting methods for the scanner. A robust ENTRY based on  TREND OF MULTI-TIME FRAMES ( Co
250 USD
'Zoro PRO' is a reversal strategy based MT4 indicator with advance pre-alert system. Its an 100% non repaint indicator with an average accuracy of about 70-95% in any kind of market. (EXCEPT BAD MARKET AND NEWS TIME) MT5 version:   https://www.mql5.com/en/market/product/90934  (MT5 version not recommended)  Recommended Broker: Alpari, Amarkets, tickmill. Recommended pairs for M1: AUDCHF AUDJPY CADCHF CHFJPY EURCAD USDJPY EURGBP GBPAUD GBPCHF GBPJPY -----------------------------
250 USD
Introduction to X3 Chart Pattern Scanner X3 Cherart Pattern Scanner is the non-repainting and non-lagging indicator detecting X3 chart patterns including Harmonic pattern, Elliott Wave pattern, X3 patterns, and Japanese Candlestick patterns. Historical patterns match with signal patterns. Hence, you can readily develop the solid trading strategy in your chart. More importantly, this superb pattern scanner can detect the optimal pattern of its kind. In addition, you can switch on and off individu
250 USD
Italy Trade System
Roman Kucher
1 (1)
The system resembles the Italian flag and is simple for ordinary people to understand. Any trader with any experience will be able to use it. The Italy trading system generates 3 types of market conditions. Green zone - consider only buy trades. Red zone - consider only sell trades. Empty zone - flat, do nothing. Buy signal: Green zone + a blue arrow appears. Close all positions when an opposite signal (arrow) appears. Sell signal: Red zone + a red arrow appears. Close all positions when an oppo
279 USD
如果您经常因为只使用一种指标而亏损交易,那么请尝试此交易工具。 该交易工具使用多个指标。 我经常观察只使用 RSI 指标的交易者。 很多时候,市场超卖但仍然下跌,或者市场超买但仍然上涨。 因此,您需要使用多个指标。 隆重推出新版本 V 3.40 MTF PPAAF:多时间框架精确价格行为箭头过滤。 该交易工具使用各种指标来加强市场走势的方向。 该交易工具中使用的第一个指标是双随机指标。 在这里,我使用两种随机指标,即快速随机指标和慢速随机指标。 在快速随机指标中,有一条快速随机指标主线和一条快速随机指标信号线。 同样,在慢随机指标中,有一条慢随机指标主线和一条慢随机指标信号线。 主线和信号线的交叉/交叉将形成向上和向下箭头。 第二个指标是Double RSI,即快速RSI和慢速RSI。 两者相交将形成一个向上和向下的箭头。 第三个指标是Double CCI,即快速CCI和慢速CCI。 两者相交将形成一个向上和向下的箭头。 第四个指标是双MACD。 与双随机指标类似,这里有快速 MACD 和慢速 MACD。 在快速 MACD 中,有一条快速 MACD 主线和一条快速 M
750 USD
PZ Mean Reversion MT4
PZ TRADING SLU
1 (2)
采用专业和量化方法进行均值回归交易的独特指标。它利用了价格以可预测和可衡量的方式转移并返回均值这一事实,这允许明确的进入和退出规则大大优于非量化交易策略。 [ Installation Guide | Update Guide | Troubleshooting | FAQ | All Products ] 清晰的交易信号 非常容易交易 可定制的颜色和尺寸 实现性能统计 优于大多数交易策略 显示合适的止损和止盈水平 它实现了电子邮件/声音/视觉警报 这个怎么运作 该指标从更高的时间范围测量完全可定制的移动平均线的标准偏差,并使用趋势跟踪方法精确地找到交易。交易是通过深入当前图表的价格行为发现的,并在价格返回到平均价格区间时关闭,根据您选择的更高时间范围计算。由于其编码方式,该指标将远离高波动性和强劲趋势市场,并且仅在可预测的情况下进行交易,在可接受的波动性与方向性比率范围内,回归均值是可行的。 指标剖析 绿线是更高时间范围内的移动平均线(也就是平均值) 虚线区域是移动平均线周围的典型价格区间 蓝线是看涨交易的突破价格 红线是看跌交易的突破价格 交易是针对均值进行的,并在
249 USD
An automatic trend indicator that uses an algorithm to determine impulse signals for scalping and intraday trading. The trend-following indicator automatically calculates potential entry and exit points for trades. The indicator contains a trend line and a target channel for following signals, changing color depending on the direction. Main characteristics Signal colored candles and arrows: blue - downward direction, red - upward direction. Yellow dots for exiting trades are located along
299 USD
作者的更多信息
SIEA Pro MT5 NG
Daniel Stein
5 (1)
SIEA PRO NG 是 SIEA PRO 的下一代产品,与本公司以前的所有 EA 完全不同。 所示价格为SIEA PRO NG上市时的 折扣价 ! 主要事实一览 交易均值回归策略 基于我们独一无二的 5 年真实交易量数据 每笔交易都有固定的止损和止盈 平均交易时间少于 48 小时 为个人微调提供多种选择 无网格,无马丁格尔 不兼容先进先出 实时信号 -> https://www.mql5.com/en/signals/2124668 SIEA PRO NG 只交易最好的货币对。 在 5 年的测试期间,其他货币对的盈利能力不足以进入最终选择。 当然,交易者还可以进一步缩小交易符号的范围,只交易那些具有最佳统计数据的交易符号。 经过数百小时的研究和开发, 默认设置是 我们认为 最均衡的设置。 所提供的参数大多不言自明,但如果您有任何疑问,请随时联系我们。 现在,希望您能喜欢这款功能强大的智能软件。 丹尼尔和阿兰 技术要求 1.请 在终端属性的允许 URL 列表中 添加以下 URL - 交易量数据 -> https://ste
888 USD
FX Power MT5 NG
Daniel Stein
5 (4)
通过 mql5 和 Telegram 上 的晨间简报获取每日市场更新,包括详细信息和屏幕截图 ! FX Power MT5 NG 是我们长期以来非常受欢迎的货币强度计算器 FX Power 的下一代产品。 这款下一代强度计算器能提供什么?您所喜爱的原版 FX Power 的所有功能 附加功能 黄金/XAU 强度分析 更精确的计算结果 可单独配置的分析周期 可自定义计算限制,以获得更好的性能 为希望查看更多信息的用户提供特殊的多实例设置 无尽的图形设置,可在每个图表中设置您最喜欢的颜色 无数的通知选项,让您再也不会错过任何重要信息 采用 Windows 11 和 macOS 风格的全新圆角设计 神奇的移动指标面板 FX Power 主要功能 所有主要货币的完整强势历史 所有时间框架内的货币强弱历史 所有经纪商和图表的计算结果完全相同 100% 可靠的实时计算 -> 无重绘 可通过下拉列表选择分析时段 通过自定义模式单独配置分析时段 可在一个图表中使用多个实例 可移动 FX Power 显示屏(通过拖放) 适用于高分辨率 QHD、UHD 和 4K 显示器 自动终端配置 针对平板电脑
149 USD
FX Volume MT5
Daniel Stein
4.94 (16)
通过 mql5 和 Telegram 上 的 " 晨间简报 "获取每日市场更新,包括详细信息和屏幕截图 ! 外汇交易量(FX Volume)是第一个也是唯一一个从经纪商角度真正洞察市场情绪的交易量指标。 直接在您的图表上看到这些信息是真正改变游戏规则和突破性的交易解决方案。 受益于独特的市场数据洞察,如 比率(Ratios )显示货币多头和空头头寸的比率(百分比 比率变化 显示所选时间段内的多头比率及其百分比变化 总交易量 显示货币的总交易量(多头和空头),以手为单位 多头 交易量显示货币所有多头头寸的交易量 空头 交易量显示所有货币空头头寸的交易量 净多头 显示净多头交易量,即所有多头头寸减去所有空头头寸(以手为单位)。 净多头百分比 显示货币净多头交易量的变化 请阅读我们的基本教程 -> "如何使用外汇交易量进行交易 " 获取更多信息,如常见问题、交易技巧和教程视频,请访问我们的 外汇交易量公共信息频道 请 安装并运行 SI Connect 以建立与我们数据中心的持续连接 背景信息 我们都知道,外汇是一个分散的市场。这就是为什么我们必须打破常规思维,开发一个独
229 USD
SIEA Zen
Daniel Stein
4 (4)
外汇交易成功的关键 是纪律、耐心和明确的优势,正如我们独特的真实交易量分析。 这就是我们10年来的外汇交易经验,所有这些关键因素都在斯坦因投资专家顾问(SIEA)系列中得到了总结。 SIEA ZEN 提供了一个非常平衡的风险回报率,并在所有的市场情况下轻松存活--即使是最关键的情况,如科罗纳、英国脱欧等。 该系统的稳健性除了提供令人敬畏的性能,还为其用户提供了更重要的 "安心"。这就是为什么我们叫它ZEN。 获取更多信息,如常见问题、回测报告和正确的夏令时/GMT设置提示,请参见我们公开的 SIEA常见问题 . 交易风格 SIEA ZEN 以8种主要货币美元、加元、欧元、瑞士法郎、英镑、澳元、新西兰元和日元为基础,交易所有28个交易对。 我们独特的交易量分析决定了市场的不平衡和它们的激烈程度,以发现反向进入的机会。 SIEA ZEN 在每个月末关闭所有的头寸,并在下个月月初开始新的周期。 通过这种方式,我们将实现令人敬畏的低回撤,同时利润仍旧突出。平均交易时间仅为4天。 新闻处理 SIEA ZEN 有一个内置的新闻过滤器,可以在央行新闻事件前后停止新的
449 USD
FX Power MT4 NG
Daniel Stein
5 (7)
通过 mql5 和 Telegram 上 的晨间简报获取每日市场更新,包括详细信息和屏幕截图 ! FX Power MT4 NG 是我们长期以来非常受欢迎的货币强度计算器 FX Power 的下一代产品。 这款下一代强度计算器能提供什么?您所喜爱的原版 FX Power 的所有功能 附加功能 黄金/XAU 强度分析 更精确的计算结果 可单独配置的分析周期 可自定义计算限制,以获得更好的性能 为希望查看更多信息的用户提供特殊的多实例设置 无尽的图形设置,可在每个图表中设置您最喜欢的颜色 无数的通知选项,让您再也不会错过任何重要信息 采用 Windows 11 和 macOS 风格的全新圆角设计 神奇的移动指标面板 FX Power 主要功能 所有主要货币的完整强势历史 所有时间框架内的货币强弱历史 所有经纪商和图表的计算结果完全相同 100% 可靠的实时计算 -> 无重绘 可通过下拉列表选择分析时段 通过自定义模式单独配置分析时段 可在一个图表中使用多个实例 可移动 FX Power 显示屏(通过拖放) 适用于高分辨率 QHD、UHD 和 4K 显示器 自动终端配置 针对平板电脑
149 USD
SIEA Zen MT4
Daniel Stein
外汇交易成功的关键 是纪律、耐心和明确的优势,正如我们独特的真实交易量分析。 这就是我们10年来的外汇交易经验,所有这些关键因素都在斯坦因投资专家顾问(SIEA)系列中得到了总结。 SIEA ZEN 提供了一个非常平衡的风险回报率,并在所有的市场情况下轻松存活--即使是最关键的情况,如科罗纳、英国脱欧等。 该系统的稳健性除了提供令人敬畏的性能,还为其用户提供了更重要的 "安心"。这就是为什么我们叫它ZEN。 MT4不能够在其策略测试器中执行多符号策略。我们建议使用 SIEA MT5 版本来运行现实的真实点位多符号回测。 获取更多信息,如常见问题、回测报告和正确的夏令时/GMT设置提示,请参见我们公开的 SIEA常见问题 . 交易风格 SIEA ZEN 以8种主要货币美元、加元、欧元、瑞士法郎、英镑、澳元、新西兰元和日元为基础,交易所有28个交易对。 我们独特的交易量分析决定了市场的不平衡和它们的激烈程度,以发现反向进入的机会。 SIEA ZEN 在每个月末关闭所有的头寸,并在下个月月初开始新的周期。 通过这种方式,我们将实现令人敬畏的低回撤,同时利润仍旧突出
449 USD
IX Power MT5
Daniel Stein
IX Power 终于将 FX Power 的无与伦比的精确性带到了非外汇交易符号中。 它能准确判断您喜爱的指数、股票、商品、ETF 甚至加密货币的短期、中期和长期趋势强度。 您可以 分析 终端提供的 一切 。试试吧,体验一下您在交易时如何把握 时机 。 IX Power 主要功能 100% 精确的非重绘计算结果 - 适用于您终端中的所有交易符号 下拉式选择预配置以及可单独配置的强度分析周期 通过电子邮件、消息和手机通知的无数种通知选项 可访问的 EA 请求缓冲区 可自定义计算限制,以获得更好的性能 为希望查看更多信息的用户提供特殊的多实例设置 无尽的图形设置,让您在每个图表中都能找到最喜欢的颜色 采用 Windows 11 和 macOS 风格的圆角新面板设计 神奇的移动指标面板,可在子窗口和主图表之间无缝移动 适用于高分辨率 QHD、UHD 和 4K 显示器,并针对平板电脑和触摸屏进行了优化 IX Power 参数 最重要的参数不言自明,但我们很快会在另一篇文章中为您提供所有 IX Power 参数的完整说明。 使用别名 "参数可为技术交易符号
89 USD
IX Power MT4
Daniel Stein
5 (5)
IX Power 终于将 FX Power 的无与伦比的精确性带到了非外汇交易符号中。 它能准确判断您喜爱的指数、股票、商品、ETF 甚至加密货币的短期、中期和长期趋势强度。 您可以 分析 终端提供的 一切 。试试吧,体验一下您在交易时如何把握 时机 。 IX Power 主要功能 100% 精确的非重绘计算结果 - 适用于您终端中的所有交易符号 下拉式选择预配置以及可单独配置的强度分析周期 通过电子邮件、消息和手机通知的无数种通知选项 可访问的 EA 请求缓冲区 可自定义计算限制,以获得更好的性能 为希望查看更多信息的用户提供特殊的多实例设置 无尽的图形设置,让您在每个图表中都能找到最喜欢的颜色 采用 Windows 11 和 macOS 风格的圆角新面板设计 神奇的移动指标面板,可在子窗口和主图表之间无缝移动 适用于高分辨率 QHD、UHD 和 4K 显示器,并针对平板电脑和触摸屏进行了优化 IX Power 参数 最重要的参数不言自明,但我们很快会在另一篇文章中为您提供所有 IX Power 参数的完整说明。 使用别名 "参数可为技术交易
89 USD
FX Trend MT5
Daniel Stein
4.67 (36)
你想成为一个持续盈利的五星级外汇交易商吗? 1. 阅读我们简单的 交易系统 的基本描述 和 以及它在2020年的主要策略更新 2. 发送您的购买截图,以获得我们独家交易聊天的个人邀请 FX趋势 实时显示所有时间框架的趋势方向、持续时间、强度和由此产生的趋势评级。 您将一目了然地看到趋势在哪个方向运行,它们持续多长时间以及它们有多强大。 所有这些使它成为初学者、高级和专业交易者的易于使用的趋势交易系统 。 分析功能 所有时间框架的实时趋势分析 所有时间框架的计算结果完全相同 配置您个人的时间框架集 可定制的趋势计算参数 图形功能 在紧凑模式、细节模式和仪表板模式之间一键切换 紧凑模式在一个缩小的面板中提供基本的趋势信息 细节模式提供相关符号的深入趋势分析 仪表板模式涵盖了所有主要的或你最喜欢的交易符号 只需在面板内点击一下,就可以访问所有的时间框架和符号 可移动的外汇趋势显示(通过拖放)。 适用于高分辨率的QHD、UHD和4K显示器 不需要重新画图 一般特征 自动的终端配置 针对平板电脑和触摸屏的使用进行了优化 通过电子邮件、信息和手机通知发出警报 为EA请求提供可访问的缓
49 USD
SIEA PRO NG 是 SIEA PRO 的下一代产品,与本公司以前的所有 EA 完全不同。 所示价格为 折扣价 ,用于 SIEA PRO NG 的市场发布! 请使用 SIEA PRO NG MT5 版本运行真实点差多符号回溯测试。 主要事实一览 交易均值回归策略 基于我们独一无二的 5 年真实交易量数据 每笔交易都有固定的止损和止盈 平均交易时间少于 48 小时 多种选项可进行个性化微调 无网格,无马丁格尔 不兼容先进先出 实时信号 -> https://www.mql5.com/en/signals/2124668 SIEA PRO NG 只交易最好的货币对。 在 5 年的测试期间,其他货币对的盈利能力不足以进入最终选择。 当然,交易者还可以进一步缩小交易符号的范围,只交易那些具有最佳统计数据的符号。 经过数百小时的研究和开发, 默认设置是 我们认为 最均衡的设置。 所提供的参数大多不言自明,但如果您有任何疑问,请随时联系我们。 现在,希望您能喜欢这款功能强大的智能软件。 丹尼尔和阿兰 技术要求 1.请 在终端属性的允许 URL
888 USD
FX Trend
Daniel Stein
4.85 (97)
你想成为一个持续盈利的五星级外汇交易商吗? 1. 阅读我们简单的 交易系统 的基本描述 和 以及它在2020年的主要策略更新 2. 发送您的购买截图,以获得我们独家交易聊天的个人邀请 FX趋势 实时显示所有时间框架的趋势方向、持续时间、强度和由此产生的趋势评级。 您将一目了然地看到趋势在哪个方向运行,它们持续多长时间以及它们有多强大。 所有这些使它成为初学者、高级和专业交易者的易于使用的趋势交易系统 。 分析功能 所有时间框架的实时趋势分析 所有时间框架的计算结果完全相同 配置您个人的时间框架集 可定制的趋势计算参数 图形功能 在紧凑模式、细节模式和仪表板模式之间一键切换 紧凑模式在一个缩小的面板中提供基本的趋势信息 细节模式提供相关符号的深入趋势分析 仪表板模式涵盖了所有主要的或你最喜欢的交易符号 只需在面板内点击一下,就可以访问所有的时间框架和符号 可移动的外汇趋势显示(通过拖放)。 适用于高分辨率的QHD、UHD和4K显示器 不需要重新画图 一般特征 自动的终端配置 针对平板电脑和触摸屏的使用进行了优化 通过电子邮件、信息和手机通知发出警报 为EA请求提供可访问的缓
49 USD
Trade Manager MT5
Daniel Stein
4.33 (3)
你想成为一个持续盈利的五星级外汇交易商吗? 1. 阅读我们简单的 交易系统 的基本描述 , 以及它在2020年的主要策略更新 2. 发送您的购买截图,以获得您的个人邀请,参加我们的独家交易聊天 该交易管理器 是所有喜欢使用全自动交易管理的 FX趋势 用户的理想补充。 它立即检测您手动开启的交易,并沿FX趋势线自动管理其止损。 完全自由地浏览所有时间框架而不影响你的订单。 你的交易是根据你在交易经理属性中设置的固定计算设置来管理的。 一个非常特殊和强大的功能是检测和管理由外部专家顾问开出的订单。 设置正确的EA魔法号码,你就能够按照你的个人趋势交易风格管理这些EA订单 。 功能 介绍 自动检测有效订单 自动设置初始止损 自动跟踪止损 自动检测活跃的专家顾问订单 自动管理活跃的专家顾问订单 反趋势交易的安全止损 可选择使用盈亏平衡止损 可选择设置止盈 一些交易操作的通知选项 在所有种类的交易符号上运行,如外汇、股票、商品、债券等。 在所有种类的离线图表上运行,如Renko和范围条形图 主要设置 时间框架。从下拉列表中选择用于计算趋势线的时间框架 外汇趋势周期。选择你喜欢的趋
49 USD
Lighthouse MT5
Daniel Stein
5 (18)
你想成为一个持续盈利的五星级外汇交易商吗? 1. 阅读我们简单的   交易系统   的基本描述 以及 它在2020年的主要策略更新 2.   发送你的购买截图,以获得我们独家交易聊天的个人邀请 Lighthouse   是一个惊人的精确和可靠的支撑和阻力指标。 它显示最重要的交易水平,并根据其相关性绘制。 如果一个水平被明显打破,它将改变其作用和颜色。支撑位变成阻力位,反之亦然。 主要特点 自动调整到基础时间框架 只显示重要的支撑和阻力水平 如果一个水平被明显突破,立即作出图形反应 较厚的SR水平比较薄的水平更重要 一般设置 分析模式:   在三种不同的扫描模式(日内、中度和高度时间框架)中选择,或使用默认设置的自动调整。 自动模式根据基础图表时间框架调整使用的分析模式。 敏感模式。敏感模式可以识别更多的支持和阻力水平。如果您是一个日内交易员,我们建议使用它。将此设置为   false   ,如果您想减少绘制的SR水平的数量。 SR距离(点)。这个可改变的数值是内置支撑和阻力位距离检查的基础。它测量当前价格与下一个Lighthouse水平之间的距离。如果当前价格与下
49 USD
Lighthouse
Daniel Stein
4.85 (96)
你想成为一个持续盈利的五星级外汇交易商吗? 1. 阅读我们简单的 交易系统 的基本描述 以及 它在2020年的主要策略更新 2. 发送你的购买截图,以获得我们独家交易聊天的个人邀请 Lighthouse 是一个惊人的精确和可靠的支撑和阻力指标。 它显示最重要的交易水平,并根据其相关性绘制。 如果一个水平被明显打破,它将改变其作用和颜色。支撑位变成阻力位,反之亦然。 主要特点 自动调整到基础时间框架 只显示重要的支撑和阻力水平 如果一个水平被明显突破,立即作出图形反应 较厚的SR水平比较薄的水平更重要 一般设置 分析模式: 在三种不同的扫描模式(日内、中度和高度时间框架)中选择,或使用默认设置的自动调整。 自动模式根据基础图表时间框架调整使用的分析模式。 敏感模式。敏感模式可以识别更多的支持和阻力水平。如果您是一个日内交易员,我们建议使用它。将此设置为 false ,如果您想减少绘制的SR水平的数量。 SR距离(点)。这个可改变的数值是内置支撑和阻力位距离检查的基础。它测量当前价格与下一个Lighthouse水平之间的距离。如果当前价格与下一级别的距离超过5个点,你将
49 USD
Visit our all-new   Stein Investments Welcome Page   to get the latest information, updates and trading strategies. Do you want to become a constantly profitable 5-star forex trader? Then  get our Stein Investments trading tools  and send us a screenshot to get your personal invitation to our exclusive trading chat with 500+ members. Crosshair is a fantastic tool that simplifies our chart analysis by bringing the price candles perfectly in line with the indicator values in the subwindows.
49 USD
SI Connect MT5
Daniel Stein
5 (4)
SI Connect是一个与我们的服务器建立连接的工具,以使用FX Volume或SIEA的交易系统。 准备您的终端使用SI Connect的技术说明 允许网络请求,在您的 终端选项 ->子类别 Expert Advisors 的允许URL列表中插入 https://stein.investments 。 你只需要在每个终端上运行一个EA实例,但它必须在后台持续运行,以便从我们的数据中心获取最新数据。 如果有问题,请发送私人信息,我们会协助。 SI Connect是一个与我们的服务器建立连接的工具,以使用FX Volume或SIEA的交易系统。 准备您的终端使用SI Connect的技术说明 允许网络请求,在您的 终端选项 ->子类别 Expert Advisors 的允许URL列表中插入 https://stein.investments 。 你只需要在每个终端上运行一个EA实例,但它必须在后台持续运行,以便从我们的数据中心获取最新数据。 如果有问题,请发送私人信息,我们会协助。
FREE
你想成为一个持续盈利的五星级外汇交易商吗? 1. 阅读我们简单的 交易系统 的基本描述 , 以及它在2020年的主要策略更新 2. 发送您的购买截图,以获得您的个人邀请,参加我们的独家交易聊天 该交易管理器 是所有喜欢使用全自动交易管理的 FX趋势 用户的理想补充。 它立即检测您手动开启的交易,并沿FX趋势线自动管理其止损。 完全自由地浏览所有时间框架而不影响你的订单。 你的交易是根据你在交易经理属性中设置的固定计算设置来管理的。 一个非常特殊和强大的功能是检测和管理由外部专家顾问开出的订单。 设置正确的EA魔法号码,你就能够按照你的个人趋势交易风格管理这些EA订单 。 功能 介绍 自动检测有效订单 自动设置初始止损 自动跟踪止损 自动检测活跃的专家顾问订单 自动管理活跃的专家顾问订单 反趋势交易的安全止损 可选择使用盈亏平衡止损 可选择设置止盈 一些交易操作的通知选项 在所有种类的交易符号上运行,如外汇、股票、商品、债券等。 在所有种类的离线图表上运行,如Renko和范围条形图 主要设置 时间框架。从下拉列表中选择用于计算趋势线的时间框架 外汇趋势周期。选择你喜欢的趋
49 USD
SI Connect
Daniel Stein
5 (2)
SI Connect是一个与我们的服务器建立连接的工具,以使用FX Volume或SIEA的交易系统。 准备您的终端使用SI Connect的技术说明 允许网络请求,在您的 终端选项 ->子类别 Expert Advisors 的允许URL列表中插入 https://stein.investments 。 你只需要在每个终端上运行一个EA实例,但它必须在后台持续运行,以便从我们的数据中心获取最新数据。 如果有问题,请发送私人信息,我们会协助。 SI Connect是一个与我们的服务器建立连接的工具,以使用FX Volume或SIEA的交易系统。 准备您的终端使用SI Connect的技术说明 允许网络请求,在您的 终端选项 ->子类别 Expert Advisors 的允许URL列表中插入 https://stein.investments 。 你只需要在每个终端上运行一个EA实例,但它必须在后台持续运行,以便从我们的数据中心获取最新数据。 如果有问题,请发送私人信息,我们会协助。
FREE
Visit our all-new   Stein Investments Welcome Page   to get the latest information, updates and trading strategies. Do you want to become a constantly profitable 5-star forex trader? Then  get our Stein Investments trading tools  and send us a screenshot to get your personal invitation to our exclusive trading chat with 500+ members. Crosshair is a fantastic tool that simplifies our chart analysis by bringing the price candles perfectly in line with the indicator values in the subwindows. You
49 USD
筛选:
Ingo Reimann
178
Ingo Reimann 2023.12.21 16:13 
 

The best and most precise product that I have had the pleasure of getting to know in my trading career. I can recommend it to everybody. Since I started using these products, trading has also been working. The support from the developers and the community are also in a class of their own.

Daniel Stein
90613
来自开发人员的回复 Daniel Stein 2023.12.21 16:27
Dear Ingo, thank you very much for your outstanding feedback. It's highly appreciated, and we're more than happy having members like you in our trading group. 🙂
Tim Eubanks
5733
Tim Eubanks 2023.08.31 02:51 
 

Very ineffective tool!

Daniel Stein
90613
来自开发人员的回复 Daniel Stein 2023.08.31 07:31
And for me, it's the most efficient tool because it tells me exactly when it's worth looking at the market.
If you like to know how I use FX Volume for my daily manual trading, I suggest taking a look at my Volume Power description at https://www.mql5.com/en/blogs/post/753806 You can also subscribe to our Morning Briefing channel to get daily updates, details and screenshots at https://www.mql5.com/en/channels/morningbriefing
Both help to get a better understanding of how to work with FX Volume.
Juan Chacon
1153
Juan Chacon 2022.11.16 21:16 
 

I bought it twice and it was a waste of time and money, please do not spend your money, my advice is to use stop loss and exceed the profit ratio.

Daniel Stein
90613
来自开发人员的回复 Daniel Stein 2023.08.25 19:41
Dear Juan, I don't understand how Volume is related to using a stop loss. And why did you never raise any questions about how to use this kind of real-market data? I recommend taking a look at my Volume Power description at https://www.mql5.com/en/blogs/post/753806 which explains in all details how I use FX Volume for trading. You can also subscribe to our Morning Briefing channel to get daily updates, details and screenshots at https://www.mql5.com/en/channels/morningbriefing And finally, we do have FX Volume info channel on Telegram at https://t.me/SI_FX_Volume to understand in-depth what FX Volume is about
3316589p
865
3316589p 2022.08.29 20:34 
 

Hi Daniel, Great indicator used in conjunction with Fx Power, an invite for the the chat group would be appreciated

Daniel Stein
90613
来自开发人员的回复 Daniel Stein 2022.08.29 20:54
Thanks a lot for your positive feedback. I sent you an invitation via private message. Best regards, Daniel
wuzzy66
853
wuzzy66 2022.07.02 09:41 
 

Another excellent product from Daniel who is the creator this indicator lets you make informed Decision ASAP when you know the volume of the trade is been concentrated on tried it on Gold excellent it showed be that there was more volume on the Dollar than Gold and took straight a sell position which paid off no more guess work with this indicator combing it other tools such as the FX power

Daniel Stein
90613
来自开发人员的回复 Daniel Stein 2022.07.02 18:18
Thanks a lot for your detailed review and excellent feedback. It's highly appreciated.👍
Carlos Alexandre Ribeiro Da Silva
362
 

Excellent indicator, I resubscribed it because it is not the entry trigger, but the "certainty" of the market direction. It brings you the peace of mind of following the big players. Not to mention the support of all Daniel's products. More than I recommend!!!

Daniel Stein
90613
来自开发人员的回复 Daniel Stein 2022.07.02 18:17
Thanks a lot for your wonderful review. 👍
Thomas Bradley Butler
28776
Thomas Bradley Butler 2022.03.29 19:50 
 

maybe long term but not for day trading. Long +6000 USD and -300 GBP with 62% long USD and 30% long GBP. Should sell GBP/USD but it does the opposite. Really just confusion. lost most of the trades with the volume

Daniel Stein
90613
来自开发人员的回复 Daniel Stein 2022.07.02 18:16
Hi Thomas, I recommend having a look at its info channel to get a better understanding of how to use FX Volume https://t.me/SI_FX_Volume
josedan
324
josedan 2022.01.31 15:52 
 

This is the best tool as far as am concerned.. As a trend trader, you need volume and all what I see in the market is tick volume.. Daniel was able to come up with this amazing tool and the tool has made me realize that what I was taught by NNFX about tick volume is garbage... So many people criticise the tool for being lagging but I differ... Fxvolume is not lagging, you have to find a way as per how to use it so as to fit it into your system... I am only pleading with him to include minute comparison because it is what I use in entering trade in time... Please Daniel include minute comparison. I contacted Daniel about including minute comparison which he earlier promised to include but he said the update does not gather enough momentum and directed me to use history lines... I do use history lines but it is stressful... Please include minute comparison in the tool for me.. Daniel and co.... have reached out to me as per the minute comparison... They have promised to look into it... I must commend them for excellent customer service delivery.. Daniel has been so helpful in helping me as per answering my questions.. Yes, the requested feature is there in the updated version... I do really like it

Daniel Stein
90613
来自开发人员的回复 Daniel Stein 2022.04.01 14:36
Dear Jose, the requested feature has been released with version 4.0. We're sure you'll like it.
victor9090
632
victor9090 2021.12.09 23:10 
 

Simplemente voy a decir una palabra: Gracias! He encontrado lo que siempre he querido. Simplemente maravilloso trabajo y lo seguiré pagando por muchos años mas.

MILAD ORANGI
117
MILAD ORANGI 2021.12.09 21:42 
 

Unfortunately, the support was not as good as I thought and will not be updated

Daniel Stein
90613
来自开发人员的回复 Daniel Stein 2021.12.24 12:42
Dear Milad, you can't request a new feature and expect to get it immediately. Of course, we improve and update our tools regularly, but we follow our schedule, not yours.
motsusi
170
motsusi 2021.08.12 01:46 
 

Fx Pqwer assisted me great deal with my trading but is limited to currencies. As I ventured into gold, I realised there was a huge gap left by absence of Fx Power. I reluctantly purchased Fx Volume as it covers gold. That has been one of my best ever decisions in trading this year. Fx Vlolume coupled with Fx Trend is indeed a masterpiece. Than you Daniel for this 35th century innovation.

Zachary David Cox
914
Zachary David Cox 2021.04.12 14:10 
 

Very helpful and well done indicator. Thanks

cicas65
219
cicas65 2021.03.10 10:35 
 

Un'unica parola per descrivere l'estro di Daniel: Stupefacente! Tutti i prodotti di altissimo livello. Complimenti Daniel sei un grande! One word to describe Daniel's inspiration: Amazing! All products of the highest level. Congratulations Daniel you are great!

safariforex
136
safariforex 2021.03.08 22:50 
 

If you are reading this message, congratulation, you finally made it. Welcome to the winning team. And no it's not a sale pitch, just showing my appreciation for the author and his amazing indicator.

Arnel Arnao
1979
Arnel Arnao 2021.03.04 07:21 
 

First Thank you for sharing this indicator. Its Highly Recommended Indicator. Worth every penny. I recover the rental fee in just 1 day of trading. The Customer service is excellent. I just have 1 wish and I hope Stein will look into it that will make this more powerful. I wish Stein will provide an option for showing volume data in a single panel instead of switching back in forth in the options. I want to see Ratio,Change, Long/Short/total volume at one glance. Sometimes I missed some important information because I did not check it. Overall 6 stars for this excellent indicator.

Daniel Stein
90613
来自开发人员的回复 Daniel Stein 2021.03.04 08:46
Hi Arnel, first of all, thanks for your positive feedback. We're happy you enjoy using FX Volume. A combined view of all information is already on our todo list, but you can also combine several FX Volume instances in one chart to get all the information you need. Here's the corresponding post of our FX Volume info channel https://t.me/SI_FX_Volume/57. In case of questions drop a line and I'll assist. All the best, Daniel
LUDY LAMBARA
1327
LUDY LAMBARA 2021.01.13 08:37 
 

this is the best trading tool ever shared to public.... and the support was very quick.... 5star

Sandy Wahyudi
585
Sandy Wahyudi 2020.12.04 16:39 
 

Amazing all tools from Daniel. I have already use all tools..trend, power, lighthouse, volume, and power play. Just follow STS and forget it. All my trade like the games. Good suuport too from Daniel. Thanks.

RDI
1482
RDI 2020.11.09 22:07 
 

Good Work.!

crimson
456
crimson 2020.07.15 14:34 
 

This volume indicator is unique and amazing. Somehow it didn't go well with my trades. It shows real volume data, but seems lagging indicator to me.

Ackerwald
141
Ackerwald 2020.07.03 09:27 
 

A really helpful tool and a very good support !!!

12
回复评论
版本 4.55 2023.08.30
Fixed bug when symbols alert enabled
版本 4.54 2023.08.07
Fixed color change bug on history line labels
版本 4.53 2023.08.01
Added INSTANCE_ID input parameter

Fixed GOLD bug, shifting all currencies data
版本 4.52 2023.07.31
Fixed iCustom call, sometimes displaying the panel

Added Gold input parameters, and updated to use last framework changes
版本 4.51 2023.07.27
Fixed alert input parameter labels
版本 4.50 2023.07.26
Fixed invalid pointer, framework bug when no history lines are displayed

Fixed bug in loading FXV parameters
版本 4.49 2023.07.25
Fixed MT4 strategy tester issue of missing history line colors
版本 4.48 2023.07.24
Fixed minor bugs

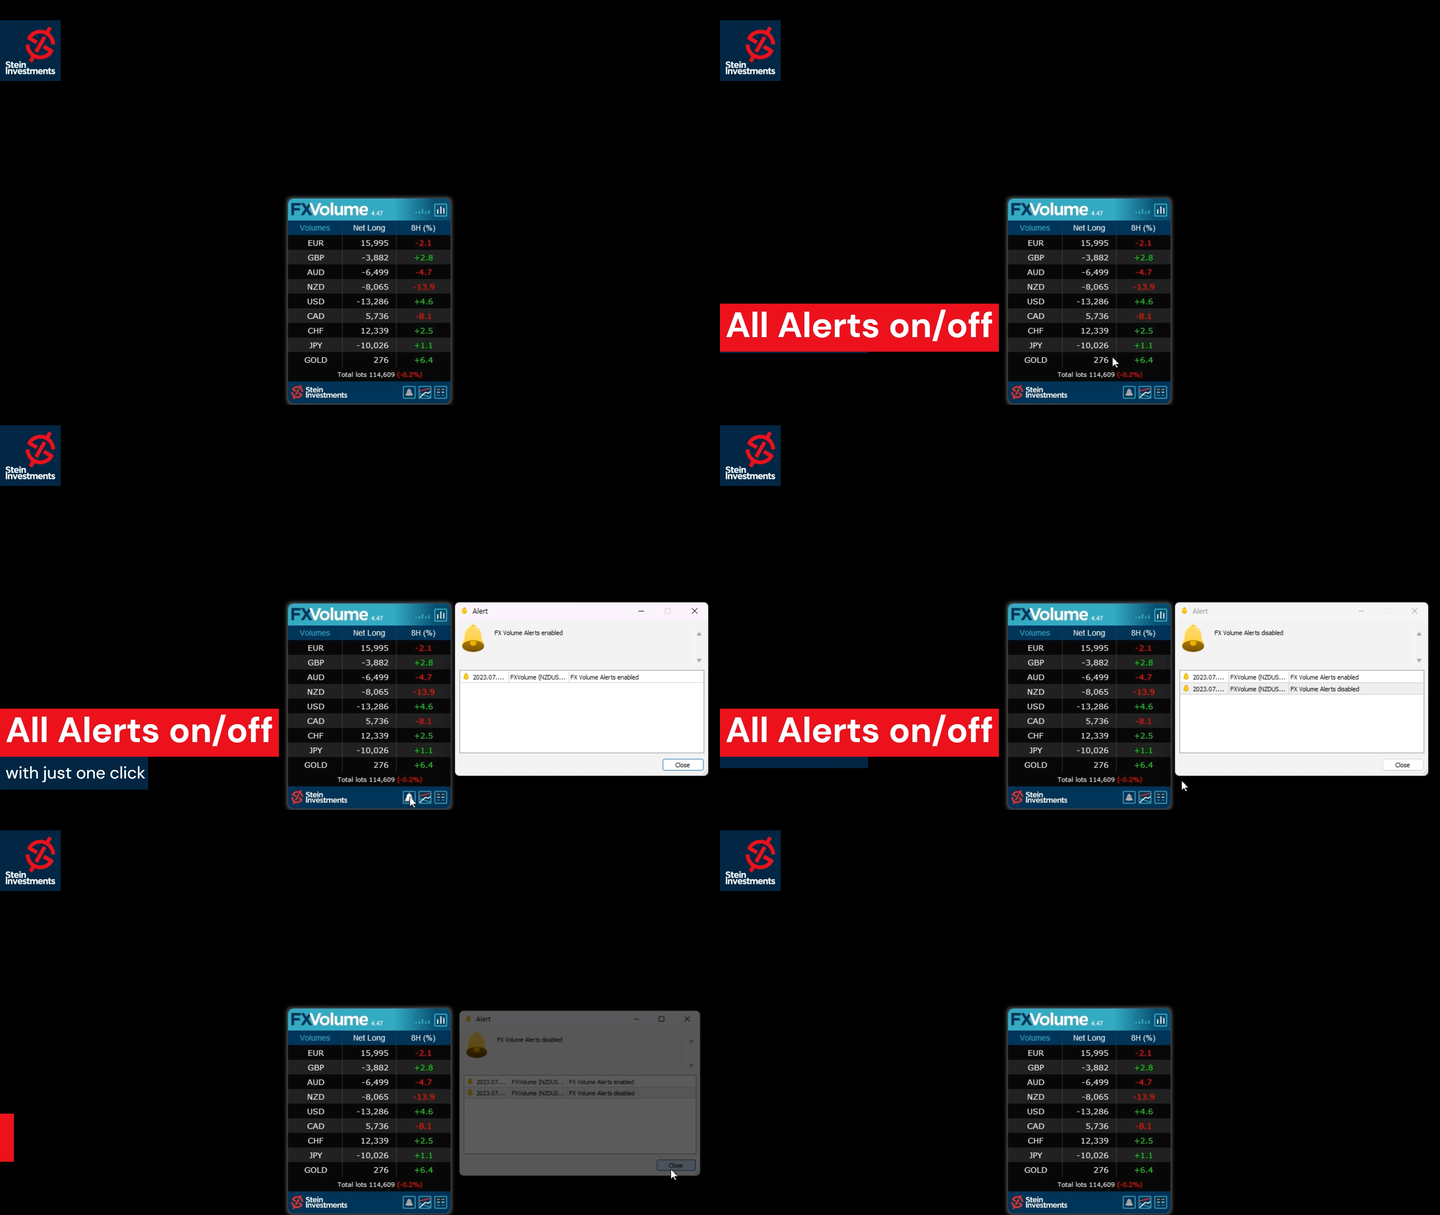
Added an alert button in the panel

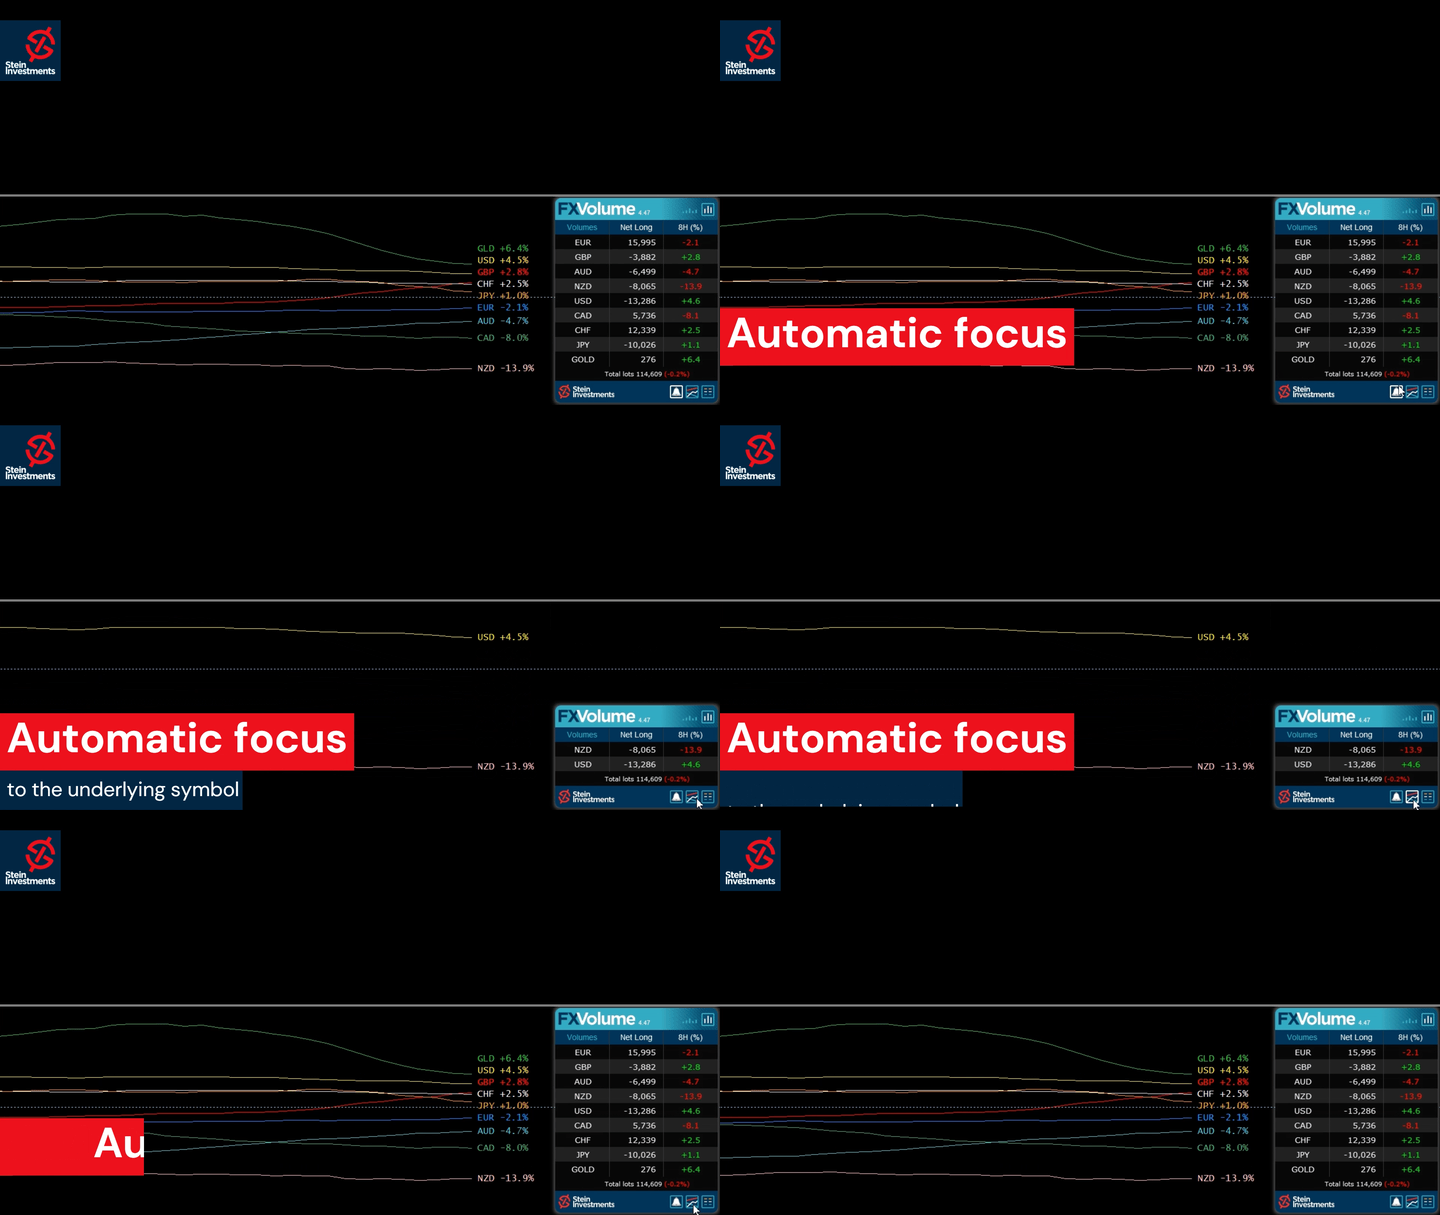
Alerts are now individually configurable according to currencies selected

Update with last framework and generic changes

Changed input parameters (without effect on iCustom requests)

Changed currency sorting in the panel following a logical convention for symbol names
版本 4.42 2023.06.01
Fixed GUI DPI adjustment bug
版本 4.41 2023.06.01
⚠️Due to necessary changes in our panel management, you have to reconfigure your charts once after the update⚠️

New Features
Added history mode "Net Long % change"
Added new main panel view "Net long % change"
Added alerts for "Net long % change" drop & rise

Changed indicator label on chart to display one decimal at % values
Changed indicator digits according to history mode
Changed the zoom factor to use % values
Symbols list refactoring as a new panel


Graphics
New rounded corner panel design.
Added a different color for the "Past" data column.
Added input for panel back color if the auto-scheme is disabled
Improved plot labels display to avoid overlapping. (MT5 only)


Under the hood
Apply complete internal refactoring
Apply the last framework update
版本 4.10 2022.03.08
Fixed resource loading issue on some Mac/Linux systems

Fixed graphical panel bug when missing past data
版本 4.0 2022.03.02
FX Volume 4.0 comes with two additional features.

1. The option to use the internal comparison calculation on a minute basis which allows comparison below our previous minimum of 1 hour.

2. Inspired by our fellow trader Luke, we created a Net Long Volume view including history lines to understand better how the Net Long volume correlates with the market moves we see on the chart.

Check our Stein Investments YouTube channel to see a video of the new features.

We're sure you'll like the new features.
版本 3.58 2021.09.01
Optimized FX Volume to be fully compatible with MT4/MT5 templates
版本 3.53 2021.05.08
Transition version to use data in common data folder

Fixed bug with GMT when running FX Volume on a weekend for the first time

Optimizations when used as free demo version in the strategy tester

版本 3.50 2021.04.08
Fixed minor bug when alerts are enabled
版本 3.49 2021.04.01
This update contains the following changes:

- New Alert options based on Long and Short Volume
- New Alert filters based on the dominance of one side available,
i.e. if Volume Long is bigger than Volume Short, you'll get only alerts for the Volume Long side
- Improved communication with the new SI Connect 2.x
- Optimized settings managements

and these changes are related to the strategy tester usage

- Fixed current candle update bug
- Added parameter to start with a focus on chart currencies
- Improved backtesting performance
版本 3.35 2021.03.11
Fixed M1 issue when used in the strategy tester
版本 3.34 2021.03.10
Fixed row labels in Changes view
版本 3.33 2021.03.10
Internal refactoring
Changed SI Connect detection method
Improved performance when used in the strategy tester
版本 3.28 2021.02.26
FX Volume GUI enabled in Strategy Tester visual mode when called via iCustom
版本 3.27 2021.02.26
Besides various minor fixes and improvements we made a few specific improvements when using FX Volume inside an EA and in the strategy tester like:

- Improve behaviour when called from iCustom
- Improved data processing (all modes)
- Fix minor display bugs while using the visual mode
- Disabled alerts in tester mode
版本 3.25 2021.02.22
Optimized SI Connect EA detection in case of heavy usage (more than 20 instances)
版本 3.24 2021.02.17
Fix symbols list display (top of the list possibly hidden)
版本 3.23 2021.02.17
With this update, it's finally possible to combine different views AND comparison periods in just one chart.

In this way, you'll easily see if the short term volume is still dynamic and supporting the volume change of a higher period.
This offers an entirely new grade of precision because you now see exactly when to enter when to exit and if it's still worth to hold the position.

We hope you'll enjoy the new flexibility provided by FX Volume.
版本 3.18 2021.02.10
Fixed bug resulting in orphan objects on the chart

Fixed bug of line style changes when using several instances
版本 3.17 2021.02.04
This release is another huge step forward and provides the following new features.

- Additional colouration for the positive and negative percentage values

- History lines for Volume Total, Volume Long and Volume short are now available

- All history lines can be hidden completely via parameters in the indicator properties

- Use multiple instances of FX Volume in one chart to create individual comparison views.
Note: Every instance has to use a different "History lines and buffers" mode to manage all instances correctly.

- Volume Total, Volume Long and Volume Short are now available in the indicator buffers

IMPORTANT: Please note that the history lines and the panel information is managed independently!
If you switch to a different panel view, this does NOT change the volume history lines. You have to change them in the indicator properties.

Please note also that the value labels of the history lines differ from the information seen in the panel because the panel displays always the latest available information while the history line buffer provides an OHLC volume data average for the entire candle. Please visit our FX Volume info channel at https://t.me/SI_FX_Volume to get more detailed information
版本 3.1 2021.02.01
Renamed view labels for a better usability
版本 3.0 2021.02.01
This major update provides a deeper insight into the real trading market sentiment

Now you can see the total volume of the long and short side separately as well as how it changed during the selected comparison period. With this information, you can easily spot on which side of the market there is an upcoming dynamic in the real trading volume.

And because we are often asked for it we added all this information for GOLD as well.

Enjoy the new amazing features of FX Volume and leave a review if you like it.
版本 2.26 2020.12.21
Fixed minor bug occurring rarely at a terminal restart
版本 2.25 2020.12.18
Minor bug fixed causing an empty panel due to unchanged data

Added special section for the alert option in the indicator properties
版本 2.24 2020.12.16
The following new features have been added:

-Alert on long ratio rise/drop
-Alert on total volume rise/drop
-Alert on delta increase/decrease

We hope you'll enjoy the new alert options.
版本 2.22 2020.12.02
Disabled DEBUG mode
版本 2.21 2020.11.23
Fixed empty panel bug
版本 2.20 2020.09.18
Changed Delta calculation display to provide more accurate results

Added total volume buffer -> ask for the updated code snippets

FX Volume is now ready to be used in the MT4 strategy tester!

Please note that you have to copy the FX Volume data file manually from \\MQL4\Files to \\tester\files\SI Lab in your terminal's data folder to be able to run backtests with FX Volume in your MT4 (an MT5 handles this task automatically)

版本 2.16 2020.06.24
The panel uses current and raw data only. OHLC is used only for history lines.

Fixed bug in panel update when data are not directly available.

Added an alert for insufficient Terminal "Max bars" settings.
版本 2.0 2020.06.20
Dear customers, please welcome our fantastic FX Volume 2.0. We spent weeks of work designing this beautiful panel, adding excellent features, and providing more detailed information to offer you outstanding user experience and a real edge in trading.

To benefit from all improvements it is necessary that you update FX Volume and SI Connect to the latest available version!
版本 1.26 2020.05.14
Fixed bug in detecting the SI Connect EA
版本 1.25 2020.05.14
Use updated libraries
版本 1.24 2020.03.09
Added security to avoid alert flooding

Fixed bug which checks and sends alert continuously if the data file can't be opened
版本 1.23 2020.03.08
Improved backward compatibility
版本 1.19 2020.03.08
Improved EA detection -> switch to SI Connect
版本 1.15 2020.03.04
Fixed bug chart changing to EURUSD when clicking above "Changes/Ratios" label

Added the possibility to set your individual color and line style via the Colors tab at the indicator properties
版本 1.13 2020.03.02
Fixed GMT Offset