版本 4.0
2024.04.09
- Keyboard - Fix Ctrl and Shift Click mappings on MT5
版本 3.9
2024.01.11
- Asian Session - Change default TK session to 01:30
- Add Initial Balance Size (IB Size) to Summary Panel
- Keyboard - Fix Ctrl and Shift Click mappings on MT5
版本 3.8
2022.02.07
- Highlight Open Above High and Open Above Low in the Summary panels
- Add option to display close price in the summary panels
- Fix Halfback colour parameter
- Add Preset file with colour scheme for dark backgrounds
版本 3.7
2021.05.18
Enhancements
- Add Overall Volume Show Value Areas parameter
Fixes
- Reduce number of calculations when snap to grid is enabled
- Improve auto TPO size for futures contracts with single digit quotes
版本 3.6
2021.05.10
Fixes:
- Hotkeys - Keep Hotkey panel hidden when switching timeframes
版本 3.5
2021.05.05
Enhancements
- Profiles - Add parameter "Clear Hotkeys On Terminal Close" to improve profile switching on MT5
- Offline Charts - Add support for offline charts and backtest tools with missing market data and unsynced current time
Fixes
- Mouse Events - Keep CHART_EVENT_MOUSE_MOVE enabled if other indicators are waiting on mouse events
版本 3.4
2021.04.20
Enhancements
- MT5 - Add support for extended timeframes
Performance
- Clear Hotkey - Improve performance of clear chart calls
- Recalc Triggers - TpoTolerance - Ensure consistency across snapped to grid and unsnapped profiles
版本 3.3
2021.04.08
Enhancements
- Snap To Grid - Add option to map TPO to a fixed price grid rather than TPO stacked from lowest price (Dalton)
- Snap to Grid - Add parameter to offset all the TPO prices (TPO Size factor)
- Snap to Grid - Add button to Hotkey Panel
- Line Extensions - Add button to Hotkey panel
Fixes
- Max TPO Rows - Change default from 300 => 150
- Demo Modes - Add Snap To Grid and Line Extensions to demo modes
- Demo Modes - Improve handling of user set parameters in the strategy tester
Performance
- Hotkeys - Reduce redraw time when hotkeys pressed (especially with large numbers of profiles)
- Real time - Reduce number of calculations when TPO Tolerance parameter is set
- Real time - Reduce number of calculations when Snap To Grid is enabled
版本 3.2
2021.03.04
Enhancements
- Summary Panel - Highlight increased Tpo Size when Max Tpo Rows limit is breached
- Parameters - Write simple list of changed parameters to experts log when Ctrl+Q keys are pressed
- Parameters - Create detailed report of changed parameters in Files/Blahtech directory to assist users and support
Fixes
- Tpo Size - Improve automatic calculation for assets with one digit prices
- Tpo Size - Improve recalulation of Tpo Size when Max Tpo Rows limit is breached
- Max Tpo Rows - Change default from 500 => 300
- Expert Advisor Mode - Change to a single option named "Reserved For iCustom Calls"
版本 3.1
2021.01.20
Enhancements
- Volume Text - Add parameters to set colour and size of chart volume text
- Inline Charts - Add "Volume Separate" and "Volume Opposing" graphics chart options
- Inline TPO Charts - Decouple "Inline Charts" from "Inline TPO" so both can be on the chart concurrently
- Profile Line Titles - Add parameter to allow user to set custom text for the chart profile titles
- Chart Zones - Add parameter "Ranges - Draw To End Time" to extend drawing of session zone boxes to the next candle (Default false)
- Profile text - Add parameter "Profile Text Show Previous" to control display of previous profile text on left of chart
- Prices - Add parameter "Profile Lines Prices Only Show Final" to clean up display by only showing prices for last profile
- Intervals - Add "Decades" to the intervals to enable creation of longer term profiles (also add five year preset file)
Fixes
- Summary Panel - Improve text scaling and layout of Summary Panels
- Summary Text Size - Change default text size from 7 to 8 for clarity on 27 inch 1440p monitors
- Expanded letter TPO - Draw Sunday letters correctly on Sunday candles (Mn Of Qu preset)
- Profile Text - Fix font scaling on right hand profile text
版本 2.9
2019.08.01
Enhancements
- Add option to display Interval + Session for profile titles
- Add IntervalMultipler to support more advanced schedules
Fixes
- Clear candles from the chart when Style is set to Letters
版本 2.8
2019.06.19
Enhancements
- Add parameter to configure Calculator Max Tpo Rows
- Add option to display Halfback profile lines on the chart
- Left clicking any description in the Hud Panel now resets the value back to its input parameter version
Fixes
- Fix custom schedules for Overall Volume
- Do not override user set TPO sizes when cycing through presets
- Change defaults to display more features on chart at startup
- Remove extended profile lines from Days Of weeks preset
- PocLine PocArea - Reformat and swap display values round so MaxTpoWidth comes before TotalTpo
版本 2.7
2018.05.15
Changes
- Remember Chart Clear setting on terminal restart
- Use TPO Size as the default when Vol TPO Size is 0.0
- Set Chart Joines to Hidden for demo modes
版本 2.5
2017.08.29
Enhancements
- Add option to set number of bars for initial balance and/or rotation rule
- Add option to set hourly intervals for profiles on the lowest timeframes
- Add option to display the prices for the profile lines
- Add option to display Naked POC extension profile lines
- Add option to display volume text alongside the TPO rows
- Add option to configure the Open and Close letters within the profile text
- Remember hotkey states when restarting terminal
- Support iCustom calls with 64+ parameters by using a set file
Fixes/Changes
- Only highlight rotation rule when it closes within the configured bars
- Add tooltips to summary panel rows
- Add reserved keys parameter to prevent clashes with other products
版本 2.3
2017.04.06
Enhancements
- Support individual start letters for each schedule
- Support simple statistics in profile titles
Fixes
- Fixed the order that inline charts are displayed when shift-"n" key is used
- Clear Charts - Forced redraw rather than waiting for next tick
- Rebuilt with latest compiler for MetaTrader platform changes
版本 2.2
2017.03.09
New features
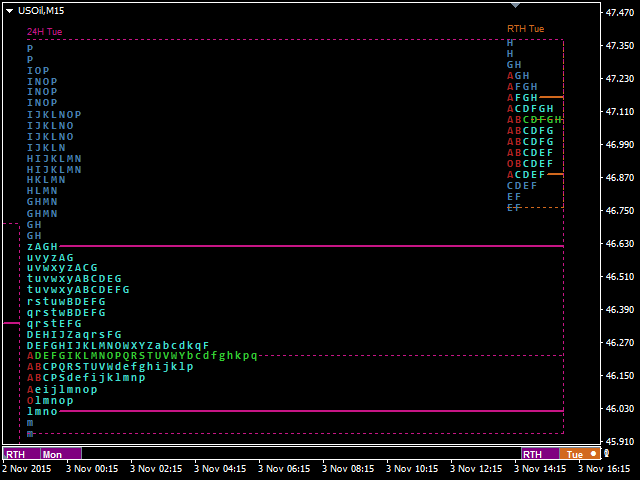
- Added inline charts with TPO letters and expanded TPO letters
Enhancements
- Added the option to clear candles from the chart
- Added the option to exclude weekend schedules
- Allows a user to choose schedules for multi session display
= Inline charts
- Added "Profile and Volume Separate" and "Profile and Volume Opposing"
- Added the option to display charts as bars
- Allows a user to adjust font sizes and spaces of inline letters
= Presets
- Added "TPOs" demo mode
- Added the "Futures Of Days" profile (AMP Futures setup)
= Summary Panel:
- Option to hide the panel
- Allows a user to configure row contents
= Hotkey panel:
- Added the button for auto/fixed price scale
- Added the button for broker/tick volumes
- Added the buttons for adjusting TPO letter font sizes/spaces
- Reverse order of hotkey changes when the Shift key is pressed
- Support multi region keyboard layouts
Fixes
- Improved default TPO tick sizes
- Changed HK session to start at midnight
- Improved scaling of panels when font sizes are changed
- Changed timeframe enums, so MT5 version can share set files with MT4 version
- Support 8-digit instruments in summary panel
Performance
- Backtest - only redraw older schedules when the day changes
- Optimized the code that gets executed each tick
New Hotkeys
- "`" - chart candles - show/clear
- "7" - inline TPOs - graphics/TPOs/expanded TPOs
- "e" - inline TPOs - adjust a font size
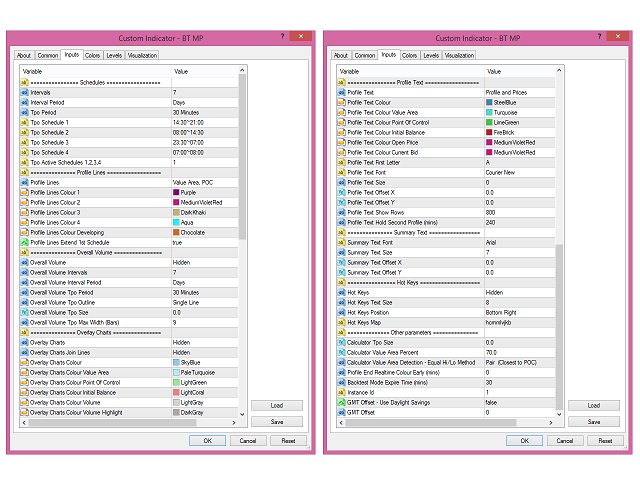
Parameters
- See the parameters documentation for details - http://www.blahtech.co.uk/marketprofile
版本 2.0
2016.12.09
New Features
- Support multiple developing schedules HK,LN,NY rather than just the first one in the list
- Automatically switch focus to the next session as it becomes active
- Add configuration presets for some standard schedules on higher timeframes
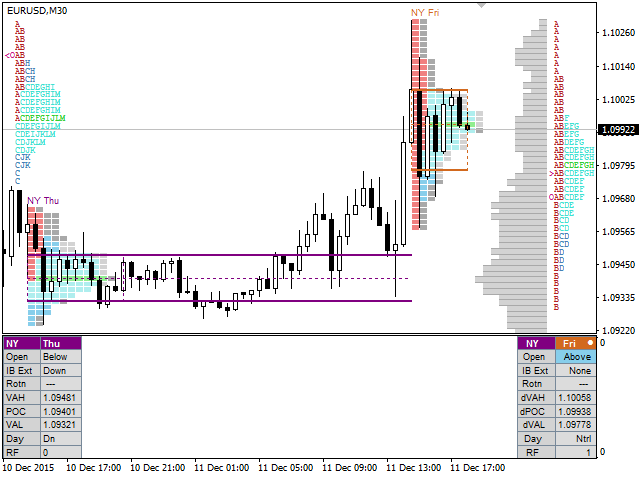
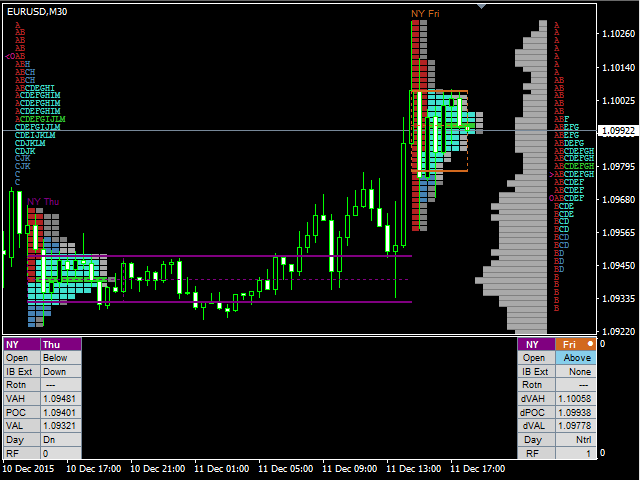
- Highlight of business rules – Open, IB Extension and Rotation Rules
Enhancements
- Schedules - Increase number of custom schedules from 4 to 7
- Overall Volume - Change default VolumeIntervals from 7 to 1
- Demo Mode - Allow user to switch between default and demo settings
= Profile Lines:
- Display session and interval titles on the chart
- Add option to switch off vertical lines
- Add option to change line styles for Start, End and Extension line
- Add option to set different colours and styles for HIGH, VAH, POC, VAL, LOW
= Summary Display:
- Draw summary display as a panel rather than simple text
- Add TPO Timeframe row
- Change titles to session name and interval name
- Support clicking on title to change schedule focus
- Add dot icon to title to highlight when auto schedule mode is active
= Hotkey display:
- Add verbose display
- Move panel from main window to sub window
- Allow user to change value by clicking on the rows
- Support clicking then dragging panel to new location
- Highlight values that have changed from input parameter settings
Fixes
- Hotkeys - Update position when window height is changed
- Backtest - Use TimeLocal for backtest expire so it works when market is closed
- Reset - Force clear and redraw of all objects on Reset
Performance
- Only refresh each tick if next level has been touched or broken
- Only redraw Hotkey display if chart width has changed
New Hotkeys
- "9" - Demo mode
- "0" - Presets
Parameters
- See parameters documentation for details http://www.blahtech.co.uk/marketprofile
版本 1.1
2016.04.12
- Bug Fix : Schedules - Fix error with schedules that span midnight
- Enhancement : Charts - Improve tooltips
- Enhancement : Charts - Add Hotkey "T" - Temporarily double the Ticksize
- Enhancement : Charts - Add Hotkey "Y" - Switch to the alternate schedule/session
- Enhancement : Summary - Change BUY/SELL/NTRL to UP/DN/NTRL
- Enhancement : Developers - Add support for iCustom buffers 0=Empty 1=VAH 2=POC 3=VAL 4=dVAH 5=dPOC 6=dVAL
- Enhancement : Daylight Savings - UseDaylightSavings parameter - Change default to true
- Enhancement : High Res Displays - WindowsDesktopScaling - Add parameter to support desktop scaling for 4K and other high res screens
- Performance : Backtest Mode - Do not recalculate every tick when in backtest mode


Amazing tool! I love the ability to switch between, sessions, daily, weekly and quarterly profiles instantly.