 MetaTrader 5
 专家
专家
 指标
指标
 程序库
程序库
 实用工具
实用工具
 窗口小部件
窗口小部件
 规则
规则
适用于MetaTrader 5的EA交易和指标 - 487
 使用EA交易和指标,使外汇交易获得更多盈利。EA交易可使您自动开启和关闭交易,而指标将帮助您更准确地预测市场行为。
该页面提供MetaTrader 5应用程序的目录。
使用EA交易和指标,使外汇交易获得更多盈利。EA交易可使您自动开启和关闭交易,而指标将帮助您更准确地预测市场行为。
该页面提供MetaTrader 5应用程序的目录。 
UR前端后端
UR FrontEndBackEnd 是我最喜歡的公式,用於找到最準確的支撐和阻力水平。 我還將它們分成不同的類別(虛線、實線和區域)以標記它們的強度。 所有這些都存儲在緩衝區中,因此它們很容易在其他工具中訪問和實施。
添加:該工具可能需要根據它所應用的資產進行調整 - 資產在影響該工具的價格方面的 digis nr 方面有所不同。 設置中提供了所需的參數。
使用 UR FrontEndBackEnd 的優勢:
只需 2 個參數即可設置計算的密度和距離 支撐和阻力存儲在緩衝區內,從給定資產的價格開始上升/下降 3 種線條,用於快速視覺反饋支撐/阻力線的強度 -> DASHED、SOLID 和 AREA 有一個特殊的電報聊天,您可以在其中了解最新的工具更新,如果您覺得缺少什麼,也可以發送請求!
為什麼選擇 UR FrondEndBackEnd?
它是最容易使用和設置的支撐/阻力指標 - 也可以在其他工具中實施 - 所有數據都易於讀取並存儲在 4 個緩衝區中。
如何使用 UR FrondEndBackEnd ?
請參閱下面的描述以更熟悉它:
設

RISK TO REWARD TOOL for MT5 with UI on chart: (creates similar RR boxes like on tradingview) -creates and deletes draggable boxes on chart, ANY SYMBOL, ANY TF. Menu buttons:
NEW BUY, NEW SELL, DELETE ALL, ( and minimize) -draggable target TP level
-draggable SL limit level
-text labels with pips SL TP, RR ratio-there is no limit of boxes
-but program remembers first 100 boxes after changing input. there is parameter "delete_on_init" so false = every created box stays as it is, true

Smart Market Scanner and Dashboard The trend is very important when trading a financial instrument. The trend can be identified by checking various of structures and indicators. Trend shifts can be identified by trendline breakouts and horizontal support/resistance levels. Scanner will scan the selected symbols and show you the direction/trend on selected timeframes. Algo is based on: Price Cycles, Fractals, Order Blocks, Hi-Lo
Advantages: Multi timeframe Multi instruments including Currencies,

Three Triple Exponential Average oscillators merged into one. Fast period will pull on the slower period, and the slower will smooth out the faster and avoid early positions. You can use 2 fast and 1 slow, or Fibonacci range or 2 slow, 1 fast. NOW FREE. But please consider supporting me by buying my 2 for sale indicators.
You can use this as an entry indicator and exit indicator. Open when the tripleTRIX line crosses the zero line and close when it starts to reverse. When the peaks get bigger,
This robot is based on an MACD strategy for trending markets. The description of the strategy can be found on the attached youtube video. The video explains the strategy and shows a basic backtest and optimisation on a few symbols. It is advised to carry out a a backetst and optimisation of your own before using the robot. The video can be found at >> https://www.youtube.com/watch?v=wU_XCM_kV0Y  ;

Nade com os grandes ou evite-os a todo custo. Com esse indicador, a escolha é sua! Indicador por coloração de barras, com respostas simples se os "grandes" estão negociando ou não. Saiba quando agir se o mercado está calmo ou agitado, de forma simples, pelo valor de retorno do indicador ou pela aparência das barras.
Indispensável indicador para a construção do seu robô ou para seu setup. Resultado do Indicador: 0 - 5. Participantes do mercado: 0 e 1 = Big Players! 2 e 3 = Dia normal. 4 e 5 = Mo

Две простых симметричных пробойных трендовых системы для лонгов и шортов, которые работают абсолютно независимо друг от друга. В основе алгоритма открытия позиций пробой ценой по тренду мувинга, сдвинутого по вертикали на фиксированное в настройках эксперта количество пунктов. Входные параметры эксперта разбиты на две большие группы: Для лонгов с префиксом "L";
Для шортов с префиксом "S". Поскольку в данном эксперте две торговые системы, то оптимизировать и тестировать их сперва следует отдельн

OPTIMIZE For settings. SL and TP should Start with 50000 Important to get the optimization before backrest and use. I optimized on the last month option in the strategy tester. BTC Miner was build for trading BTCUSD on 1 hour time frames. About the EA and strategy: It uses ADX and Envelopes to enter trades and uses Momentum and Moving Average crossovers for exits. There is a fixed lot size and all trades have a SL and TP. The EA does not use martingale or hedging as its strategy, it is based

The Weis Wave Chart for MT5 is a Price and Volume indicator. The Price and Volume reading was widely disseminated through Richard Demille Wyckoff based on the three laws created by him: Supply and Demand, Cause and Effect and Effort vs. Result. In 1900 R.Wyckoff already used the wave chart in his analyses. Many years later, around 1990, David Weis Automated R. Wyckoff's wave chart and today we bring you the evolution of David Weis' wave chart. It shows the amount of Volume and the amount of pips

The Weis Wave Chart Forex for MT5 is a Price and Volume indicator. The Price and Volume reading was widely disseminated through Richard Demille Wyckoff based on the three laws created by him: Supply and Demand, Cause and Effect and Effort vs. Result. In 1900 R.Wyckoff already used the wave chart in his analyses. Many years later, around 1990, David Weis Automated R. Wyckoff's wave chart and today we bring you the evolution of David Weis' wave chart. It shows the amount of Volume and the amount o
This product generates signals at closing bars thanks to channel scaling. It visualizes these signals with an arrow. The color of the arrow indicates the direction of the trade. The default settings are valid for the H1 period. You can backtest for each period and product. The code content of the indicator has been applied in accordance with price movements as much as possible. For this reason, it detects trend beginnings and ends well.
Parameter descriptions:
PER: Indicates the number of bar

Archi基于指标,其数量将在未来增加。 可以将"追踪止损"与"追踪位置"和"步进追踪"一起使用。 通过乘法和加法,可以增加后续交易的交易量,使当前交易亏损。 在达到积极交易超过无利可图交易的优势后,交易量恢复到原来的交易量。
Archi BasicSettings禄忙猫潞镁鹿芦掳鹿戮掳:
魔术数字是所有未平仓交易的唯一数字。 注意!!! 顾问使用历史记录,因此您需要使用与以前不同的唯一数字
成交量–开启交易的初始成交量
用所选系数增加地段的标志–增加成交量的标志
音量增加比率-音量增加的值
滑点-开盘交易时的价格滑点
获利-以点数为单位的期望利润
止损-当达到点数损失时关闭交易
尾随激活器-尾随操作的激活
Trailing Stop(追踪止损)-从当前价格到转移止损的未平仓交易的距离,以点为单位
Trailing Position-从当前价格到止损转移到的未平仓交易的距离,以点为单位
Step Trailing-以点为单位的价格之后的止损运动的步骤
要在选定的工具上工作,建议为此工具进行优化。

其中一个数字序列称为“森林火灾序列”。它被公认为最美丽的新序列之一。它的主要特点是该序列避免了线性趋势,即使是最短的趋势。正是这一属性构成了该指标的基础。 在分析金融时间序列时,该指标试图拒绝所有可能的趋势选项。只有当他失败时,他才会认识到趋势的存在并给出适当的信号。这种方法可以让人们正确地确定新趋势开始的时刻。然而,误报也是可能的。为了减少它们的数量,该指标添加了一个额外的过滤器。当新柱打开时会生成信号。在任何情况下都不会发生重绘。 指标参数: Applied Price - 应用价格常数; Period Main - 指标的主要周期,其有效值在 5 - 60 之间; Period Additional - 附加周期,此参数的有效值为 5 - 40; Signal Filter - 附加信号滤波器,有效值 0 - 99; Alerts - 启用后,指示器会在出现新信号时提醒您; Send Mail - 允许指标向电子邮件发送消息; Push - 允许您发送 Push 消息。
A basic tool for traders to trade percentile of the value. It indicates both values in the for of digits appeared on the left corner of the screen.
Instructions Manual : First choose your desired symbol and then select this tool. Please be remined that this tool is just a helping tool. its upon trader what he desired so. The function of this tool is just to provide a help in trading.
UR時刻
UR Momenter 完美地計算了與以震盪指標表示的價格走勢耗盡相關的價格動量。 因此,這為我們提供了潛在逆轉或回撤的真正早期信號。 這個公式是在 2018 年市場泡沫破裂後發現的。
使用 UR Momenter 的優勢:
無參數 您有 2 條線描述價格走勢 - 白線是與價格移動平均偏差相關的價格動量,表示為振盪器(藍線) 直方圖是價格動量背景下最大偏差的可視化 該界面展示了兩個極端(上部紅色區域和下部綠色區域)的任一條線的耗盡 最大優勢:簡單且可適應所有資產。 有一個特殊的電報聊天,您可以在其中了解最新的工具更新,如果您覺得缺少什麼,也可以發送請求!
為什麼選擇 UR Momenter?
該指標可用作獨立的進入或退出指標。 由於它對價格的依賴 - 它可以應用於每個圖表,其偏差計算算法基於多年的經驗和觀察。
如何使用 UR Momenter?
請參閱下面的描述以更熟悉它:
設置 沒有任何 展示
價格平均主線(白色):價格的動量 價格震盪指標(藍色):價格與其移動平均線的偏差。 直方圖:顯示動量的偏差。 極端區域:價格將耗盡並可能反轉的區域。

Best helping tool for Professional and Experienced traders. A best Tool To find the trend. Instruction Manual: First Select your desired Symbol. Then attach this tool and wait till it identify the trend for you. Then it will be more feasible to trade.
Once again best tool to trade. Demo version is available you can fully test its functionality. More importantly there are always trend breaks Once Trend break is observed un-attach this tool and then re-attach to get the fresh trend. Precautions:

A value indicator for experienced and professional traders. It is helping tool to indicate the direction value gain. A best helping tool to trade value. This indicator is equipped with a colored line and a digital tool to indicate value numerically .
This indicator also helps to indicate value during trends. A study based on this indicator shows value of trade significantly changes during trends best tool to cash the trends.
A technical Indicator Providing Price Convergence Signals along with value for experienced and professional traders. Easy to comprehend, Easy to understand.
This is a helping tool provides best signals. This indicator is designed based on the fundamentals of trade. A very good indicator you can customized its color. A best tool to find trade direction.
An adaptive indicator. It constantly adapts to the trade.

Drawdown Limit EA Prop Firm trading MT5
If you found this EA, it's probably because you want to get a funded account with a prop firm, but you see a rule that most of traders fear : Maximum Daily Drawdown. I've been through this problem myself as I'm a prop firm trader and I've made a bot to solve this rule, and you can get it to solve this problem too.
How does it work ?
When you first setup this EA, you need to input the initial deposit which corresponds to the size of your funded account.

LAZY TRADER MT5
Lazy Trader was designed to do all of the complex trading for you, so you can you relax on your couch, or sleep the night away. There is no reason to learn how to trade Forex when using Lazy Trader.
YOU DO NEED TO UNDERSTAND RISK AND MONEY MANAGEMENT HOWEVER...... Ok to Be Lazy and Smart, but PLEASE not Lazy and Stupid. READ THE RISK WARNING BELOW.
It's time for you to put your feet up and allow your trading bot do all the complicated work for you. After all, you deserve

Hello;
This indicator provides input and output signals of real volume levels with some mathematical calculations. It is simple and safe to use. As a result of the intersection of real volume levels with averages, it creates buy and count signals.
Indicator parameter descriptions:
A-PERIOD: Indicates the number of bars to be calculated.
B-GAMMA: A fixed Fibonacci trend average of 0.618 is used.
Use C-VOLUME TYPE:Tick volume as a constant.
D-HIGH LEVEL 2: Represents the level of the second
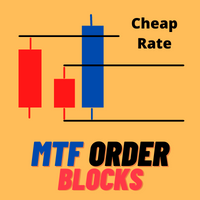
Very precise patterns to detect High Accurate Order Blocks: It Draw zone after market Structure Breakout with a high Accuracy, institutional orders with the potential to change the price’s direction and keep moving towards it, have been placed. Features Auto Order Blocks Draw MTF Order Blocks Double Signal One Alert Signal Second Long Wick Rejection Signal Market Structure BOS LINE How to show MTF order Block Go on indicator setting at the end of scroll you see OTF Setting change Timeframe

В основе индикатора EasyBands лежит тот же принцип, что и при построении Bollinger Band. Однако, данная модификация индикатора использует вместо стандартного отклонения средний торговый диапазон (Average True Range). Соответственно, с данныи индикатором абсолютно аналогично можно использовать все стратегии, которые применяются с Bollinger Band. В данной версии индикатора используется двенадцать уровней и средняя линия (белый цвет). Индикация тренда выполнена в виде окраски свечей в зависимости

TRACKINGLEVELS (SUPPORTS AND RESISTANCES)
TrackingLevels is a useful indicator that saves considerable time when a trader starts analyzing a chart. This indicator draw on the chart all the resistances and supports that the market is creating. The resistance and support levels are very important, this levels define areas where there can be a considerable accumulation of sell or buy orders. These are a key areas that every trader must know and keep in mind all the time. This indicator helps the t

GM Bounty Hunter MT5 is a fully automated/semi-automatic, The robot trades according to the overbought and oversold levels of the market. The EA's unique trading strategy has a high probability of winning. GM Bounty Hunter MT5 is optimized for use with low spread currency pairs. Info:
Working symbol XAUUSD, EURUSD, GBPUSD, USDJPY,.... Working Timeframe: M1, .....(The larger the timeframe, the more stable the signal) Min deposit $125 with Stop Loss settings (or equivalent in cents ) The minimum
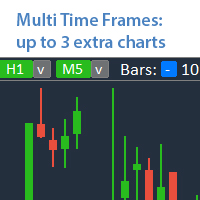
分析最多3个其他时间框架的额外图表 ,不切换主图表。 多功能工具 : 66+ 功能,包括此工具 | 如有任何问题,请联系我 | MT4 版本 该指标在 单独窗口 中打开: 窗口 可以移动 到图表上的任意位置(使用 [<M>] 按钮)。 窗口也可以最小化以节省空间 ( [ <^>] 按钮) 在出现的窗口中,您可以配置: 第一张图表 的周期(左边);
第二张图表 的周期(中间); 第三张图表 的周期(右边);
(每个时间框架都可以禁用);
每个时间框架的 柱数 。
最大柱数:
a) 3个活跃图表:30;
b) 2个活跃图表:45;
c) 1个活跃图表:90; 多功能工具 : 66+ 功能,包括此工具 | 如有任何问题,请联系我 | MT4 版本 多功能工具 : 66+ 功能,包括此工具 | 如有任何问题,请联系我 | MT4 版本
Hello friends. I wrote this utility specifically for use in my profile with a large number of Expert Advisors and sets ("Joint_profiles_from_grid_sets" https://www.mql5.com/en/blogs/post/747929 ). Now, in order to limit losses on the account, there is no need to change the "Close_positions_at_percentage_of_loss" parameter on each chart. Just open one additional chart, attach this utility and set the desired percentage for closing all trades on the account. The utility has the following fu
This indicator scans the 1-3 Trendline pattern . The indicator is a 100 % non repaint low risk breakout system . The patterns are formed around swing high and swing lows which make them a low risk pattern with high reward.
PATTERN BACKGROUND The 1-3 Trendline Breakout pattern is formed by four(4) points which are composed of three (3) primary points and the pattern neck. A trendline is always formed by the point 1 and the neck of the pattern . When price breaks out of the trendline formed , it
Automatic Expert Advisor. Night scalp system, with trend detection and pullback entry. Dynamic exit signal, for SL or TP. Every trade has fix SL. No usage of risky strategies like martingale, hedge, grid etc.
About EA Scalper strategy Technical strategy Can use with small deposits Pairs with best rezults: AUDNZD, AUDCAD, AUDCHF, EURAUD, GBPAUD, USDCHF, CADCHF, EURNZD, EURGBP, GBPCAD, GBPCHF, EURCHF Time Frame: M15 Recommendations Broker account with ECN and low spread Test it first to find out
** All Symbols x All Timeframes scan just by pressing scanner button ** ***Contact me to send you instruction and add you in "RSI scanner group" for sharing or seeing experiences with other users. + FREE Trading Utility MT5
Introduction RSI divergence is a main technique used to determine trend reversing when it’s time to sell or buy because prices are likely to drop or pick in the charts. The RSI Divergence indicator can help you locate the top and bottom of the market. This indicator finds

Trade any currency, crypto, cfd or stock in any timeframe depending on 2 moving averages , from scalping to position trading. All parameters and functions can be modified and de/activated in the settings, there's no hidden algorithm. The Universal Moving Average Expert Advisor ( UniMA EA ) trades a simple strategy that works well with dozens of profitable settings.
All backtest results shown in the screenshots below and tradet in the signals can be tested with the provided set files in the com
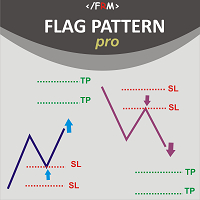
Flag Pattern pro is a Price Action (PA) analytical tool that scans the continuation patterns known as "Flag and Pennant Patterns" .
Flag and Pennant patterns are continuation patterns characterized by a move in a previous trend direction after a shallow retracement usually below 50% of the original move . Deep retracements can however be sometimes found at the 61.8 % levels. The original move is know as the flag pole and the retracement is called the flag.
Indicator Fundam

Description :
A utility to create and save screenshots automatically and send to a chat/group/channel on telegram.
The saved/sent image file will include all objects that exist on the chart and also all indicators are displayed on the chart.
Features: Save screenshot of chart including all objects, indicators, ... Send screenshots to a telegram chat/group/channel
Wide range options to select when create screenshots
Logo and text adding feature
Inputs and How to setup the EA :
Various option

The Scalp Master tool not only provides proper trade management but also helps a trader to build a proper psychology and discipline to gain consistent results in his trading. It offers Max loss Limiter ( Risk per position ) and RPT limiter (Risk per trade), Auto calculates Lot size, CLOSE multiple trades with single click. Buy, Sell, Close with default Trend line and Horizontal line , Pips measuring tool, risk reward measuring tool and many other features. This tool offers to place quick

This EA is suitable for trading on the pair and else several. The EA itself uses universal strategies, but so far they are optimized for some currency pairs. Many settings can be adjusted. There are two panels on the chart, for visualization and settings. He displays his decision on the graph in the form of arrows. There are only two types of arrows. It does not use martingale. It works fine in the tester by default in the settings. It is already configured by default. You can also specify the

一个简单的专家顾问交易欧元/美元货币对,而不仅仅是
精简版的 BUX SOLO
由 BUX EA 引擎提供动力
选择。VAR:S1 (OPT.VER: S1)
信号生成的最佳指标集 有信号/无信号、挂单的开仓/平仓交易 鞅模式 虚拟追踪止损(对经纪商不可见)
使用策略测试器测试和优化您的交易策略
所有必要的信息都在常见问题解答中。 https://docs.google.com/document/d/1mIEhAeDSlmc5OtgwMSnlw7HSDK0Yvjk_1H36rMX7QZU/edit?usp=sharing
由 BUX EA 引擎提供动力 https://www.mql5.com/en/market/product/82887

一个简单的专家顾问交易欧元/美元货币对,而不仅仅是
由 BUX EA 引擎提供动力 https://www.mql5.com/en/market/product/82887
选择。VAR:S1 (OPT.VER: S1)
信号生成的最佳指标集 有信号/无信号、挂单的开仓/平仓交易 鞅模式(包括动态鞅) 虚拟追踪止损(对经纪商不可见)
使用策略测试器测试和优化您的交易策略
所有必要的信息都在常见问题解答中。 https://docs.google.com/document/d/1mIEhAeDSlmc5OtgwMSnlw7HSDK0Yvjk_1H36rMX7QZU/edit?usp=sharing
由 BUX EA 引擎提供动力 https://www.mql5.com/en/market/product/82887

M & W Pattern Pro is an advanced scanner for M and W patters , it uses extra filters to ensure scanned patterns are profitable.
The indicator can be used with all symbols and time frames.
The indicator is a non repaint indicator with accurate statistics calculations.
To use , simply scan the most profitable pair using the statistics dashboard accuracy , then enter trades on signal arrow and exit at the TP and SL levels.
STATISTICS : Accuracy 1 : This is the percentage of the times price hits TP
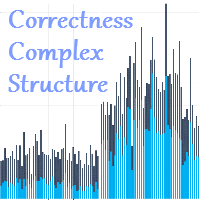
The Correctness Complex Structure indicator displays the complex structure of the bar, taking into account tick volumes in digital terms. How to interpret the information provided by the indicator. It's very simple, it's enough to analyze the chart. We will explain the work using an example, take the EURUSD instrument on the D1 timeframe, install this indicator and analyze the information provided by the indicator. The indicator works in the bottom of the chart and gives the result in the form

Of all the tasks that a trader faces when entering a market, the main task is to determine the direction of the trend. The Artificial Power indicator will help you with this task. Whatever goal the trader sets for himself, the tool to achieve it will be mainly trend indicators.
The Artificial Power indicator without delay and redrawing is used by traders in trend strategies in trading on financial markets (Forex, CFD, binary options). This indicator is designed to detect trends in price moveme
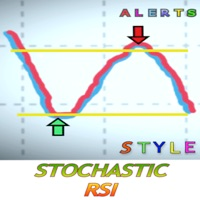
什么是随机RSI?
随机RSI(StochRSI)是技术分析中使用的一个指标,其范围在0和1之间(或在某些图表平台上为0和100),是通过将随机振荡器公式应用于一组相对强度指数(RSI)值而不是标准价格数据来创建的。这个版本包括提醒,不要错过真正的好机会。当你想接收买入信号或卖出信号时,你可以设置参数。为了接收任何信号,你必须通过MetaQuotes ID连接你的桌面版和Metatrader应用程序。MetaQuotes ID在你的MT4/5应用程序的设置>>聊天和信息中找到。在桌面上是在工具>>选项>>通知。你把ID放在桌面版上,激活通知,就可以开始了。
试试MT4版本, 这里
因为风格很重要
我知道每次都要点击属性来改变蜡烛的颜色、背景是浅色还是深色,以及放置或删除网格是多么令人厌烦。这里有一个一键式的解决方案。 三个可定制的按钮可以选择交易者想要的蜡烛样式。 一个按钮可以在白天和夜晚模式之间切换。 一个按钮可以在图表上显示或隐藏网格。 ***** 在设置中,你可以选择按钮在屏幕上的显示位置*****。
另外,请考虑查看我的其他产品 https://www.mql5

MartexMT5 is a moderately aggressive EA working on a martingale strategy with hedge. The EA independently monitors the risk and, if the risk is high, takes measures to exit the market with a minimum profit. In the hedging mode, the EA independently leaves the "lock" with a profit. A complete guide to the MartexMT5 EA can be found in the "Comments" section. Benefits automatic magic number, individual for each currency pair; automatic breakeven and automatic trailing stop; at high risk, reducing t
CalcFlat Creative is a flat indicator.
This is a more advanced version of the CalcFlat indicator. Three lines have been added for this indicator, which significantly improve the performance of the predecessor indicator. In addition to the two existing levels that the user reacted to and which were static, now the indicator has three dynamic lines on top of the main chart and interpreted as: signal line base, signal minimum, signal maximum.
These lines are formed due to the additional indicato

Multicurrency Expert Advisor works on the basis of determining several candlestick patterns, which should simultaneously form on several trading instruments.
Please test the Expert Advisor with 100% quality of quotes!
Built-in hedging system allows you to increase the stability of the work, reduces the drawdown and greatly increases the probability of reaching the take profit, specified in the settings of the expert. Version for MT4: https://www.mql5.com/en/market/product/84876
Check that

Gann 9+ 指标简介 江恩矩阵图( Gann Squares ),又称江恩四方图,或甘氏矩阵,它是江恩理论中最简易明确的技术分析,也是江恩一直致力使用的推算工具,堪称是江恩一生的精华和精髓。Gann 9+指标是使用矩阵图找出股票或期货的未来高点或低点。
指标输入 1 基数和步数可以默认设置为1; 2 倍数为-1时自动获得倍数,当然也可以自行填写;(价格除以倍数就是起算值) 3 多与空表示从起算点往上或往下算目标价; 4 表示要不要显示基准线; 5 价格除以倍数是起算值,是否对起算值进行四舍五入; 6 表示要展示多少个目标价。
交易方法建议: 1、画出来的线会有明显的支撑和压力,甚至是反转;突破后加仓,到达后减仓; 2、配合其它头皮和振荡指标,成功率大大增加; 3、尽量当主/辅助指标使用,但不能只看一个指标。
特别说明:此指标针对对江恩理论有一定了解的人使用。

NeodymiumX is an expert advisor specialized to trade indices NASDAQ/ NDX100/ US100/ NAS100. It uses no dangerous strategy (matingale, grid, etc) and gives a safe and steady growth of an account. Unlike some commons NAS100 EA that only use buy order/position, NeodymiumX use buy or sell position according to the market trend. So it can make profit on both directions and still profitable even when US100 price drop (like at the beginning of 2022 until around June 2022). NeodymiumX live performance

Mega Recuroid is a professional expert system developed for market analysis based on the Recuroid indicator. The Expert Advisor works with one order (not a series), each order is accompanied by a stop loss and a take profit. Thus, the expert system uses safe orders for its work. The indicator entry itself can also be considered reliable, since a reliable Recuroid indicator is used. The principle of entry and holding/maintaining a position on the market is clear, there is a signal, close the opp

STARGOGS PRICE ACTION EA ABOUT: This Robot is based on Price Action mostly Trendlines and Support & Restistance. The Robot Also uses 2 Strategies which you can choose from by choosing which one to use (True/False) Strategy 1: One Entry at a time with Fixed TP and SL. Strategy 2: Grid and Matingale. You can also use this EA as a Indicator by Turning Trading off also by using (True/False). You can aslo use Lot multiply on loss if you want or use fixed lotsize. MINIMUM BALANCE:
The Minimum Balanc

Hi all, Morning Shift is a plug and go system programmed to trade on the GBPUSD pair only. It executes trades at a specific time each day using a fixed risk reward ratio. The system trades only during the London session because of the high price movement in relatively a single direction in the named pair. Please read the instructions below and the video attached in the description for instructions. Thank you. Requirements Adjust the local time zone of your device to UTC+3 Must be used on GBPU

https://c.mql5.com/31/761/best-trend-indicator-logo-200x200-8493.png 该指标用一条红绿相见的实线来反映市场价格的万千变化。 绿线表明市场价格处于上 升期间 , 红线表明市场价格处于下跌期间。
实线颜色 的改变预示着市场已经发生变化行情极有可能会出现逆转! 建议您在日K线图上使用该指标。该指标不适合您做超短线交易! 众所周知,趋势线是技术分析家们用来绘制的某一证券 (股票) 或商品期货过去价格走势的线。目的是用来预测未来的价格变化。这条 趋势 线是通过联结某一特定时期内证券或商品期货上升或下跌的最高或最低价格点而形成的。它可以预测该证券或商品期货是处于上升的趋势还是处于下跌的趋势。但是,您一定要认识到每一个指标都有是有缺陷的,这个世界上没有任何一个指标可以精准的预测到市场未来的发展方向。因此,我建议您在使用这个指标的时候结合其他的技术分指标,以此获得更好 的 效果 。

VixAlgo is fully automated Expert Advisor for trading Volatility 75 Index offered by Deriv formerly known as Binary Dotcom. The EA will spot entries when the conditions are met. It is based on Candle Breakout on Support or Resistance level and also is incorporated with Envelopes price Break Strategy. The EA will automatically open trades and close on Take Profit. Lot size or can can be also changed depending on account balance you have. This is not just a bot which miss trade opportunity, it ma

This indicator is designed for those people, who want to trade and earn on any instruments and timeframes .The indicator gives out very good points to enter the market,it's very easy to trade,the arrows will show when to open trades,set and trade without thinking about anything,stop loss and take profit,set each one yourself,it all depends on your trading style,someone scalps and someone holds trades on a few days..In the strategy tester, the indicator simply cannot physically show accurate res
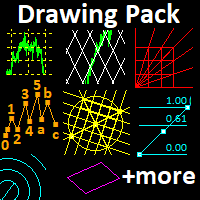
This indicator provides several drawing tools to assist in various methods of chart analysis.
The drawings will keep their proportions (according to their handle trendline) across different chart scales, update in real time, and multiple drawings are supported.
#
Drawing Option
Description
1 Grid box draggable boxed grid, user defines rows x colums, diagonal ray option 2 Grid partial or fullscreen grid, sized by handle line 3 Grid flex a diagonal grid, sized and sloped by handle line
4 Cyc

Lion King EA v13 – MetaTrader 5 高级神经网络增强型智能交易系统
Lion King EA 是一款功能强大且灵活的 MetaTrader 5 自动交易系统,专为 H1 时间框架下的 XAUUSD(黄金) 交易而优化。13 版本引入了一项重大升级:完全集成的 神经网络 ,将自适应智能融入到久经考验的算法核心中,为交易者提供前所未有的选择和控制力。 三种强大的交易模式 Lion King 提供 三种不同的操作模式 ,以适应不同的交易风格和偏好: 纯算法模式 (神经网络已禁用):EA 系统采用其久经考验的原始技术指标逻辑运行——基于布林带、移动平均线、CCI 指标和波动率分析,提供可靠的入场/出场信号。非常适合偏好稳定、基于规则的交易者,无需机器学习。 神经网络作为信号过滤器 (默认模式):核心算法信号的生成方式与之前相同,但所有潜在交易都会经过神经网络的最终验证。神经网络充当智能过滤器,仅当其置信度超过用户设定的阈值(默认为 0.2)时才允许交易。这显著提高了信号质量和对不断变化的市场环境的适应能力。 全神经网络决策器: 神经网络完全掌控交易决策。它分析市场状

The result is visible in the first hours of operation!
The bot opens a grid of orders with a minimum lot. And it fixes a small profit, but it does it very often. Thus, the profitable zones
are always close to the current price.The Expert Advisor has a trading panel. With it, you can open positions that will be picked up by the Expert Advisor and taken into account in trading. The built-in switchable filter ensures trading in the direction of the trend.
Use a $ 1,000 deposit
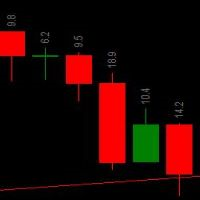
Introducing candlestick count trading. Let's make profit together When the candlestick reaches a trading size of 110 pips, there is always a reversal in the opposite direction. Therefore, we have brought technical techniques to write e-mail to make more profits. and can be used in all currency pairs
advice The minimum micro account capital is 10 dollars. and the standard is 100 dollars. Lot 0.1
Stable Trading - a stable bot for the whole history with one setting! Works on the basis of the Trading Direction indicator. Since the Trading Direction indicator generates stable signals for trading without redrawing exactly at the opening prices, the EA works as stably and reliably as possible. Everything that you read in the description of the indicator is also suitable for an expert. The expert goes through the whole story! The EA is designed for stable long-term trading, although it can be

--- ! Last 8 copies left free. Next there will be a price $30 ! --- DRAGON RALLY SNIPER EA (USD/JPY 5min) NO MARTINGALES NO CUMULATE ORDERS NO PARTIAL CLOSURES OR HEDGING NO CONFUSIONAL PARAMETERS, MULTI-CHARTS OR MULTI TIMEFRAME NOT OVER-FIT OR COMPLICATED AND RISKY STATEGIES THAT CRASH AFTER FEW DAYS DESCRIPTION: The idea behind this system is very simple: identifies break-outs in price levels and starts trade on the pull-backs . It works perfectly on the USD/JPY cross with a 5-minute tim

Robot for the DERIV broker. Trade synthetic indices. Crash 500 index, boom 500 index, Volatily 10, Volatily 10 (1s), volatily 100 and volatily 300 (1s) Scalping operations. It has a hidden profit and loss limiter. You can set it in your parameters. Recommended minimum balance to trade all indices is $1,000.
Follow our signal in real time: https://www.mql5.com/en/signals/1630173

Prime Algo Gold HFT Coded by Prime Capital Vietnam Best with XAUUSD - High frequency trading
Find your best setting with the backtest before trade with a real account please! With default setting: - Deposit: 10k - Lot trade from 0.01 - Max DD: ~5-10% - Profit: ~1%-3% per month with default setting
Note: - Best with spread max < 30 - Time frame: any - Important: Contact Us before buy ------ ------ ------ ------ ------ ------ ------ ------ ------ ------ ------ ------ -

Introduction to Chart Pattern MT Chart Pattern MT is a chart pattern scanner to detect the triangle pattern, falling wedge pattern, rising wedge pattern, channel pattern and so on. Chart Pattern MT uses highly sophisticated chart pattern detection algorithm. However, we have designed it in the easy to use with intuitive user interface. Chart Pattern MT will show all the patterns in your chart in the most efficient format for your trading. You do not have to do tedious manual pattern detection an
This EA trails your stops based on percentage of current TP, for both manually and auto-opened trades. You can edit the percentage value in the inputs. Trailing stop is a more flexible variation of a normal exit order. T railing stop is the practice of moving the stop-loss level closer to the current price when the price moves in your favor. Trailing the stop-loss allows traders to limit their losses and safeguard their positive trades. It is a very popular practice. This EA will manage you

Данный советник - это аналог TakeProfit и StopLoss, только невидимый брокеру и остальным участникам рынка. Удобная вещь для скальпирующих стратегий, использующих одинаковый StopLoss и TakeProfit - один раз установил размер предполагаемых убытка и прибыли и далее остается только при соответствующем сигнале открыть позицию, а советник закроет ее сам при достижении установленных уровней.
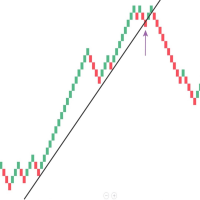
Mean Renko Bars are used for alternate price charting. Unlike the usual time framed chart – where every candle represents a fixed time interval – the goal of Renko chart is to display price movement in increments, called bricks. Best with the momentum strategies. Can make some Algo with this candel ---- ---- ---- ---- ---- ---- ---- ---- ---- ---- Support: primecapitalvn@ gmail. com
Divergence is one best ways to trade the financial market as it is a leading indicator of price action that detect high probability reversal and continuation setups. The AlgoKing Divergence Detector is an RSI and Stochastics Indicator with Divergence Detection. Features Hidden Divergence for trend continuation. Standard or Normal Divergence for trend reversal. Screen Alerts. MetaQuotes Notifications. Email Notifications. RSI Indicator built in. Stochastics Indicator built in. Types of Divergen

It is an Expert Advisor who uses the famous Dave Landry strategy, widely used to operate swing trades in various types of markets, Forex, B3, indices, stocks and cryptocurrencies.
The Dave Landry Setup is one of the most well-known setups that operate in favor of the trend, there is a preference for the larger H4, Daily, Weekly and Monthly timeframes, due to its high hit rate, but the TsuTrader Dave Landry robot allows complete customization of the strategy .
- TSUTrader Dave Landry is the on

Reward Multiplier is a semi-automatic trade manager based on pyramid trading that opens additional orders with the running profit of your trades to maximize return exponentially without increasing the risk. Unlike other similar EAs, this tool shows potential profit/loss and reward to risk ratio before even entering the first trade! Download Demo here (starting lot is fixed at 0.01) Contact me to get a 7 days trial version of the product with full functionality.
Guide + tips here MT4 version

Trading Direction is an indicator that will never go against a long trend, stable, accurate and without the slightest redrawing. The indicator goes through the whole story! You can find settings for any tool for which there is a free TDO utility .
Trade rules. When a signal appears (always at the bar opening price), we immediately close the opposite position, if it exists, despite the fact of a drawdown or profit. And we open a new position following the arrow in the right direction. And these

The Recuroid indicator shows very good entry points. Just look at the screenshots, then download the free version and look in the strategy tester and see for yourself.
The system is based on two key algorithms. The first algorithm (managed) creates a system of balanced transition from the buy zone to the sell zone and vice versa, draws arrows and lines, and forms entries. The second algorithm (managing) corrects the initial data for the first algorithm (managed) by measuring virtual windows, t

用户手册:智能交易系统“通用指标连接器”
本系统是一个高性能自动化桥接器,无需重新编程即可执行任何自定义指标(.ex5)的信号。该智能交易系统充当智能订单管理器,允许您将退出规则、资金风险管理和时间控制应用于原本仅用于视觉控制的策略。
1. 指标链接配置
要使智能交易系统正常工作,您必须正确“映射”外部指标:
指标名称:指标文件夹中的指标文件的确切名称。
信号类型:
K线内:信号出现后立即执行订单。
K线收盘后:等待K线收盘以确认信号,避免“重绘”。
买入/卖出缓冲区大小:指定指标生成箭头的通道数(0、1等)。
操作类型:筛选条件,仅允许买入、仅允许卖出或两者兼有。
添加到图表:启用后,指标将自动绘制在图表上。
2. 风险与资金管理(资金管理)
系统提供三种计算仓位大小的方法:
FIX_LOT:用户自定义的固定手数。
LOT_RISK_MONEY:根据止损位计算承担固定金额风险所需的手数。
LOT_RISK_PERCENT_BALANCE:承担总余额的百分比风险(例如,1%)。
SL/TP 点数:以点数表示的保护和目标价位。注意:使用 0 表示不设固定
您知道为什么MetaTrader市场是出售交易策略和技术指标的最佳场所吗?不需要广告或软件保护,没有支付的麻烦。一切都在MetaTrader市场提供。
