适用于MetaTrader 5的新EA交易和指标 - 170

The indicator displays divergence for any custom indicator. You only need to specify the indicator name; DeMarker is used by default. Additionally, you can opt for smoothing of values of the selected indicator and set levels whose crossing will trigger an alert. The custom indicator must be compiled (a file with ex5 extension) and located under MQL5/Indicators of the client terminal or in one of the subdirectories. It uses zero bar of the selected indicator with default parameters.
Input param
FREE

FourAverage: A Breakthrough in Trend Identification With evolving information technology and increasing number of market participants, financial markets get less and less analyzable using good old indicators. Common technical analysis tools, such as Moving Average or Stochastic alone, are not capable of identifying the trend direction or reversal. Can a single indicator show the right direction of the future price, without changing its parameters over 14 years' history, while at the same time re

The indicator creates 2 dot lines representing an upper and lower bands and the main indicator aqua line as the price power. If the main line is swimming inside the bands, then you should wait and watch before entering the market. When the main line jumps out or in the bands, then you should make a long or a short position.
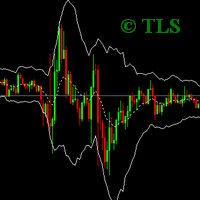
“Keltner 通道”指标的扩展版本。这是一种分析工具,可让您确定价格头寸相对于其波动率的比率。 您可以使用 26 种移动平均线和 11 种价格选项来计算指标的中线。当价格触及通道的上边界或下边界时,可配置的警报将通知您。 可用平均线类型:简单移动平均线、指数移动平均线、Wilder 指数移动平均线、线性加权移动平均线、正弦加权移动平均线、三角移动平均线、最小二乘移动平均线(或 EPMA、线性回归线)、平滑移动平均线、赫尔移动平均线Alan Hull 的平均值,零滞后指数移动平均线,Patrick Mulloy 的双指数移动平均线,T. Tillson 的 T3,J.Ehlers 的瞬时趋势线,移动中值,几何平均值,Chris Satchwell 的正则化 EMA,线性回归斜率的积分, LSMA 和 ILRS 的组合,J.Ehlers 概括的三角移动平均线,Mark Jurik 的成交量加权移动平均线,平滑。 计算价格选项:收盘价、开盘价、最高价、最低价、中间价=(最高价+最低价)/2、典型价格=(最高价+最低价+收盘价)/3、加权收盘价=(最高价+最低价+收盘价*2)/4 , He

The indicator draws lines that can serve as support/resistance levels. They work both on Forex and FORTS. The main and additional levels are displayed as lines, with the color and style defined by the user. Additional levels are only displayed for currency pairs without JPY. Please see the AUDUSD chart below. Yellow ovals indicate some characteristic points where price reaches one of the levels. The second screenshot shows a FORTS instrument chart with the characteristic points. Simply watch the

Smart Trend Line Alert , available for MT5 is a unique professional Trend Line, Support Line and Resistance Line Touch and Break out Alert with awesome Alert History feature, designed to help traders easily manage many charts and symbols without staring at the monitor.
Features Candle Break Out Alert, Price Touch Alert and Time Line Alert; 1 click for converting any drawn line into an alert line (Trend line and Horizontal line or Trend Line By Angle); Alerts History able to re-open closed char

RBC 范围柱线图表 是一款经典范围柱线指标。本指标的功能是提供价格区间图表: 最高价/最低价区间是一个经典的用于分析的选项。它也有开盘价, 最高价, 最低价和收盘价。在第一个选项里, ;两个价格数值同时被分析, 而其它选项只使用一个。以往,范围柱线使用即时报价绘制,但由于即时报价数据未在服务器上提供,图表只可能基于标准时间帧的柱线数据。您应该记住,时间帧越大,图表越粗糙。本指标实现通过标准时间帧选择。 在首次运行时, 您应该按下 R 键 或等待在设置里指定的 'Update period chart'。这将初始化图表。如果指标给出拷贝错误,这意味着正在从服务器拷贝数据的过程中,这可能需要一些时间,您可稍后重试。 注: 如果您选择了一个十分大的时间段来进行分析 (早于开始日期), 则图表需要很长时间, 因为事实上指标在开始阶段要从服务器上拷贝大量数据; 当在策略测试员里进行测试时, 分析的开始数据应早于开始时间一周或一个月 (依赖指定的步长)。 指标设置 Magic number - 独有指标数字,如果同时运行多个指标此数字很有必要 (每个指标必须有自己的魔幻数字); Period o

The indicator shows the angle of the DeMarker indicator line, which allows you to identify possible price extrema more accurately. Histogram bar color and size indicate the direction and angle of the DeMarker line. When the trade volume control is enabled, a yellow bar is an indication of the volume being lower than average over the past 50 bars. The color of the main indicator line shows whether the price has reached an overbought/oversold level in accordance with DeMarker indicator values. The

The indicator is designed for visual multicurrency analysis. It allows synchronous scrolling and analysis of a few charts simultaneously. The product can also be used for pairs trading. The indicator works both on Forex and Russian FORTS market. The product has a very important property - if there are skipped bars at the symbols, the synchronism of charts on the time axis is fully preserved . Each chart point is strictly synchronous with the others on the time axis at any time frame. This is esp

On the current chart, this indicator displays candlestick highs and lows of another time frame. Input Parameters: TimeFrame - chart time frame whose data will be displayed on the current price chart (by default, H12). Time Zone - shift of the indicator by time zone relative to the broker's time (by default, Broker-1). If the broker's time zone is UTC+1 and the Time Zone parameter is set to Broker-1, the bends of the indicator will be plotted in multiples of Greenwich Time. Indicator buffer value
该指标扩展了标准分形的功能,允许您查找、显示和使用它们,计算任何奇数长度,即 3、5、7、9 等柱线。分形不仅可以通过柱线价格来计算,还可以通过给定时期的移动平均线的值来计算。 所有类型的警报都在指标中分别针对上分形和下分形实施。 设置使用条的数量,在settings中设置Left fractal bars count变量(默认值为2),其中的number设置一侧不包括中央条的条数,即等于到 2 表示 5 个条形的标准分形(2 个条形 * 2 个边 + 1 个中心 = 5 个用于查找和确定分形的条形)。 参数: Period price MA - 用于计算分形价格的移动平均线的周期(值 1 - 对应于没有平均的分形的通常计算) Method price MA - 计算分形价格的移动平均法 Price High - 价格寻找高点 Price Low - 寻找低点的价格 Left fractal bars count - 一侧分形中的条数,不包括顶部,即对于 5 个条的标准分形,值为 2 Arrow shift from extremum - 从分形极值的点偏移以突出显

The Fibonacci series. This number sequence is formed as each subsequent number is a sum of the previous two. it turns out that it refers to its neighbors in the ratio 0.618 and 1.618 The most commonly used method for measuring and forecasting the length of the price movement is along the last wave, which ended in the opposite direction
The Fibonacci Waves indicator could be used by traders to determine areas where they will wish to take profits in the next leg of an Up or Down trend.

Exp-TickSniper - 具有自动为每个货币对自动选择参数的高速蜱黄牛。
您是否梦想有一位顾问会自动计算交易参数?自动优化和调整? MetaTrader 4 系统的完整版: TickSniper 黄牛 为MetaTrader 4 TickSniper - 完整说明 + 演示 + PDF
EA 是根据近 10 年的 EA 编程经验开发的。 EA 策略适用于任何符号。 时间范围无关紧要。 机器人基于当前报价、分时到达速度、点差大小和其他合约规范参数。 系统自动定义有利的止损和获利水平,以及平均持仓距离、追踪止损距离等。 EA 应用针对趋势的额外开仓系统(“平均”)。 它的设置已经过优化,可以在我们的真实账户上进行测试。 Expert Advisor 可以处理任何货币对。 交易系统的所有参数都是自动计算的,并取决于货币对的当前点差。 推荐交易账户: 建议存款 LOW RISK 1,000 美元,最低手数为 0.01 3 个货币对(例如,EURUSD USDCHF USDJPY); 建议存款 300 美元的中等 风险,1 个货币对(例如 EURUSD

Optimistic trader may enter the market when the price crosses the Aqua line. More reliable entry will be when the price crosses the Blue line. When the price comes back and crosses the Red line you can open a position in the course of price movements.

This indicator is based on the classical Alligator indicator which is a trend trading indicator. Stay in the trade as long as the candlesticks ride above or below the Alligator. When the lines converge or cross, it is time to consider entering or exiting
The proposed indicator has the ability to increase a smooth-effect in Alligator Indicator. This indicator could play an important role in determining support and resistance.
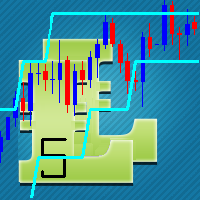
This indicator is based on the classical Envelopes indicator. The proposed indicator has the ability to increase a smooth-effect in the Envelopes Indicator. This indicator could play an important role in determining support and resistance. nPeriod input parameter determines the number of Bars for Moving Above Envelopes calculation.

This indicator evaluates the market sentiment using raw price action measurements, and it is an amazing trading confirmation. It can be used to take a trend-trade approach or a contrarian approach using reversal patterns. [ Installation Guide | Update Guide | Troubleshooting | FAQ | All Products ] Find early reversals Confirm short-term trades Detect indecision on the market Take contrarian trades near support and resistance levels Trade inside bars confirmed by overall direction of the market T
FREE

它预测最有可能的短线价格走势,基于先进的数学计算。
功能 评估即时价格走势; 计算实时市场趋势; 计算最重要的支撑和阻力位; 算法优化,在进行复杂数学计算时系统资源消耗最小。 最佳性能自调整, 所以它可以工作于任何品种 (无论它有多奇葩) 以及任意时间帧; 与所有 MetaTrader 平台兼容, 不管报价位数或其它参数; 与所有其它工具兼容 (指标, EA 或脚本),不会减缓终端性能和交易操作。 注: 为了获取多个时间帧的数值, 密集区域和附加的功能,您必须适用 专业版 或 大师版 。
介绍 构建一般交易策略的许多经典指标都基于简单的数学,不是因为创建这些指标时,没有优秀的数学家 (事实上,那时的数学家有可能比现在更好),但因为电脑还不存在,或是它们太简单,持续处理复杂数学操作的能力低下。如今,任何智能手机都完胜几十年前最强大的计算机。所以,处理海量信息的能力如今不再是限制,除了极其复杂的模拟处理。 高级价格走势预测者 (APMP) 指标利用当前处理能力的优势,通过一些最先进的数学、统计和概率的概念,来捕获价格波动的本质。 APMP 不能用来预测它自己,由于价格运动是一种非平
FREE

A moving average is commonly used with time series data to smooth out short-term fluctuations and determine longer-term trends. The proposed indicator has an ability to increasing a smooth-effect. This indicator could play an important role in determining support and resistance. An input parameter nPeriod determines number of Bars for Moving AboveAverage calculation.

Attention: You can view the program operation in the free version YuClusters DEMO . YuClusters is a professional market analysis system. The trader has unique opportunities to analyze the flow of orders, trade volumes, price movements using various charts, profiles, indicators, and graphical objects. YuClusters operates on data based on Time&Sales or ticks information, depending on what is available in the quotes of a financial instrument. YuClusters allows you to build graphs by combining da

本指标会读取两个指标: 多头能量和空头能量。它清晰地表明买卖双方力量平衡。入场交易的信号是穿越零轴线和/或背离线。当启用交易量过滤, 黄色直方图柱线现实低交易量 (低于之前的 50 根柱线的均值)。 输入参数: Period - 计算周期, 13 为省缺; CalculatedBar - 显示背离的柱线数量, 300 为省缺; Filter by volume - 交易量过滤, false 为省缺。如果已启用,则背离信号不出现,并且在交易量小于前 50 根柱线均值的情况下,直方图柱线被着色为黄色。三种模式可用: False, True, Auto。在 Auto 模式, 过滤器自动在 M30 和更低的时间帧里启用; 并且在高于 M30 的时间帧里它被禁用; Display divergence alert - 启用背离通知, true 为省缺; Display cross zero alert - 启用零轴穿越通知, true 为省缺; Draw indicator trend lines - 启用背离期间显示指标的趋势线, true 为省缺; Draw price trend line
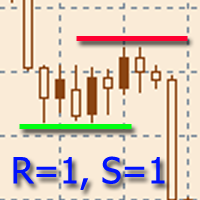
該指標旨在建立水平支撐和阻力水平。
水平搜索算法基於對極值的分組。
可以顯示每個級別的統計信息,通過多個屬性過濾級別的顯示,根據級別的類型(支撐或阻力)調整配色方案。 特點: 指示器已準備好工作,在大多數情況下不需要特殊設置 手動或自動選擇極值範圍以構建關卡 選擇要顯示的最近級別數以防止圖形混亂 靈活的圖形設置(顏色、線條和箭頭樣式) 要微調指標,您可以啟用輔助圖形元素的顯示,例如極值、極值分組區域等。 通過多個參數過濾級別的顯示 能夠在價格超過水平時啟用警報,具有可調節的滯後性 一鍵顯示關卡詳情(會顯示關卡事件) 能夠靈活自定義關卡屬性的顯示 可在一張圖表上運行多個指標(需要額外配置) 热键可用于轻松控制指示器。 可以为可用的那些功能分配大量的键选择。 在購買產品之前,您可以在這裡提出任何問題: https://www.mql5.com/zh/messages/01F78744B8BBD801

This is an indicator for Quasimodo or Over and Under pattern. It automatically finds the swing points and can even place virtual trades with stop loss and take profit. Press the "Optimize" button to automatically find the most effective settings. The pattern consists of four legs A,B,C,D as shown in the pictures. Open and close prices of the virtual trades are Bid price but the statistics in Display Panel take current spread into account. Its parameters are explained below. Buffer - Pips dista
FREE

Trading Sessions Pro is a trading session indicator with extended settings + the ability to install and display the custom period.
Main Advantages: The indicator allows you to conveniently manage display of trading sessions on the chart. There is no need to enter the settings each time. Just click the necessary trading session in the lower window and it is highlighted by the rectangle on the chart! The indicator has two modes of defining the trading terminal's time offset relative to UTC (GMT)
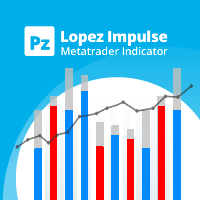
该指标同时评估波动率和价格方向性,从而发现以下事件。 [ 安装指南 | 更新指南 | 故障排除 | 常见问题 | 所有产品 ] 决定性和突然的价格变动 大锤子/流星图案 大多数市场参与者都支持强劲的突破 犹豫不决但动荡的市场形势 这是一个非常易于使用的指标... 蓝色直方图代表看涨的冲动 红色直方图代表看跌冲动 灰色直方图表示当前的波动率 移动平均线是平均波动率 该指标实施各种警报 指示器不重涂或重涂 ...具有直接的交易含义。 当看涨冲动超过平均波动率时,您可以购买 当看跌冲动超过平均波动率时,您可以卖出 该指标跟踪市场波动以及每个单个柱的看涨和看跌冲动。如果看涨的冲动超过平均波动率,那可能是做多空头的好机会。这些强劲的价格走势是可靠的,因为其他市场参与者可能会补仓。如果使用得当,此指示器功能非常强大。
作者 ArturoLópezPérez,私人投资者和投机者,软件工程师和Point Zero Trading Solutions的创始人。

免费版网格策略!与相同策略的完整版相比,唯一的限制就是仓位数量。 它的目标是在趋势行情中收获最大利润 (自动模式),并在趋势中调整。有经验的交易者也可以在手工交易时使用它。许多拥有 500 多名付费订阅者的成功交易者正在使用这类系统。 结合您的交易经验与自动策略!它包含适用于 GBPJPY 的网格,也可以轻松扩展到其它货币。 您也可以从头开始构建自己的网格! 策略也支持止损选项。您可以使用基于净值的止损,设置净值百分比来保护每笔交易。 针对 GBPJPY 进行测试 06.2012 - 11.2013 任意时间帧 (每次即时报价)。 其它对: CHFJPY, EURJPY, CADJPY, USDJPY。 也可在任意货币对的趋势行情中测试 (例如, GBPUSD 06.2013-11.2013) 或振荡行情。针对 GBPUSD 最好使用紧凑的网格,并且,若非振荡模式,应跟随日线趋势。在振荡模式中,围绕 8-16 均线附近振荡。 该 EA 十分容易配置。给我发送私信,获得更多详情,或观看 MetaTrader 4 版本的视频教学。 所有选项均有很长的描述,并给出某些选项能够完成什么的例子。
FREE
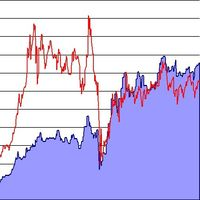
脚本分析设定时间段内的市场观察中的所有交易品种。 结果显示在“专家”选项卡和指定文件中。 为了便于查看和编辑,结果显示在csv文件中。 皮尔逊公式用于计算。 一对相关系数值接近 1 意味着这些对移动几乎相同。 接近 -1 的值意味着对以相同的方式移动。 这个工具对于那些由于其他货币对的变动而使用对冲的人来说非常有用。 参数: glubanal - 酒吧中的分析深度 InpFileName - 输出文件名 InpDirectoryName - 输出目录 precision - 提高精度(使用OHLC而不是O),增加了计算的精度,但在计算过程中加载更多的处理器和网络 spreadmax - 计算最大传播最大传播最大传播最大传播最大传播最大传播最大传播最大传播最大传播最大传播最大传播最大传播最大传播最大传播最大传播 ValuesSeparator - 接收值的值分隔符分隔符字符 ShadowFinder -确定滞后/前导阴影的条形数量。 如果为负值,则表示阴影应位于主线对之前。
AverageMethod -根据Pearson公式计算对应关系的平均方法
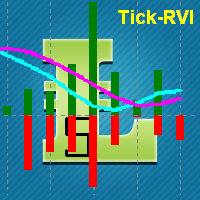
This indicator is designed for M1 time frame and shows: Sum of points when the price goes up (Green Histogram). Sum of points when the price goes down (Red Histogram). In other words, by the number and ratio of bullish points to bearish ones, you can do a technical analysis of the state of the market.
If the green histogram prevails over the red one, you can conclude that at the moment the buyers are stronger than the sellers, and vice versa, if the red histogram prevails over the green, the

This is HTF (or MTF) of original Kolier SuperTrend indicator. On this version, you can use 4 Lines of supertrend to define the trend, it will be more powerful. Remade signals on smalls timeframes, the indicator will not repaint if used on small timeframes.

It predicts the most likely short-term price movement based on advanced mathematical calculations.
Features Estimation of immediate price movement; Calculation of the real market trend; Calculation of the most important support and resistance levels; Algorithms optimized for making complex mathematical calculations with a minimal drain of system resources; Self-adjusting for better performance, so it’s able to work properly at any symbol (no matter how exotic it is) and any timeframe; Compatib

Description: Abigail is a medium-term trading system working on the price rollback. The Expert Advisor has been optimized for working on EURUSD. However, it can successfully work with other currency pairs as well. You can examine the Expert Advisor's trading statistics for different brokers and symbols at MetaTrader 4 and MetaTrader 5 Trading Signals sections. Parameters: Risk management: enter volume - market entry volume. If the value is greater than 0 - number of lots, if less than 0 - percen

The commodity channel index (CCI) is an oscillator originally introduced by Donald Lambert in an article published in the October 1980 issue of Commodities magazine (now known as Futures magazine). Since its introduction, the indicator has grown in popularity and is now a very common tool for traders in identifying cyclical trends not only in commodities, but also equities and currencies. The CCI can be adjusted to the timeframe of the market traded on by changing the averaging period. This indi

ZigZagLW - Brief Description This is an implementation of an idea described in Larry Williams' "Long-Term Secrets to Short-Term Trading". The first figure displaying the basic principle has been taken from that book.
Operation Principles The indicator applies optimized calculation algorithms with the maximum possible speed for non-redrawable indicator. In other words, the zigzag's last shoulder is formed right after the appropriate conditions occur on the market. The shoulder does not change i
This indicator is a combination of 2 classical indicators: MA and CCI. Two moving averages form Upper and Lower bands. The input parameter nPeriod is used for MA and CCI calculations. The PaleGreen clouds characterize Up and Down trends. The moment a cloud appears above or under upper or lower bound is the time to enter the market.

This Indicator is created for a M15 time frame. The Zero-Line means a flat market ( A flat market can refer to a trade in which the currency pair has not moved significantly up or down and, therefore, has no large gain or loss attributed to the forex trading position. Usually traders not trading when the market is flat). The positive and negative impulses indicate the Long and Short movements accordingly.

A flat market can refer to a trade in which the currency pair has not moved significantly up or down and, therefore, has no large gain or loss attributed to the forex trading position. Usually traders not trading when the market is flat.
This is a self-explanatory indicator - do nothing when the current price in a "cloud". The input parameters nPeriod and nMethod are used for calculating aqua clouds.
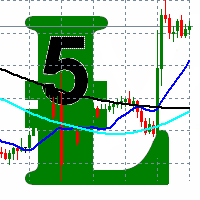
This indicator displays a main Moving Average line with input parameters nPeriod, nMethod and nPrice. The second line is calculated as a Moving Average from the data of the first line, in addition it has nPeriod_2 and nMethod_2 parameters. The third line is calculated as a Moving Average from the data of the second line, in addition it has nPeriod_3 and nMethod_3 parameters.
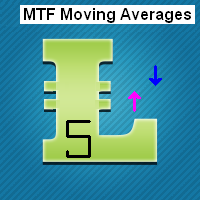
In finance, a moving average (MA) is a stock indicator that is commonly used in technical analysis . The reason for calculating the moving average of a stock is to help smooth out the price data by creating a constantly updated average price . This Indicator determines the current time frame and calculates 3 moving averages from the next 3 available time frames. You can put this indicator on M1, M5, M15, M30, H1 and H4 TF. Blue and Magenta Arrows show the moment to go Long or Short accordi

Fibonacci sequence is defined by integer sequence: 0, 1, 1, 2, 3, 5, 8, 13, 21, 34, 55, 89, 144, ... By definition, it starts from 0 and 1, the next number is calculated as a sum of two previous numbers. Instead of the standard moving average, the indicator uses the following calculation of average price: Bar0 + Bar1 + Bar2 + Bar3 + Bar5 + Bar8 + Bar13 + Bar21 + ... Input parameters: fiboNum - numbers in the following integer sequence for Fibo Moving Average 1. 5 on default. fiboNum2 - numbers i

"ATR channel all MAs jm" is a indicator that allows displaying on a chart the ATR channel calculated according to the moving average selected. You can select 9 standard MAs available in MetaTrader 5 - SMA, EMA, SMMA, LWMA, DEMA, TEMA, Frama, VIDYA, AMA, TRIX, and 4 non-standard - LRMA, HMA, JMA, AFIRMA.
General Parameters: Channel type - true: channel ATR, false: channel price. Method MA - select the type of moving average to show in the current graph. Period MA - the number of bars to calcula

"Bollinger Bands all MAs" is an indicator that allows drawing Bollinger Bands calculated according to the selected moving average. You can select 9 standard MAs available in MetaTrader 5 - SMA, EMA, SMMA, LWMA, DEMA, TEMA, Frama, VIDYA, AMA, TRIX, and 4 non-standard ones - LRMA, HMA, JMA, AFIRMA.
General Parameters Method MA - select the type of moving average to be displayed in the current graph. Period MA - the number of bars to calculate the MA. Width bands - the width of the bands expresse

本指标可以让您享受两个最流行的产品来分析在感兴趣的价位的请求量和市场成交量: 真实市场深度图表 真实报价足迹成交量图表 本产品结合两个指标的效力,并以单个文件提供。
反危机出售。今日低价。赶紧! 真实的 COMBO 市场深度功能和报价成交量图表,完全等同于原始指标。您将享受这两款产品结合为单一超级指标的力量!下面是您将得到的功能:
真实市场深度图表 股民专用工具现已在 MetaTrader 5 上可用。 真实市场深度图表 指标在图表上以直方条的形式显示可视化的市场深度,并在实时模式下刷新。 利用 真实市场深度图表 指标您可以正确评估市场请求并从图表上看到大的市场。这可以 100% 的精确剥头皮和设置持仓止损。 指标以两种相应颜色的水平直方条形式显示买和卖的请求 (买-卖)。价格图表上给定级别的显示条和它们的长度与请求的交易量相应。此外, 它指示买卖请求的最大交易量。 此指标显示买卖请求总数量作为堆积面积图。这可以评估当经过下一价位时将会执行的请求总量。买卖请求总数量也显示在图表上。 省缺, 指标显示在图表背景上, 且它不会干扰任何其它指标。当使用指标交易时, 建议使用实际交易量。

This indicator analyzes price action patterns and helps you to make positive equity decisions in the binary options market. [ Installation Guide | Update Guide | Troubleshooting | FAQ | All Products ] Easy to trade Trade both call and put options No crystal ball and no predictions The indicator is non-repainting The only strategy suitable for binary options is applying a mathematical approach, like professional gamblers do. It is based on the following principles: Every binary option represents
FREE

The indicator is an inter-week hourly filter. When executing trading operations, the indicator allows considering time features of each trading session. Permissive and restrictive filter intervals are set in string form. The used format is [first day]-[last day]:[first hour]-[last hour]. See the screenshots for examples. Parameters: Good Time for trade - intervals when trading is allowed. Bad Time for trade - intervals when trading is forbidden.
time filter shift (hours) - hourly shift. percent

If instead of giving the regression value indicator end of the regression line (LRMA), we give the value of its slope, we obtain LRS or Linear Regression Slope Indicator. Since the slope is positive when prices rise, zero when they are in range and negative when they are lowered, LRS provides us the data on the price trend. Calculation sum(XY, n) - avg(Y, n)*sum(X, n) Y= a + mX; m= -------------------------------- a= avg(Y, n) - m*avg(X, n)

Moving Average Bars is a self-explanatory indicator with one input parameter: nPeriod. When the previous Price Close is above the previous indicator Bar, the probability to go Long is very high. When the previous Price Close is under the previous indicator Bar, the probability to go Short is very high.

This indicator is designed for M1 timeframe and shows: Sum of points when the price goes up (Green Histogram). Sum of points when the price goes down (Red Histogram). In other words, by the number and ratio of bullish points to bearish ones, you can do a technical analysis of the state of the market.
If the green histogram prevails over the red one, you can conclude that at the moment the buyers are stronger than the sellers, and vice versa, if the red histogram prevails over the green, the s
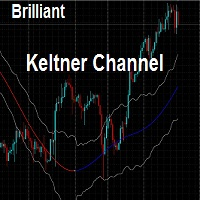
This indicator draws the Keltner Channel using the rates chart calculated from any other timeframe. The available Moving Averages are: Simple Moving Average Exponential Moving Average Smoothed Moving Average Linear Weighted Moving Average Tillson's Moving Average Moving Average line is coded into RED or BLUE according to its direction from the previous candle. Example: User can display the Keltner Channel calculated on the basis of a Daily (D1) chart on a H4 chart. NOTE: Timeframe must be higher
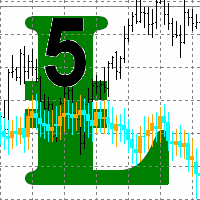
This indicator is based on the same idea as https://www.mql5.com/en/market/product/2565 , but instead of Average Bars it uses series or Fibonacci sequence. When the previous Price Close is above the previous indicator Bar, the probability to go Long is very high. When the previous Price Close is under the previous indicator Bar, the probability to go Short is very high.
This indicator is based on the Fibonacci sequence. The input parameters fiboNum is responsible for the number in the integer sequence. When the previous Price Close is above the ribbon, the probability to go Long is very high. When the previous Price Close is under the ribbon, the probability to go Short is very high.

Bands are a form of technical analysis that traders use to plot trend lines that are two standard deviations away from the simple moving average price of a security. The goal is to help a trader know when to enter or exit a position by identifying when an asset has been overbought or oversold. This indicator will show upper and lover bands. You can change input parameters nPeriod and nMethod to calculate those bands for each timeframe. Aqua clouds represent up or down trends.
Commodity Channel Index Technical Indicator (CCI) measures the deviation of the commodity price from its average statistical price. High values of the index point out that the price is unusually high being compared with the average one, and low values show that the price is too low. In spite of its name, the Commodity Channel Index can be applied for any financial instrument, and not only for the wares. There are two basic techniques of using Commodity Channel Index: Finding the divergences.
Th
R2 (R-squared) represents the square of the correlation coefficient between current prices and deducted from the linear regression. It is the statistical measure of how well the regression line is adjusted to the actual data, and therefore it measures the strength of the prevailing trend without distinguishing between ascending and descending one. The R2 value varies between 0 and 1, therefore it is an oscillator of bands that can show signs of saturation (overbought / oversold). The more the v
The Bears Bulls Histogram indicator is based on the standard Moving Average indicator. You have MA input parameters:
maPeriod - Moving Average period;
maMODE - Moving Average mode (0 = MODE_SMA; 1 = MODE_EMA; 2 = MODE_SMMA; 3 = MODE_LWMA); maPRICE - Applied price (0=PRICE_CLOSE; 1=PRICE_OPEN; 2=PRICE_HIGH; 3=PRICE_LOW; 4=PRICE_MEDIAN; 5=PRICE_TYPICAL; 6=PRICE_WEIGHTED). Green Histogram is representing an Up-trend and Red Histogram is representing a Down-trend.

WARNING: Product is out of support! Don't buy it unless you know how it works! Please download free version and test it heavily - it is enough for most uses.
This EA is famous (or infamous) grid strategy used by social traders. Its goal is to harvest most out of trending market (on automatic mode) taking advantage of corrections in trends. It can be also used by experienced traders on manual trading. This kind of system is being used by most successful social traders having 500+ paid subscri

Tired of adjusting the indicator settings losing precious time? Tired of the uncertainty regarding their efficiency? Afraid of the uncertainty in their profitability? Then the indicator ACI (automatically calibrateable indicator) is designed exactly for you. Launching it, you can easily solve these three issues just performing the simplest action: clicking a single Calibrate button. To achieve the highest efficiency, you should perform another additional action: move the power slider to the maxi
FREE

This indicator incorporates the volume to inform the market trend. A warning system (chart, SMS and e-mail) is incorporated for warning when a certain level is exceeded. Developed by Marc Chaikin, Chaikin Money Flow (CMF) measures the amount of Money Flow Volume (MFV) over a specific period. Money Flow Volume forms the basis for the Accumulation Distribution Line. Instead of a cumulative total of Money Flow Volume, Chaikin Money Flow simply sums Money Flow Volume for a specific look-back period.

2 yellow lines represent the Envelopes with automatic deviation. The Envelopes indicator is a tool that attempts to identify the upper and lower bands of a trading range. Aqua line represents classic Commodity Channel Index added to the Envelopes on the chart, not in a separate window. The Commodity Channel Index ( CCI ) is a technical indicator that measures the difference between the current price and the historical average price.

Trinity-Impulse indicator shows market entries and periods of flat. V-shaped impulse shows the time to enter the market in the opposite direction. Flat-topped impulse means it is time to enter the market in the same direction. The classical indicator Relative Vigor Index is added to the indicator separate window for double checking with Trinity Impulse.

Tired of adjusting the indicator settings losing precious time? Tired of the uncertainty regarding their efficiency? Afraid of the uncertainty in their profitability? Then the indicator ACI (automatically calibrateable indicator) is designed exactly for you. Launching it, you can easily solve these three issues just performing the simplest action: clicking a single Calibrate button. To achieve the highest efficiency, you should perform another additional action: move the power slider to the maxi
FREE

支撑和阻力指标是改编自标准的比尔威廉姆斯的分形指标。 该指标可工作于任何时间帧。它在图表上显示支撑和阻力位,并允许设置止损和止盈级别 (您可以通过鼠标覆盖级别来检查其精确值)。 蓝色点划线是支撑位。 红色点划线是阻力位。 如果您愿意, 您可以改变这些线的样式和颜色。 如果价格接近支撑位,卖方的活跃度降低,买方的活跃度增加。如果价格接近阻力位,买方的活跃度降低,卖方的活跃度增加。 注, 当价格突破支撑位, 它变为阻力位; 同样当价格突破阻力位, 它变为支撑位。

The Expert Advisor notifies that a price has crossed a line on the chart. It handles two types of lines - horizontal lines and a trendline. The number of lines is unlimited. It can also notify of changes in the margin level, in the total volume and profit (loss) for a symbol.
Parameters: price mode - price type (bid or ask). timeout - alert timeout. number of repeats - the maximum number of repeated alerts. comment lines - the number of lines in a comment. email - enable sending of Email notif

Advanced Trend Builder is a trend indicator using the original calculation algorithm. ATB can be used on any data and timeframe. My recommendation use for calculation numbers 4 - 16 - 64 - 256 and so on ..., but this is only recommendation. The middle of the trend wave is a special place where market behavior is different, when developed ATB was main idea to find the middle of the wave trend. Input parameters: Bars will be used for calculation - number of bars used for a trend line calculation.
FREE

Bollinger Bands strategy An EA to help traders using Bollinger Bands in trading provides an opportunity to evaluate the effectiveness and optimize the three trading methods (strategies) described in John Bollinger’s book BOLLINGER ON BOLLINGER BANDS, with some additions. I do not recommend using in the forex market. EA Parameters: Stop Loss, in pips Take Profit, in pips Trailing Stop Trailing Step Money management: Lot OR Risk Step trailing stop The value for "Money management" Deviation, in
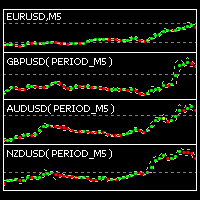
This indicator is intended for visual multicurrency analysis. It allows synchronous scrolling and analysis of a few charts simultaneously and can also be used for pairs trading. The indicator works both on Forex and on Russian FORTS market. The product has a very important property - if there are skipped bars at the symbols, the synchronism of charts on the time axis is fully preserved. Each chart point is strictly synchronous with the others on the time axis at any time frame. This is especiall
The Forex trading market operates 24 hours a day but the best trading times are when the major trading sessions are in play. The Sessions Moving Average indicator helps identify Tokyo, London and New York, so you know when one session starts, ends or even overlaps. This indicator also shows how session affects the price movement. Now, you can see the market trend by comparing the price with 3 Average lines or comparing 3 Average lines together.
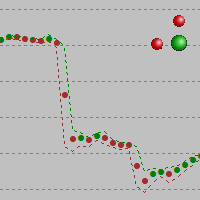
The alternative representation of a price chart (a time series) on the screen. Strictly speaking, this is not an indicator but an alternative way of visual interpretation of prices along with conventional ones - bars, candlesticks and lines. Currently, I use only this representation of prices on charts in my analysis and trading activity. In this visual mode, we can clearly see the weighted average price value (time interval's "gravity center") and up/down dispersion range. A point stands for (O
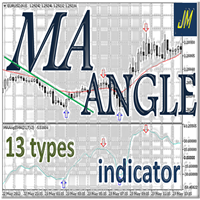
"MA Angle 13 types" is an indicator that informs of the inclination angle of the moving average curve that is displayed on the screen. It allows selecting the MA method to use. You can also select the period, the price and the number of bars the angle is calculated for. In addition, "factorVisual" parameter adjusts the information about the MA curve angle displayed on this screen. The angle is calculated from your tangent (price change per minute). You can select up to 13 types of MA, 9 standa

该专家顾问实施了最初的丹尼斯和埃克哈特交易系统,通常被称为“乌龟交易者”。它的交易方式与原始海龟完全一样,并且可以由经验丰富的交易者使用以捕获向上或向下市场中的趋势。 [ 安装指南 | 更新指南 | 故障排除 | 常见问题 | 所有产品 ] 易于使用和监督 完全可配置的策略设置 完全可配置的交易设置 适用于ECN /非ECN经纪人和2-3-4-5数字符号 适用于差价合约和外汇工具 该策略交易两个互补系统,一个主系统和一个故障安全系统: 系统一交易20天突破,并在10天突破完成交易 系统2交易55天突破,并在20天突破完成交易 该策略的基本原则如下: 根据最后一个信号的结果过滤交易 交易以ATR(30)/ 2的时间间隔最多可进行4笔交易 跟踪止损适用于所有使用卖/买+/- ATR(30)* 2的交易 每减少20%,每笔交易的风险就会降低10% 该EA实现了原始乌龟交易者的默认设置,但此后在金融市场发生了很大变化。为了获得利润,交易者将必须对交易内容做出最佳判断,并优化策略测试器中的设置。
设置
将EA交易程序加载到任何图表时,将为您提供一组选项作为输入参数。如果您认为它们太多,

Synthetic Reverse Bar is an evolution of Reverse Bar indicator. It is well-known that candlestick patterns work best at higher timeframes (H1, H4). However, candlesticks at such timeframes may form differently at different brokers due to dissimilarities in the terminal time on the single symbol, while the history of quotes on M1 and M5 remains the same! As a result, successful patterns are often not formed at higher timeframes! Synthetic Reverse Bar solves that problem! The indicator works on M5
MetaTrader市场是独有的自动交易和技术指标商店。
阅读MQL5.community用户备忘更多地了解我们提供给交易者的独特的服务:复制交易信号,自由职业者开发的自定义应用程序,通过支付系统完成的自动付款和MQL5云网络。
您错过了交易机会:
- 免费交易应用程序
- 8,000+信号可供复制
- 探索金融市场的经济新闻
注册
登录