适用于MetaTrader 5的付费技术指标 - 6

Long & Short Based on Cointegration Statistical and Quantitative Long-Short (Pair Trading) approach for long and short positions. Your CPU will always be safe and stable when using Multiple Linear Regression if you have a reliable indicator. Based on the results of this indicator, you can execute a long and short or a long and long/short and short trade between two separate assets. It can show you a Highly informative dashboard based on Cointegration Search you determine, with all statistical d

Description
Bitcoin Manager is the best indicator for trading Bitcoin cryptocurrency. It is calculated based on the price deviation from the moving average line channel. Ascending and descending arrows indicate potential points and levels for opening buy and sell positions.
How to use?
We strongly recommend using this indicator on the H1 timeframe. An up arrow indicates a buy level. Down Arrow - Sell Level.
Parameters
Maximum History Bars - maximum count of history bars to calculate

这个多时间框架和多品种指标扫描 pin bar。结合您自己的规则和技术,该指标将允许您创建(或增强)您自己的强大系统。 特征 可以同时监控您的市场报价窗口中可见的所有交易品种。将该指标仅应用于一张图表,并立即监控整个市场。 可以监控从 M1 到 MN 的每个时间范围,并在识别出 pin bar 时向您发送实时警报。支持所有 Metatrader 原生警报类型。 可以使用 RSI 或布林带作为趋势过滤器,以便正确识别潜在的逆转。 该指示器包括一个交互式面板。请参阅单独的屏幕截图。 可以配置为显示买入/卖出线和 TP/SL 线(基于 ATR 乘数)。这些线将显示在您通过单击面板中的信号打开的图表上。请看下面的截图
该指标可以将信号写入一个文件,EA 可以使用该文件进行自动交易。
输入参数
输入参数的描述和解释可以在 这里 找到。 重要的
请注意,由于具有多功能性,既不会在安装指标的图表上绘制买入/卖出建议,也不会绘制线条和箭头。它们将绘制在图表上,该图表将在单击面板中的信号时打开。强烈建议将指标放在干净(空)图表上,不要在其上放置任何其他可能干扰扫描仪的指标或智能交易系统。

StartPoint是一个很好的短线交易指示器,这个指标可以单独使用,但是最好是配合 HighQualityMap 一起使用,适用于任何时间框架,喜欢超短线的朋友可以使用M5时间框架。它能很好的体现出短期趋势的启动点,你可以很快的从这个指示器上寻找到最佳的buy和sell位置,同时也能很好根据指示器去坚守自己的持仓定订单。指标不含有未来函数,不会重新绘制,不仅能够应用到自己的手动交易过程中,还能完全可以写入到自己的EA中。(如果你感觉到这个指标能够帮助你进行更准确的交易,请帮忙给个好评,希望我的作品能够帮助更多有需要的人) ===================参数列表===================== 所有参数均采用默认参数即可,无需更改,若为激进型交易者,可以根据自己的需要来调整参数。 =================参考使用方法=================== 此指标可以适用于任何交易品种。
Indicator Name: Signal Generator Non Repaint. The arrow is non-repaint. Its a non-repaint arrow or money back guarantee. Arrow appeared after candle closed. Very accurate. Time Frame: Any Assets: Any This is MT5 version I use this to trade Gold, US30, Nasdaq and Dax at New York and London Opening. TF m5/m15 Parameters: Push Notifications = True ( You can set the alert send to your mobile phone)
To Setup Sending Alert to your mobile phone 1. At Metatrader Options > Options > Notifications > Ena

Magnetic levels for MT5 is a great addition to your trading strategy if you use support and resistance levels, supply and demand zones. The price very often gives good entry points to the position exactly at the round levels and near them.
The indicator is fully customizable and easy to use: -Choose the number of levels to be displayed -Choose the distance Between The levels -Choose the color of the levels.
Can be added to your trading system for more confluence. Works very well when combin

This indicator draws regular bullish and bearish divergences in real-time onto the charts. The algorithm to detect those divergences is based on my 10+ years experience of detecting divergences visually. The divergences are drawn as green and red rectangles on the charts. You can even do forward testing in the visual mode of the strategy tester.
Parameters Fast EMA Period: The period of the fast EMA of the MACD. Default value is 12.
Slow EMA Period: The period of the slow EMA of the MACD. Def

The indicator displays a matrix of indicators across multiple timeframes with a sum total and optional alert. Custom indicators can also be added to the matrix, in a highly configurable way. The alert threshold can be set to say what percentage of indicators need to be in agreement for an alert to happen. The alerts can turned on/off via on chart tick boxes and can be set to notify to mobile or sent to email, in addition to pop-up. The product offers a great way to create an alert when multiple

*Non-Repainting Indicator Bruce Webb Explains How To Use Bruce's Price Predictor In Detail And Free Forex Strategy https://youtu.be/hfoB1tZZpTo Bruce's Price Predictor is an indicator that shows precise price reversals. A great arsenal to add to any chart. Bruce's Price Predictor points price reversals with high degree of accuracy and it is great for scalping on the 1min time frame, Or swing trading on the 1hr time frame. Buy and sell arrows are shown on the chart as for entry signals. They do

30% Discounted ONLY 10 COPIES HURRY UP! 8 LEFT COPIES MTF UPDATED IN NEW VERSION Note: If MTF Order Not Work just do one thing one, when you set Show_mtf to true then don't change otf timeframe instead you insert indicator and then again open setting and change current otftimeframe to other in this way it will work. It issue from Mql5 not refresh setting properly. Very precise patterns to detect High Accurate Order Blocks: It Draw zone after market Structure Breakout with a high Accuracy,

商品通道指数 (CCI) 指标的多货币和多时间框架修改。 您可以在参数中指定任何所需的货币和时间范围。 此外,该面板还可以在跨越超买和超卖水平时发送通知。 通过单击带有句点的单元格,将打开该符号和句点。 这是 MTF 扫描仪。
默认情况下,从图表中隐藏仪表板的键是“D”。
参数 CCI Period — 平均周期。 CCI Applied price — 价格类型。 Clear the chart at startup — 启动时清除图表。 Set of Pairs — 符号集 — Market Watch — 来自“市场观察”的货币对; — Specified manually — 在参数“Pairs”中手动指定对。 — Current pair — 当前对。 Pairs (separated by a space or semicolon) — 由空格或分号分隔的符号列表。 货币名称的书写方式应与经纪商的名称完全相同,并保留大小写和前缀/后缀。 Time Frames (separated by a space or semicolon) — 由空格或分号分隔的时

Do you already know the Start Midas indicator?
What about the Vwap Standard Deviation indicator?
And I need to speak again in the book MIDAS Technical Analysis ...
The Start Midas SD Channel indicator combines the two in one, bringing the practicality and efficiency of Midas with the statistical calculation of the standard deviation.
All of this with the practicality of the White Trader Start indicators, where you can plot the indicator and move them on the screen using keyboard s

All about Smart Money Concepts Strategy: Market struture: internal or swing BOS, CHoCH; Orderblock; Liquity equal; Fair Value Gap with Consequent encroachment, Balanced price range; Level with Previous month, week, day level or in day level (PMH, PWH, PDH, HOD); BuySell Stops Liquidity (BSL, SSL); Liquidity Void Long Wicks; Premium and Discount; Candle pattern ... "Smart Money Concepts" ( SMC ) is a fairly new yet widely used term amongst price action traders looking to more accurately navigate

(谷歌翻译) 该指标基于作为源代码示例提供的原始 ZigZag 以及 MetaTrader 安装。 我用一些额外的功能重写了它,用于显示“深度”通道和相应的突破。 它还允许人们观察先前的之字形点。 可选地,它可以在发生突破时提醒用户。 警报可以简单地在终端上,也可以通过移动设备上的推送通知,使用您自己的自定义文本。 (谷歌翻譯) 該指標基於作為源代碼示例提供的原始 ZigZag 以及 MetaTrader 安裝。 我用一些額外的功能重寫了它,用於顯示“深度”通道和相應的突破。 它還允許人們觀察先前的之字形點。 可選地,它可以在發生突破時提醒用戶。 警報可以簡單地在終端上,也可以通過移動設備上的推送通知,使用您自己的自定義文本。 (Original text) This indicator is based on the original ZigZag provided as a source code example with MetaTrader installations. I rewrote it with some extra features for displaying t

The indicator High Trend Pro monitors a big number of symbols in up to 4 timeframes simultaneously and calculates the strength of their signals. The indicator notifies you when a signal is the same in different timeframes. The indicator can do this from just one chart. Therefore, High Trend Pro is a multicurrency and multitimeframe indicator. High Trend Pro uses emproved versions of popular and highly demanded indicators for calculating its signals. High Trend Pro calculates the signal strength

Pips Hunter PRO 历经数年开发,是其前身的改进版。这个功能强大的指标分析市场和价格历史,生成买入和卖出条目。在计算这些条目时,它使用了不同的协同工作指标以及复杂的统计对数,可过滤并消除不利条目/ MT4 版本 。 由于不断寻求保持策略的高效率水平,价格将逐步提高,直至达到 1000 美元。下一个价格 --> 69 美元
功能特点 无重绘
当新数据到来时,该指标不会改变其数值
无滞后 该指标无滞后 交易货币对
所有外汇货币对 (最好是 EURGBP)
时间框架
所有时间框架
参数 ===== 显示 =====
箭头距离 // 信号(箭头)与蜡烛图之间的距离
===== 警报 =====
弹出式警报 // MT4 终端警报
推送通知警报 // 用于手机的警报
电子邮件警报 // 电子邮件警报
===== 图表设置 =====
更改图表上烛台颜色的选项
警告 我只在 MQL5.com 上销售我的产品。如果有人联系您向您推销我的产品,那么他们就是骗子,只想要您的钱。
此外,如果您从外部网站购买我的产

Automatically detect bullish or bearish order blocks to optimize your trade entries with our powerful indicator. Ideal for traders following ICT (The Inner Circle Trader). Works with any asset type, including cryptocurrencies, stocks, and forex. Displays order blocks on multiple timeframes, from M2 to W1. Alerts you when an order block is detected, migrated, or a higher timeframe order block is created/migrated. Perfect for both scalping and swing trading. Enhanced by strong VSA (Volume Spread A

使用 The Strat 进行交易时,关注多个时间范围很重要。 该指标将显示每个时间范围内当前蜡烛的每日、每周、每月和每季度状态。 圆圈图标表示该时间范围内的蜡烛目前是内部蜡烛,或 TheStrat 术语中的类型 1。 Inside Day 蜡烛正在巩固价格走势,我们正在寻找该范围的突破。 指向上或下的三角形图标是趋势蜡烛,或 TheStrat 术语中的类型 2。趋势蜡烛可以是看涨或看跌,表明它已经突破了之前的蜡烛范围,现在正朝着一个方向发展。 方形图标是外部蜡烛,或 Strat 术语中的类型 3。这表明两件事,一是价格在该时间范围内的方向未定,可能相当波动,二是在较短的时间范围内,可能有很好的交易空头反转机会。该正方形将是看涨或看跌的颜色,以显示当前获胜的一方。 每个图标使用的颜色都可以根据您的喜好进行配置,文本和图标的大小也是可配置的。 设置
时间范围选择 每小时显示 当为 True 时,显示每小时蜡烛状态。 每日秀 当为 True 时,显示每日蜡烛状态。
每周秀 当为 True 时,显示每周蜡烛状态。 每月显示 当为 True 时,显示每月蜡烛状态。 季刊 当为 True 时

介绍 RSIScalperPro - 这款基于 RSI 指标的革命性交易指标适用于 MetaTrader 5,专为一分钟图表的剖刺交易而设计。借助 RSIScalperPro,您将拥有一个强大的工具箱,用于精确的入场和出场信号,提升您的交易水平。 RSIScalperPro 使用两种不同的 RSI 指标,为超买和超卖区域提供清晰的信号。您可以根据自己的偏好自定义两个 RSI 的时间周期和限制值,以实现您的交易策略的最佳效果。图表上的明显箭头使您可以轻松识别何时进入或退出交易。 RSIScalperPro 的另一个亮点是三个可自定义的移动平均线,帮助您识别趋势方向并确认强大的交易信号。这使您可以早早发现趋势并参与到盈利交易中。 此外,您可以设置 RSIScalperPro 发出每个新交易信号的听觉警报。这样,即使您不经常坐在计算机屏幕前,也不会错过任何重要的交易机会。 RSIScalperPro 提供用户友好的界面,并且在 MetaTrader 5 中很容易插入和配置。您可以根据个人交易偏好自定义指标,并利用其多样化的功能,提高交易成果。 利用 RSIScalperPro 的优势,提高
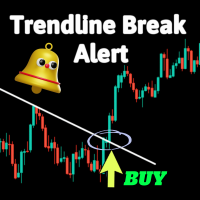
這是一個簡單的指標,可以提供趨勢線突破的警報。
如果您在交易中習慣使用趨勢線,它可能會很有用。 可調參數包括:
蠟燭標識:突破後何時發出信號 以及三種類型的警報: 發送郵件 聽得到的警報 推送通知
為了測試目的,我們建議使用 MetaTrader 4 而不是 MetaTrader 5 的策略測試器,因為它不支持繪製趨勢線。
MT4 版本在: https://www.mql5.com/en/market/product/111112?source=Site+Market+My+Products+Page
觀看此視頻以了解如何在您的手機上設置通知警報:
https://www.youtube.com/watch?v=4oO-3fMQ4QA
安裝指南:
https://www.mql5.com/en/blogs/post/739828
https://www.mql5.com/en/blogs/post/751762
我歡迎您對指標提供反饋或評論。
祝您交易成功!

RSI 交叉警报 是一个功能强大的通知系统,专为在其交易策略中使用 相对强度指数 (RSI) 的交易者而设计。该指标侧重于识别 RSI 交叉,当快速 RSI 线穿过慢速 RSI 线上方或下方时发生。通过结合这些交叉点,该指标可以有效地过滤掉错误信号,让交易者做出更准确的交易决策。 RSI 交叉警报提供了几个增强其功能和可用性的关键功能。它适用于任何时间框架和交易品种,为交易者提供灵活的交易方式。该指标还拥有用户友好的参数,允许交易者根据自己的喜好和交易策略轻松定制其设置。此外,该指标可以在图表上绘制之前的信号,使交易者能够分析历史交叉模式。 为确保交易者不错过重要的交易机会,RSI Crossover Alert 包含一个快速通知系统。该系统提供及时的弹出消息提醒,让交易者了解潜在的 RSI 交叉和信号机会。通过及时收到这些警报,交易者可以立即采取行动并利用有利的市场条件。 该指标的参数设置包括调整快速RSI周期、慢速RSI周期、RSI应用价格、起始蜡烛指数、历史计算周期、箭头距离、买入箭头字符、卖出箭头字符、买入颜色、卖出颜色和警报重置周期的选项.交易者可以微调这些参数以符合他们个

5/10份,30美元--->下一个50美元// MT4版本
Forex Vigor 是一个技术指标,评估8种主要货币(欧元、英镑、澳元、新西兰元、美元、加元、瑞士法郎、日元)的动能强度。该指标依靠数学计算来衡量28种货币对之间缺乏相关性的情况。为了计算它们的价值,它使用线性加权平均法(LWMA)加上一个统计系统来分析收盘价之间的百分比差异,该系统消除了模型中不代表意义的价值。这种方法提供了一个加权平均值,使最近的价格变动具有更多的意义。通过考虑这个百分比的差异,该指标提供了一个衡量货币动量的强度和方向。
由于它能够评估主要货币的动能强度,并对市场动态提供有价值的见解,该指标可以帮助交易者识别潜在的交易机会,做出更明智的交易决定,并有效地管理风险。
特点 无重绘 新数据到来时,该指标不改变其数值 交易对 28个交易对 时间框架 所有 (M1, M5, M15, M30, H1, H4, D1, W1, MN) 交易时间 每天24小时
配置
ma_period:这个参数影响算法的计算,按照你的意愿使用它。默认情况下,你不需要改变它。 ma_delta:这个参数会影

Boom and Crash Spike Detector 指标是根据主要用于检测价格中的 Boom 和 Crash 的高级策略进行编码的。 植入了复杂的算法来检测价格中高概率的繁荣和崩溃。 它会在潜在的繁荣或崩溃阶段发出警报: 繁荣阶段:当价格上涨过快时。 崩溃阶段:当价格下跌过快时。
限时优惠:该指标仅适用于 30 美元和终身。
主要特征
向手机发送推送通知 在计算机或笔记本电脑上弹出并发出警报 显示非重绘箭头(向上箭头表示潜在繁荣,向下箭头表示潜在崩溃) 与所有对一起工作。
推荐
时间范围:H1 和 H4 推荐货币对:处于趋势阶段的货币对。
接触
如果您有任何问题或需要帮助,请通过私信联系我。
作者
SAYADI ACHREF,金融科技软件工程师和 Finansya 创始人。

线性回归的截距值和相对于截距值对称的平均绝对偏差的表示。
参数
•Periods:计算线性回归的周期数
•Amplitude:定义频段的绝对平均偏差的倍数
•Displacement:水平轴上的位移
•AppliedPrice:进行计算的价格
•MainPlot:显示主图
•UpperPlot:显示上限
•LowerPlot:显示较低频段
请注意,当价格处于范围内时,移动平均线只是线性回归。在这里,我们看到了线性回归相对于最常用的指标之一的优势,那就是它在价格趋势变化时以相同的方式进行调整,但在移动平均线方面没有变化。
使用建议
•与移动平均线相比超级快,因此MainPlot更好地代表了价格
•波段可以更准确地定义价格通道,不仅在范围上,而且在趋势上,这都是波动交易的理想选择
•它可以用于肉眼可视化趋势,也可以用于价格的持续加速和减速。每当价格高于MainPlot时,价格就会加速,而当价格低于MainPlot时,价格也会相反。
记得!!!…
•指标

The Market Reversal Catcher indicator looks for market reversal points or major pullback. To do this, it analyzes previous price movements and using a flexible algorithm for estimating the probability of a reversal, also gives recommendations on entry points and sets recommended profit targets for positions opened on a signal. Market Reversal Cather User Guide - Read Version for MetaTrader 4 - here The indicator is very easy to use and does not require a lot of information to understand how it

Ultimate Reversal Scanner (Multi Pair And Multi Time Frame) : ---LIMITED TIME OFFER: NEXT 25 CLIENTS ONLY ---46% OFF REGULAR PRICE AND 2 FREE BONUSES ---SEE BELOW FOR FULL DETAILS Reversal patterns are some of the most widely used setups in the institutional trading world.
And the most (statistically) accurate pattern of them all is called the ' Three Line Strike '. According to Thomas Bulkowski ( best selling author and a leading expert on candlestick patterns ),
the ' Three Line Strike '
算法图
特征
- 入门级
- 获利水平
- 逆转入场点
- 逆转策略
- 趋势交易策略
- 在每个时间框架上买卖波动交易信号
#1 交易软件使用这款 MT5 软件随时击败任何市场!
想要通过道具公司 算法地图对道具公司友好!
交易新手,想要一个长期有效的策略,请使用我们内置于算法地图中的反转策略!
MT5 商店 90% 折扣!
(专为白色图表而设计)
由交易者为交易者打造!
如何使用?
- 等待 07:00 MT5 服务器时间,以便算法完全运行,交易时间将用绿线标记,一旦您看到绿线被越过,就可以开始交易了
-如果价格达到杀伤区的入门水平,则反转的可能性很高,所以我会进行反转交易
- 如果您认为价格将跟随趋势交易进入并瞄准趋势目标价/止盈
- 如果您认为价格将从入门水平反转,请进入反转交易并瞄准反转目标价/止盈

創建 MT5 的指標“HLC_bar_MT5 Wyckoff”是為了方便交易時的分析。 HLC Bar 由 Richard Wyckoff 使用,目前廣泛用於“VSA”操作。 Wyckoff 發現使用 High、Low 和 Close 使圖表更清晰、更易於分析。 指標“HLC_bar_MT5 Wyckoff”允許: # 改變條寬; # 保持條形相同的顏色; # 並突出顯示以相同價格開盤和收盤的柱。 顏色和寬度很容易在設置中修改 要使用該指標,只需將其拖到圖表上即可。 當與成交量一起使用時,威科夫將 HLC 圖表稱為條形圖。 他們試圖隱藏這些信息多年,但現在每個人都可以訪問這些信息,並可以使用此類圖表改進他們的操作。 HLC bar MT5 Wyckoff Chart 可用於任何市場和任何圖表時間,使操作員更加舒適。

Features
All Ichimoku Signals (Selectable) : Display all reliable signals generated by the Ichimoku indicator. You can choose which signals to view based on your preferences. Filter by Signal Strength : Sort signals by their strength—whether they are weak, neutral, or strong. Live Notifications : Receive real-time notifications for Ichimoku signals.
Transparent Cloud : Visualize the Ichimoku cloud in a transparent manner.
Available Signals
Tenkensen-Kijunsen Cross Price-Kijunsen Cross Pri

The Market Time indicator shows in a simple and objective way the opening hours of the main exchanges in the world. Define the number of days to be displayed and choose the options available for the appearance of each vertical line of each market in the indicator. With this Market Hour indicator you will be able to see the opening hours of the main markets in the world more easily and quickly. Note that the opening time of each market to be inserted in the indicator is the time of your broker's

/////這是將在 Deriv mt5 交易平台上使用 CRASH 綜合指數徹底改變交易的指標//////
神釘墜毀。
主要特點:
僅在 CRASH 索引中提供服務。 它有一個趨勢過濾器。 僅在市場下跌時發送警報。 聲音警報。 您可以將警報發送到手機。
如何使用:
適用於 m1 和 m5 的時間。 等待聲音警報。 分析存在強勁趨勢或已經開始。 不要在趨勢結束時保持警惕。 找到合理的每日利潤。 對持有的資本進行充分的風險管理。 不要過度槓桿化。
聯繫以獲取更多信息:
WhatsApp: +5930962863284
在這裡你可以找到我的繁榮指數指標。 https://mql5.com/8bw9b
購買後與我聯繫,向您發送有關如何盡可能多地使用此工具的附加指南

Traders Dynamic Index (TDI) MetaTrader indicator — a comprehensive but helpful indicator that uses RSI (Relative Strength Index), its moving averages, and volatility bands (based on Bollinger Bands) to offer traders a full picture of the current Forex market situation. Here is single timeframe product. Once puscharse this indicator, you free to use MTF scanner (free at here ) The Traders Dynamic index TDI indicator is the next generation of the popular Trader Dynamic index indicator dev

The Vwap Bands Auto indicator seeks to automatically map the maximum market frequency ( automatic update of the outermost band ) and has two intermediate bands that also adjust to daily volatility.
Another tool from White Trader that combines price and volume, in addition to mapping the daily amplitude.
The external band is updated automatically when the daily maximum or minimum breaks the current frequency, and can be an input signal, seeking a return to the daily vwap.
Thus, in ad

I do not have the exact indicator for MT4 but the nearest possible look alike can be downloaded from here . Also you may check this link . This is the exact conversion from TradingView: "Donchian Trend Ribbon" By "LonesomeTheBlue". One of the coolest indicators out there to detect trend direction and strength. As a trader you always need such indicator to avoid getting chopped in range markets. There are ten buffers as colors to use in EAs also. The indicator is loaded light and non-repaint. Not

Mean Reversal Heikin Ashi Indicator calculates special trade reversal points based on Heikin Ashi candlesticks patterns. This indicator can be used on all symbols, even in Forex or B3 Brazillian Markets. You can configure just the position of each arrow. Then, after include the indicator on the graphic, pay attention on each arrow that indicates a long or short trade.

To get access to MT4 version please click here . - This is the exact conversion from TradingView: "Twin Range Filter" by " colinmck ". - This is a light-load processing and non-repaint indicator. - All input options are available. - Buffers are available for processing in EAs. - You can message in private chat for further changes you need. Thanks for downloading

To get access to MT4 version please click here . This is the exact conversion from TradingView: QQE MT4 Glaz-modified by JustUncleL This is a light-load processing and non-repaint indicator. All input options are available. This is not a multi time frame indicator. Buffers are available for processing in EAs. You can message in private chat for further changes you need.

To get access to MT4 version please click here . Also you can check this link . This is the exact conversion from TradingView: "UT Bot" by "Yo_adriiiiaan". This is a light-load processing indicator. This is a non-repaint indicator. Buffers are available for processing in EAs. All input fields are available. You can message in private chat for further changes you need. Thanks for downloading

This indicator helps you identify support and resistance levels. Also it adds break points when level is broken. Price sometimes goes back to break point. It has 4 technical parameters and 4 buffers for expert advisors. Buffer indexes: 0 - Resistance, 1 - Support, 2 - Resistance break point, 3 - Support break point". Number of Levels: Determines how many levels are on graph ( if 3 - 3 levels of support and 3 levels of resistance) Tolerance in percentage %: This parameter is used to filter out

You can think of these indicators as moving pivot points. MasterChartsTrading Price Action Indicators show good price levels to enter or exit a trade. The Blue indicator line serves as a Bullish Trend setter. If your instrument closes above the Blue line, we think about going Long (buying). When your trading instrument closes below the Red line, we think about Shorting (selling). It is very easy to read price action if you have a reference point. These support/resistance lines are there to help

Symbol Changer this Indicator for make more easy when change Chart pair, this more usefull if trader make deal with many pair.
Property Input Indicator Custom Unique ID : Indicator have Id for make different. Show Profit Loss : Adjustable for Show or no Profit and Loss Option Horizontal/Vertical button : Button can change Horizontal or Vertical. Option Window : Adjustable in main Chart as window or buttom chart as Window 1, 2 Main Pairs Preset / Own Pair : available group pair for make easy ha

Think of the rarest pair you can think of. And I assure you that this indicator can compute it is strength. This Currency Meter will literally calculate any currency pairs, either it is a major pair, metal, CFD, commodity, cryptocurrency like Bitcoin/BTC or Ethereum/ETH and even stocks. Just name it and you will get it! There is no currency pair this Currency Meter cannot solve. No matter how rare or exotic is that currency, it will always be solved by this Currency meter on a real-time basis. S

交易量加權平均價格指標是一個顯示在 MT5 主圖表窗口中的線研究指標。 該指標監控典型價格,然後用於自動將指標線推向交易活躍的價格的交易量。 這些價格是交易最多的合約(或手數)的價格。 然後,在回顧期內對這些加權價格進行平均,並且該指標顯示這些推動價格的線研究。
本文中的指標允許交易者設置回溯期的每日開始時間。 該指標自動顯示 5 個每日回顧週期:當前形成的周期以及基於同一開始時間的前 4 天。 因此,該指標僅適用於日內交易。 該指示器也會自動顯示這些天的垂直每日開始時間分隔線。 典型價格和交易量都是全天累積並全天處理的。
重要更新:該指標的 v102 允許您將 VWAP 和區間的起點錨定到最近的主要高點或低點,即使該高點或低點幾天前出現在圖表中也是如此。 這就是機構交易者和流動性提供者經常使用 VWAP 進行市場交易的方式。
該指標還顯示 6 個標準差帶,與布林線指標顯示此類帶的方式類似。 交易者能夠在成交量加權平均價格線研究上方設置 3 個單獨的標準差乘數值,在成交量加權平均價格線研究下方設置 3 個單獨的標準差乘數值。 較高的乘數值將產生快速擴大的標準偏差帶,因為

Introducing "Congestion Breakout MT5" - the indicator that helps you identify congestion zones in your chart and alerts you when the price breaks through them. Traders know that congestion zones can be key areas of price action and can indicate potential turning points in the market. However, spotting these zones and anticipating breakouts can be a difficult and time-consuming task. That's where "Congestion Breakout" comes in. This powerful indicator uses advanced algorithms to analyze the pri

Contact me after payment to send you the user manual PDF file. Download the MT4 version here. Unlocking Trading Insights Dive into the heart of market dynamics with Advance Divergence Scanner designed for traders seeking a competitive edge. The Divergence Indicator is your key to identifying crucial divergences across various charts, empowering you to make informed decisions in the dynamic world of financial markets. The Divergence A Divergence signals a potential reversal point because directi

本指标可以让您享受两个最流行的产品来分析在感兴趣的价位的请求量和市场成交量: 真实市场深度图表 真实报价足迹成交量图表 本产品结合两个指标的效力,并以单个文件提供。
反危机出售。今日低价。赶紧! 真实的 COMBO 市场深度功能和报价成交量图表,完全等同于原始指标。您将享受这两款产品结合为单一超级指标的力量!下面是您将得到的功能:
真实市场深度图表 股民专用工具现已在 MetaTrader 5 上可用。 真实市场深度图表 指标在图表上以直方条的形式显示可视化的市场深度,并在实时模式下刷新。 利用 真实市场深度图表 指标您可以正确评估市场请求并从图表上看到大的市场。这可以 100% 的精确剥头皮和设置持仓止损。 指标以两种相应颜色的水平直方条形式显示买和卖的请求 (买-卖)。价格图表上给定级别的显示条和它们的长度与请求的交易量相应。此外, 它指示买卖请求的最大交易量。 此指标显示买卖请求总数量作为堆积面积图。这可以评估当经过下一价位时将会执行的请求总量。买卖请求总数量也显示在图表上。 省缺, 指标显示在图表背景上, 且它不会干扰任何其它指标。当使用指标交易时, 建议使用实际交易量。

There is a very simple rule
It is Always difficult to cross high pressure areas and easy to cross low pressure areas
MT4 version is available here
This is definitely true for price
It was so simple, it was not!
So let's get started
This indicator shows you the amount of pressure in that area according to the bars that it shows. The longer the bar, the higher the pressure in that area It also marks the most pressed area with a rectangle
From now on you can simply decide on the

Automatic cataloging of probabilistic strategies for Binary Options.
Including: * MHI 1, 2 and 3, "MHI potencializada", M5 variation, Five Flip, "Padrão do Milhão", "Três Vizinhos", C3 and Turn Over. * Analysis by time range, date, and days of the week. * Function that brings results from other pairs. * Analysis only following trend and / or side market. * Operation analysis filtering only entries after hit. * Alert after x number of hits, after loss in martingale, or in each new quadrant ent

The VSA Smart Money indicator tracks the movement of professional traders, institutional trades and all compound man movements. The VSA Smart money Indicator reads bar by bar, being an excellent tool for those who use VSA, Wyckoff, PVA and Any other analysis that uses price and volume. There are 10 indications that you will find in your Chart: *On Demand *Climax *UT Thrust *Top Reversal bar *Stop Volume *No Supply *Spring *Reversal Bottom *Shakeout *Bag Holding Using this indicator you will be o

Do you want to know how an economic event will impact price? What will happen to price after the news? How has an economic news affected price in the past? This indicator can help you with that.
Do you like technical analysis? Do you enjoy studying the history to predict the future? But what do you think could be more important than technical analysis, what could improve technical analysis? Of course, it's fundamental analysis! After all, economic events directly impact the market, and theref

使用该工具快速分析市场结构,并利用重要的价格水平。
市场结构
该自定义指标绘制重要价位,可用作进场点或盈利目标。
确定交易范围
利用该指标,根据市场转折点进行剥头皮。
突破交易机会
使用该指标发现突破机会。这种交易策略具有极佳的风险回报比。
自定义警报
当价格突破特定交易区间时,您可以在手机上收到通知或电子邮件。如果您觉得需要根据自己的交易策略定制这些警报,请随时给我发信息。
智能资金概念
该指标是与自营交易商合作开发的,以遵循他们的智能资金理念。
设计简单
我们没有在图表上绘制所有可能的区域,而是决定只绘制我们认为需要关注的主要水平。因此,该指标非常简单,也是初学者的好工具
开放式支持
我们愿意根据您的交易需求定制该指标。如果您有任何建议或需求,请随时给我发消息。
输入: 警报: 信号形成时发送警报--启用后,每次指标形成新的支撑/阻力区时都会收到警报。
突破时发送警报 - 启用后,每当蜡烛收盘突破支撑/阻力区时,都会收到警报。
允许每个信号发出多个警报--发生突破警报时,如果打开此设置,当价格收盘回到突破

Here we have the Start Midas Fibo Bands , I confess that it is an indicator that excited me enough to operate because I was able to find more defined rules. Well, the indicator has the functions of the other indicators of the Start line , which is a possibility to plot several Midas on the screen, you can move the anchor point using keyboard shortcuts and use the legend to differentiate one anchor from another. The rules that I have analyzed for my possible setup are recommended to the entry, st

Alpha Trend MT5 is a trend indicator for the MetaTrader 5 platform; it has been developed by a group of professional traders. The Alpha Trend MT5 indicator finds the most probable tendency reversal points, which allows making trades at the very beginning of a trend. This indicator features notifications, which are generated whenever a new signal appears (alert, email, push-notification). This allows you to open a position in a timely manner. Alpha Trend does not redraw, which makes it possible t

Hi there! Since I am starting commercial and non-commercial product publishing I would highly appreciate: If you like this product, please rate it. That will help to promote not only this product, but indirectly another ones. So, such promotion will help to make some money from commercial products. Thus, I will have opportunity to fund my another directions of trading researches like bot development using mql4 and mql5 programming languages as well as python written products like crypto bots. If

Volality 75 Fractal Scalper Non-repaint The arrows appear on the current candle. momentum and trend based strategy Works on all timeframes from the 1 Minute to the Monthly timeframe Bollinger bands have been added to show the trend direction whether its bullish or bearish Blue fractal arrow is your buy entry Orange fractal arrow is your sell entry you can use the Vix 75 fractal scalper in combination with other indicators.

Here is the boom and crash crazy Ma scalper a secretly coded color MA that is 1000% NON-REPAINT Works best on boom and crash 1000 Can be used on all timeframes from the 1 Minute timeframe to the Monthly timeframe The indicator is also a multi-time frame indicator you can select which timeframe to use The indicator is made for scalping purposes. as the trend changes the color of the indicator changes all well

Boom and Crash Buy and Sell Trend. Non-repaint. Can be used on all timeframes 1 minute for scalpers. 5 minute to monthly timeframe for swing trading. works on all boom and crash pairs Crash300, Crash500, Crash1000. Boom300, Boom500, Boom1000. Green histogram colour means the trend is up(bullish) Buy signal. Dark orange histogram colour means the trend is down(bearish) Sell signal.

BestPointOfInitiation是一个很好的短线交易指示器,能与 ShortBS ( https://www.mql5.com/zh/market/product/96796 )完美的配合,可以很好的指出最佳的buy和sell位置,指标不含有未来函数,不会重新绘制,不仅能够应用到自己的手动交易过程中,还能完全可以写入到自己的EA中。(如果你感觉到这个指标能够帮助你进行更准确的交易,请帮忙给个好评,希望我的作品能够帮助更多多有需要的人) ===================参数列表===================== fastPeriod: 9 slowPeriod:30 PassivationCoefficient:5 =================参考使用方法=================== 此指标可以适用于任何交易品种,能够用在任何周期。

This product is converted form Trading View of Kivanc Ozbilgic to be used on MT5 and below are descriptions of developer on Trading View:
Anıl Özekşi's latest development on his precious OTT - Optimized Trend Tracker:
In this version, there are two lines of OTT which are derived from HIGHEST price values (HOTT) and LOVEST price values (LOTT) which were originally sourced to CLOSE values on default OTT.
Another significant difference is there is no Support Line (Moving Average) in this ver

Ticks Candles Chart indicator build equi-volume candles and designed for Oracle Strategy The Period in ticks is set directly on the chart Tick chart opens in a separate window Recommended to use tick periods from 50 and above Works on real time only
Input Parameters Ticks_In_Bar - default period in ticks Counting_Bars - how many tick bars of history to build Custom_Symbol_Suffix - additional suffix for symbols

1. Why did I develop this series of indicators
I found that most traders need to use multiple time frame indicators. They usually switch time frame to see indicators. However, once the timeframe is switched, you cannot see the corresponding relationship between the price in the smaller timeframe and the indicator in the larger timeframe . For example: if your price chart is in H1 timeframe, you can see H4, D1 and W1 indicators in H1 timeframe Chart. This is more helpful for you to find t
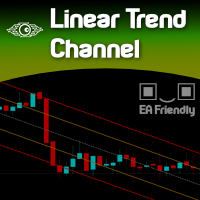
Imagine a way to automatically and clearly recognize the direction of the current market. Uptrend or Downtrend?
Forget about moving averages, there is a simple way to determine that. Welcome to the world of statistics. Welcome to the simple yet powerful world of Linear Regression. Just a complicated name for a genius and simple measurement.
Calibrating this indicator is pretty clear and obvious since the degree of freedom is total and deep.
Once calibrated to your desired Symbol/Asset,

MT5 Version Dashboard: Free scanner to monitor All pairs and timeframes. Please contact me after purchase, i will send it to you! MT4 version indicator: https://www.mql5.com/en/market/product/59127 Tip: This is an indicator for real-time signal display. When the indicator is loaded and running on the chart, the past signal cannot be displayed Market structure changes as price reverses And filter with all import features built inside one tool. Breaker's smart algorithm detects the reverses,

Indicator designed to give investors the advantage of identifying strong candlestick patterns in real time by staining candlesticks representing these patterns, using possible buy or sell performance. The color for each pattern identified by the parameter indicator according to your taste. The candlestick patterns identified by this indicator are: Inside Bar Closing Price Reverse Top (PFRA)
Closing Price Reverse Bottom (PFRB) Dave Landry Bullish Engulf Bearish Engulf Advantages: Real Time At ea

This indicator displays the wave structure of the market in the form several wave levels nested in each other. For each of these levels an automatic preliminary (draft) marking of waves in Elliott's style (123..., ABC... etc.) is created. This markup is completely automatic and absolutely univocal. The indicator is especially useful for beginner wave analysts, because among all the possible versions for wave marking, it allows you to immediately take the most adequate version as a ba

This is the Full Version, to get the free version please contact me.
The free version works on “AUDNZD” and “XAUUSD” charts.
All symbols and time frames scanner
Head and Shoulder
One of the most popular Price Action patterns is the Head and Shoulders pattern. The pattern has three local tops that resemble the left shoulder, head, and right shoulder. The head and shoulders chart pattern appears in all kinds of markets, including Forex, cryptocurrency, commodities, stocks, and bonds. The

This is the Full Version, to get the free version please contact me. The free version works on “GBPCHF” charts. All symbols and time frames scanner. Harmonic Pattern
Harmonic patterns are used in technical analysis that traders use to find trend reversals. They are considered one of the most accurate technical analysis tools, as they allow traders to predict the future price movement direction and the potential trend targets. Also, unlike many other technical tools, the number of false signal

本指标用于在图表上识别和标记 1-2-3 多头和空头形态。本指标可辅助确定交易的开始和分形信号,以及 МetaTrader 5 所有时间帧内的可能入场点。在图表上绘制的菲波纳奇线用来指示在波浪理论基础上价格移动的可能目标。 在价格顶部或底部形成 1-2-3 形态尤其重要,它的出现可作为离散 (聚合)。 本指标可以调整射线和菲波纳奇线的颜色。 本指标对于任何交易系统或模板都是一个极好的补充。
This indicator setup two Moving Average indicators and when the smaller Moving Average (2) crosses the larger one (1) , you will be notified by Popup alert, mobile notification, or Email.
If your strategy works with two Moving Average indicators, you do not need anymore to constantly and tediously look at the chart. You should just add this indicator to the chart according to your required settings, and whenever the defined cross (up or down) is done, it notifies you and you wouldn't miss the
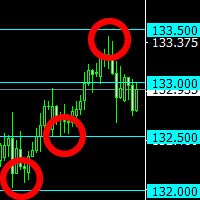
The indicator plots "round" levels, the step of which is specified in the settings. Perfect as an addition to any trading systems.
Very low price - only $30! Round levels often become price support or resistance. MT4 version: https://www.mql5.com/en/market/product/67245
This allows you to either fix a profit, or open a position after a breakdown of the level, work towards a rebound in price. Support: https://www.mql5.com/en/channels/TrendHunter The indicator will be an excellent tool in a
您知道为什么MetaTrader市场是出售交易策略和技术指标的最佳场所吗?不需要广告或软件保护,没有支付的麻烦。一切都在MetaTrader市场提供。
您错过了交易机会:
- 免费交易应用程序
- 8,000+信号可供复制
- 探索金融市场的经济新闻
注册
登录