适用于MetaTrader 5的付费技术指标 - 4

KT OBV Divergence shows the regular and hidden divergences build between the price and OBV - On Balance Volume oscillator.
Features
Unsymmetrical divergences are discarded for better accuracy and lesser clutter. Support trading strategies for trend reversal and trend continuation. Fully compatible and ready to embed in an Expert Advisor. Can be used for entries as well as for exits. All Metatrader alerts are available.
What is a Divergence exactly?
In the context of technical analysis, i

KT Coppock Curve is a modified version of the original Coppock curve published in Barron's Magazine by Edwin Coppock in 1962. The Coppock curve is a price momentum indicator used to identify the market's more prominent up and down movements.
Features
It comes with up & down arrows signifying the zero line crossovers in both directions. It uses a simplified color scheme to represent the Coppock curve in a better way. It comes with all kinds of Metatrader alerts.
Applications It can provide
The KT QQE Advanced is a modified version of the classic QQE oscillator to depict it more accurately using the colored histogram with fast and slow Trailing Line(TL).
Unlike the classic QQE, the KT QQE Advanced consists of a histogram with overbought/oversold levels.
Applications
Find quick buy/sell signals across all the timeframes using the MTF scanner. Find the trend direction more accurately. Detects overbought/oversold market. Shows the price momentum.
Inputs RSI Period Smooth Per

EA included, download here <---
Scalping strategy here <--- Trap Play refers to a market situation where price initially makes a new high or low, luring traders into believing a strong trend is forming. However, the price quickly reverses and invalidates the breakout, trapping those traders who entered positions based on the initial move. This sudden reversal often results in a rapid exit of positions, leading to significant price movement in the opposite direction. Trap plays can occur in

KT XMaster Formula is a buy & sell signal indicator that works magically on most of the timeframes and currency pairs when used correctly.
The indicator uses calculations based on moving averages, RSI, and MACD. It is usually appropriate for scalping and trend trading - whether you are a novice or an experienced trader, the signals generated by this indicator are simple to understand and implement.
Overview The indicator comprises green and red dots arranged in wavy lines. These dots corre

Divergence is one of the vital signals that depicts the upcoming price reversal in the market. KT Stoch Divergence shows the regular and hidden divergences build between the price and stochastic oscillator.
Limitations of KT Stoch Divergence
Using the Stochastic divergence as a standalone entry signal can be risky. Every divergence can't be interpreted as a strong reversal signal. For better results, try to combine it with price action and trend direction.
Features
Marks regular and hidde

The Crash and Boom VT indicator is a highly adaptable trading tool designed to operate across a wide range of market conditions, including Crash 300, Crash 500, Crash 1000, Boom 300, Boom 500, and Boom 1000. Engineered to blend Oversold (OS), Overbought (OB), and Macho periods, this advanced indicator generates reliable trading signals, especially when used on a 5-minute timeframe. For the best outcomes, it's recommended to set the Macho period between 4-5. While the indicator offers robust capa

Advanced Bollinger Bands Scanner is a multi symbol multi timeframe Bollinger bands dashboard that monitors and analyzes the Bollinger Bands indicator from one chart. This panel scans the Bollinger bands indicator in up to 28 configurable instruments and 9 timeframes for price overbought/oversold, price consolidation (Bollinger bands squeeze), and consolidation breakout (squeeze break) with a deep scan feature to scan all market watch symbols (up to 1000 instruments!).
Download Demo here

FXC iRSI-DivergencE MT5 指示符
這是一個高級RSI指標,可找到當前交易品種上的趨勢轉折差異。 該指標將RSI和價格走勢之間的背離檢測為強烈的趨勢轉變模式。
主要特點: 高級發散設置
價格基於收盤價,開盤價或最高價/最低價 發出買/賣開放信號
推送通知
郵件發送
彈出警報
可定制的信息面板
輸入參數: RSI Period: RSI指標的周期大小。
RSI Applied Price: RSI指標的適用價格。 可以是:關閉,打開,高,低,中位,典型,加權。
Symbol Applied Price: 當前符號的適用價格。 可以是:關閉,打開,低(B)/高(S)。
Minimum A-B Price Movements (pip): 確定差異的A點和B點之間的最小價格變動。
Minimum A-B RSI Movements (point): 確定散度的A點和B點之間的最小RSI值移動。
Minimum Bars Between A' and B' (bars): A點和B點之間允許的最小條形數量。
Maximum Bars Betw

** All Symbols x All Time frames scan just by pressing scanner button ** *** Contact me after purchase to send you instructions and add you in "Divergence group" for sharing or seeing experiences with other users. Introduction MACD divergence is a main technique used to determine trend reversing when it’s time to sell or buy because prices are likely to drop or pick in the charts. The MACD Divergence indicator can help you locate the top and bottom of the market. This indicator finds Regular div

Magic Histogram MT5 指标是一种通用工具,适用于剥头皮和中期交易。该指标使用创新公式,可让您确定趋势的方向和强度。 Magic Histogram MT5 没有重绘,因此您可以使用历史数据评估其效率。 它最适合 M15、M30、H1 和 H4。
指标优势 优秀的指标信号! 适合初学者和有经验的交易者。 使用灵活的指标设置,您可以根据您的交易风格调整指标。 适用于所有时间范围。 适用于任何金融工具。 不重绘/重绘。 向电子邮件和移动设备发送信号。
推荐符号 澳元兑美元、欧元兑美元、美元瑞郎、欧元兑日元、纽元兑美元。
推荐用法 买入信号:指标值已从负变为正。
A 卖出信号:指标值已由正变为负。
Magic Histogram 直接提供一个位置进入信号。因此,您只需要计算适当的止损和止盈值。
参数 Period - 指标计算周期(主要参数)。增加该值会减慢指标速度,从而提高信号质量并减少信号数量。降低价值更适合激进的交易者。 Alert - 启用或禁用警报。真 - 启用,假 - 禁用。 Email - 启用或禁用电子邮件通知。真 - 启用,

Best Scalper Oscillator is an indicator for MetaTrader 5 based on mathematical calculations on the price chart. This is one of the most common and useful indicators for finding the trend reversal points. Best Scalper Oscillator is equipped with multiple types of notification (push notifications, emails, alerts), which allows opening trades in time.
Distinctive features Generates minimum false signals. Excellent for identifying trend reversals. Perfect for scalping. Suitable for working on t

该指标在指定柱数的工作直方图上找到最大和最低价格量(市场概况)的水平。 复合型材 。 柱状图的高度是全自动的,并适应任何仪器和时间框架。 作者的算法被使用,并且不重复众所周知的类似物。 两个直方图的高度近似等于蜡烛的平均高度。 智能警报将帮助您了解有关交易量水平的价格。
概念Smart Money 。 Low Volume - Imbalance. 用于寻找良好的市场环境,确定市场结构并作为二元期权的过滤器。 它是价格的磁铁。 High Volume - Liquidity. 用于退出累积时的测试。
输入参数 。
基本 。 Bars Count - 要计数和显示的条数 。 Signal Fractal = 5 (对于颜色信号电平)。 水平将在以下条件下成为信号:顶部和底部有五个直方图不超过它 。 Min Candles For High Volume Level - 在水平蜡烛的最小数量,以便它可以成为一个信号 。
按钮设置 。 Visual Button - 按钮显示(启用/禁用) 。 Corner - 按钮的卡角 。 X indent - 以像素为单位的水平偏移

Trend Chief 是一种先进的指标算法,可以过滤掉市场噪音,确定趋势、入场点以及可能的出场水平。 使用较短的时间框架进行剥头皮交易,使用较高的时间框架进行波段交易。
Trend Chief 完美适用于所有 Metatrader 符号:货币、金属、加密货币、股票和指数
* 如何使用 Trend Chief 指标: - 通过查看每日和 H4 图表了解主要趋势 - 如果趋势向上,转到更小的时间框架,如 m15,等待价格移动到主绿线上方,然后再进行交易,所有其他线也必须是绿色。 - 如果趋势向下,转到更小的时间框架,如 m15,等待价格移动到主红线下方,然后再进行交易,所有其他线也必须是红色的。 - 线条颜色变化时退出交易
我的信号和其 他产品可以在这里找到

up down v6 for mt5 is no repaint all timeframe and all pairs indicator. red histogram cros trigger that is up point,and put a red point on histogram. and blue histogram cros trigger that is deep point.and put blue point on histogram. this indicator need to sometimes zoom out .for thise pres + button. if newly comes signal is too high makes before invisible.red and blue points are there.to see the signals. indicator is no repaint and can use all time frame and all pairs. only need minimum 500 bar

该指标从极值开始构建三周期信号和反转形态 123。信号出现在第二根蜡烛的开口处。 该形态可以通过不同方式(测试点 3、突破等)进行交易。退出通道或突破趋势线是寻找入场点的主要触发因素。 图标根据斐波那契水平着色。黄色图标表示对某一水平的测试,在该水平上信号会被放大。 使用多币种仪表盘,您可以跟踪 123 形态是在哪些货币对上发现的,以及有多少个条形图跟随该形态。 基于分形之字形。可重新绘制。因此,请在博客链接 - 123 Fractal Trading With UPD1 中研究该策略。
输入参数。
Bars Count – 显示历史记录。 Tooltip – 将鼠标悬停在对象上时是否显示工具提示。 Show Semaphore – 启用或禁用信号灯。 Show 123 – 启用或禁用显示 123 模式。
Period 1, 2, 3 - 信号周期。 Period 1, 2, 3 Visual – 启用或禁用单独周期的显示。
Arrow Coeff Period – 用于计算的条数。 Arrow Coeff – 平均烛台值

临界区( Critical Zones )是专为寻找更准确市场入口的手动交易者而设计的。该指标采用先进的算法,通过计算图表上最相关的支撑位和阻力位以及它们的突破和回测来检测感兴趣的区域。该指标可配置为在检测到潜在有利可图的买入/卖出机会时发送警报和通知,让交易者即使不在屏幕/ MT4 版本前 ,也能随时掌握交易机会。
价格将逐步提高,直至达到 300 美元。下一个价格--> 69 美元
功能特点
无重绘
当新数据到来时,该指标不会改变其数值。
交易货币对 所有外汇货币对 季节性 所有季节性
参数 ===== 支撑位和阻力位 配置 =====
用于计算的查看条形图 // 从当前条形图向后查看的条形图范围,用于计算支撑位和阻力位
===== 条件 =====
突破 // 打开或关闭突破检测
回测 // 启用或禁用回测检测
===== 支撑位和阻力位样式 =====
绘制类型 // 设置支撑线和阻力线的线型
支撑线颜色 // 设置支撑位的颜色
阻力位颜色 // 为阻力位定义颜色
===== 警报 =====

这个多时间框架和多品种指标识别双重或三重顶部/底部形态或随后的颈线突破(确认顶部/底部)。它提供 RSI、pin bar、吞没、镊子、早/晚星过滤器以及发散过滤器选项,可以仅过滤掉最强的设置。 该指标也可用于单一图表模式。请在产品的 博客 。 结合您自己的规则和技术,该指标将允许您创建(或增强)您自己的强大系统。 特征
可以同时监控您的市场报价窗口中可见的所有交易品种。将该指标仅应用于一张图表,并立即监控整个市场。 可以监控从 M1 到 MN 的每个时间范围,并在识别出第二个或第三个顶部/底部或颈线突破时向您发送实时警报。支持所有 Metatrader 原生警报类型。 可以使用 RSI,从不同的蜡烛形态和背离中进行选择,以正确识别潜在的逆转。 该指示器包括一个交互式面板。当单击一个项目时,将打开一个带有相关代码和时间范围的新图表。 该指标将信号写入文本文件,EA 交易系统 (EA) 也可以使用该文件进行自动交易。比如 这个产品 。
输入参数
输入参数的描述和解释可以在 这里 找到。 重要的 请注意,由于具有多功能性,既不会在安装指标的图表上绘制买卖建议,也不会绘制

该指标识别一种特殊类型的内线形态,由一根大主蜡烛和 4 根较小蜡烛形成(请参阅下面的策略说明)。 特征 在图表上绘制买入/卖出止损线以及止盈和止损水平。 TP/SL 水平基于平均真实范围 (ATR) 指标。 对象颜色是可变的。 当确定主蜡烛形成时向您发送实时警报 - 声音/弹出窗口/电子邮件/推送通知。 提出建议后,您可以通过自己的图表分析进行确认。通常,最好的交易设置是围绕重要支撑/阻力、整数、供需区域等发生的设置。 如果您想在多个图表上使用该指标,您可以考虑利用我的三角旗和三角形扫描仪中的内柱扫描,您可以找到 在这里 。 输入参数
内部蜡烛的数量 :为了获得最佳信号质量,建议将其设置为 4。请参阅下面的策略说明。 最大蜡烛线信号适用于 :此设置控制建议的入场线将扩展多长时间。 买入/卖出止损点的距离 :入场线的偏移量/缓冲区。建议主蜡烛高/低至少 5 个点。 以点为单位的最小主蜡烛尺寸 :请参阅下面的策略说明。 以点为单位的最大主蜡烛尺寸 :请参阅下面的策略说明。 等待蜡烛关闭 :真/假。默认值为真。如果设置为 False 那么警报将在 4 日 蜡烛打开。

To get access to MT4 version please click here . - This is the exact conversion from TradingView: "Hull Suite" By "Insilico". - This is a light-load processing and non-repaint indicator. - You can message in private chat for further changes you need. Here is the source code of a simple Expert Advisor operating based on signals from Hull Suite . #include <Trade\Trade.mqh> CTrade trade; int handle_hull= 0 ; input group "EA Setting" input int magic_number= 123456 ; //magic number input double fixe

A Heatmap with a Volume Profile is like a thermal imager or x-ray machine. It will help you to estimate the relative distribution of volume during the price movement and to understand the relationship between volume and price. Indicator Volume Profile "Volumos Maxima" is a powerful tool for analyzing this relationship. After simple experimentation with heatmap, you can find that each trading instrument has its own “ characteristic ” way of distributing volume. And this will help you to make a b

Supply or demand zones refer to price areas where a significant amount of supply or demand had previously entered the market, causing prices to either fall or rise. If the price returns to the demand or supply zone, it is likely to bounce off due to the large number of orders previously placed within the zone. These orders will be defended in these areas.
The Fair Value Gap (FVG) is a concept used to identify imbalances in the equilibrium of buying and selling. Fair Value Gaps are formed in a

50% off. Original price: $60 Triangle Finder is a multi symbol multi timeframe dashboard that finds symmetrical triangle pattern in 28 symbols and 9 timeframes with a deep scan feature to scan all market watch symbols (up to 1000 instruments!).
Download Demo here (Scans only M1, M5 and M10) Settings description here MT4 version here
Triangle Finder features: Realtime monitoring of 28 customizable instruments and 9 timeframes at the same time. Deep scan mode to scan all market watch sym

当识别出强劲趋势或趋势逆转时,此多时间框架和多品种趋势指标会发出警报。它可以通过选择使用移动平均线(单或双(MA 交叉))、RSI、布林带、ADX、综合指数(Constance M. Brown)、Awesome(比尔威廉姆斯)、MACD(信号线)来构建仪表板来实现)、Heiken Ashi 平滑、赫尔移动平均线、随机指标交叉、江恩 HiLo 激活器和交易者动态指数。它可以用于从 M1 到 MN 的所有时间范围。最大限度。仪表板中可以同时显示 9 个时间范围。仪表板中的颜色为绿色代表看涨,红色代表看跌,蓝色代表中性(指标值不在范围内)。 结合您自己的规则和技术,该指标将允许您创建(或增强)您自己的强大系统。 特征 指标可以将信号写入全局变量,智能交易系统可以使用这些变量进行自动交易 。 最多可以选择 9 个要使用的时间范围。 在仪表板内持续执行趋势强度排名排序。可以禁用此排序,以便更轻松地查找特定符号。然后,交易品种将按照它们在交易品种参数中输入的相同顺序显示,或者按照它们在市场报价窗口中显示的顺序显示。 通过在矩形内单击,将打开一个带有相关交易品种和时间范围的新图表。 将指标放在一张

** All Symbols x All Time frames scan just by pressing scanner button ** *** Contact me after the purchase to send you instructions and add you in "Order Block group" for sharing or seeing experiences with other users. Introduction: The central banks and financial institutions mainly drive the market, Order block is considered a market behavior that indicates accumulation of orders from banks and institutions, then the market tends to make a sharp move(Imbalance) on either side once

For those who love to trade using the Heikin Ashi Candlesticks, here it is one more powerful ally: Heikin Ashi Volume . This indicator is an exclusive idea and creation from us at Minions Labs for you. The idea behind this indicator is to have a visual cue over the Heiken Ashi candles pointing at those candles with big volume. For this to happen you can choose between 2 different techniques of identifying the "high" volume: Higher Volume above the last N previous bars average. Higher Volume segm

MT4版本 | Valable ZigZag指標 | FAQ 艾略特波浪理論是對金融市場過程的一種解釋,它基於價格圖表上波浪的視覺模型。 根據這個理論,我們可以確切地知道現在市場上盛行的趨勢是向上還是向下。 Valable ZigZag 指標 顯示了 市場的波浪結構 ,並指示了當前時間框架內當前主要趨勢的方向。 為方便起見,Trend Monitor VZ 指標將在圖表上顯示所有時間範圍的趨勢方向,以及您交易的整個貨幣對列表。 在一張圖表上全面了解所有工具的市場狀況,以做出正確的交易決策! Valable ZigZag 指標 非常穩定 ,不會像經典的 ZigZag 那樣經常改變方向,使交易者感到困惑。 這是通過使用分形來繪製指標的波浪來實現的。 Valable ZigZag 指標首先是一個趨勢指標 。 它設定了交易者應該交易的主要方向,Trend Monitor VZ 指標給出了當前市場正在發生的事情的總體思路。 例如: 如果 EURUSD 貨幣對的所有時間範圍內的指標都顯示向上箭頭,則表明上升趨勢已經確立。 現在入市為時已晚,因為很可能市場已經超過了足夠多的點,並且有

除了发现看涨和看跌的三线行权形态之外,这个多符号和多时间框架指标还可以扫描以下烛台模式(请参阅屏幕截图以了解模式的解释): 三白兵(反转>延续形态) 三只黑乌鸦(反转>延续形态) 当启用指标设置中的严格选项时,这些形态不会经常出现在较高的时间范围内。但是当他们这样做时,这是一个非常高概率的设置。根据 Thomas Bulkowski(国际知名作家和烛台模式的领先专家)的说法,三线罢工在所有烛台模式中的整体表现排名最高。结合您自己的规则和技术,该指标将允许您创建(或增强)您自己的强大系统。 特征 可以同时监控您的市场报价窗口中可见的所有交易品种。仅将指标应用于一张图表并立即监控整个市场。 可以监控从 M1 到 MN 的每个时间范围,并在识别出模式时向您发送实时警报。 支持所有警报类型 。 可以使用 RSI 作为趋势过滤器,以便正确识别潜在的逆转。 该指示器包括一个交互式面板。当单击一个项目时,将打开一个带有相关代码和时间范围的新图表。 该指标可以将信号写入文本文件,EA 交易程序 (EA) 可以使用该文件进行自动交易。比如 这个产品 。 您可以在博客中 找到有关文本文件的内容和位置的

RubdFx Perfect Reversal , The reversal indicator is used to determine areas of support and resistance by Drawing an arrow with a level of supply and demand ( ReversalZones ). - You will catch more swings by reducing the period, and less swings if you increase period - Mobile, computer and email alerts available . it is not pushed by price which means the arrow will stay in one place,suitable for scalping and long term trading Also Compatible with all forex paris , BUY RULES; open a buy positio

The Volume+ and VSA Signals indicator for MT5 is based on the Volume Spread Analysis (VSA) methodology to provide the signals. The signals are displayed at closing of bars on the main window or subwindow in the form of symbols. The symbols are not repainting. The indicator produces a signal on an individual bar and this signal is not buy or sell signal. When a minor trend goes in the opposite direction of a major trend, there are sequences of major trend-following signals that give a higher pro

Embrace the Power With Ultimate Trend Trader Indicator. Facing the reality of individual traders, we are far from harnessing the capabilities of AI and high-frequency trading algorithms that dominate today's markets. Without access to massive data centers or infrastructure to compete on microseconds, the battle seems skewed. Yet, the true advantage lies not in technological arms but in leveraging human intellect to outsmart the competition. The Ultimate Trend Trader Indicator embodies this appr

您准备好将您的交易提升到一个新的水平吗?隆重推出 WH Divergence Pro MT5 ,
先进的背离指标,让您可以从各种流行的技术指标中进行选择。
现在,您可以定制背离信号以匹配您独特的交易策略。 购买后联系我指导您完成整个过程 主要特征 :
指标选择 :从以下选项中选择您喜欢的指标: RSI(相对强度指数)。 很棒的振荡器。 CCI(商品通道指数)。 将添加更多指标。 精确信号 :根据您选择的指标,当出现背离或收敛时接收警报。 可定制的参数 :调整灵敏度、时间范围和其他设置以微调您的信号。 非重画 :信任准确的信号,无需担心重画。 怎么运行的 :
选择您的指标 :选择与您的交易风格产生共鸣的技术指标。 现货正常背离 :当所选指标和价格朝相反方向移动时,Divergence Pro 会检测到它。 现货隐藏背离 :当指标和价格朝同一方向移动时,Convergence Pro Plus 发出潜在回调的信号。
为什么使用 WH Divergence Pro MT5 ?
指标自由度 :选择与您的分析相符的工具。 微调 :自定义参数以匹配您的风险承受能

SMARTMASS INDICATOR
This indicator is different from all known volume indicators. It has a significant distinction; it is an algorithm that relates price movement to volume, attempting to find proportionality and efficient movement while filtering out noise and other movements that are more random and do not follow a trend or reversal. Ultimately, it reveals the true strength of the movement, indicating whether it has genuine support from bulls or bears or if it's merely a high-volume movemen

For MT4 version please send private message. - This is the exact conversion from TradingView source: "Hurst Cycle Channel Clone Oscillator" By "LazyBear". - For bar color option please send private message.
- This is a non-repaint and light processing load indicator. - Buffers and inputs are available for use in EAs and optimization purposes. - You can message in private chat for further changes you need.

To get access to MT4 version please click here . This is the exact conversion from TradingView: "Supertrend" by " KivancOzbilgic ". This is a light-load processing and non-repaint indicator. You can message in private chat for further changes you need. Here is the source code of a simple Expert Advisor operating based on signals from Supertrend . #include <Trade\Trade.mqh> CTrade trade; int handle_supertrend= 0 ; input group "EA Setting" input int magic_number= 123456 ; //magic number input dou

To get access to MT4 version please click here . This is the exact conversion from TradingView: "ZLSMA - Zero Lag LSMA" by "veryfid". This is a light-load processing indicator. This is a non-repaint indicator. Buffers are available for processing in EAs. All input fields are available. You can message in private chat for further changes you need. Thanks for downloading

If You Are Discretionary Trader This Tool Is A Must Chart Switcher ------> Linking Multi-Time Frame Charts / Syncing Indicators And Drawings. Main USP Of This Indicator: Is Opening Multi-Time Frame Multiple Charts {Up To 10 Charts} Of A Symbol With Just 1 Click. You Do not Have To Save Any Template As It has Been Save Auto When You Click Same Symbol Or Move To Another Symbol. It Is Divided Into 2 Parts: 1} COMMON MODE and 2} SYMBOL MODE 1} COMMON MODE: Under This Mode, You Can Sync Commo

Golden Star MT5 是由一群专业交易者开发的MT5平台专业趋势指标。 其工作算法基于原作者的方法,它允许以高概率找到潜在的趋势反转点,并在趋势形成之初接收信号进入市场。 该指标适用于外汇上的黄金、加密货币和货币对。 警报系统(警报、电子邮件和移动通知)将帮助您同时监控多个交易工具。 您只需要在图表上安装指标,当指标信号出现时,就会触发警报。 使用我们的警报系统,您绝不会错过开仓信号! 使用 Golden Star 指标进行交易非常简单:如果指标线为绿色,则我们建立买入头寸。 如果指标线为红色,则开一个卖出头寸。
通过购买该指标,您将获得: 优秀的指标信号。 免费产品支持。 定期更新。 以各种方式接收信号的能力:警报、电话、邮件。 可用于任何金融工具(外汇、差价合约、期权)和期间。 指标参数 Period indicator - 指标计算周期。 Alerts on? - 启用/禁用通知。如果为真 - 启用,假 - 禁用。 Display messageas - 启用/禁用警报。如果为真 - 启用,假 - 禁用。 Send emai l - 启用/禁用发送电子邮件

Cointegration Pair Trading Indicator
Indicator for statistical and quantitative pair trading strategies. You can perform Long&Short or Long&Long/Short&Short between two different assets.
The indicator performs a series of statistical tests between the assets and shows whether the pair is cointegrated or not.
Suggested Usage Strategies
(a) Verify if that the pair is cointegrated by the ADF test (Augmented Dickey-Fuller Test). 0% means the pair is not cointegrated; 90% 95% 97.5% and 99% means

***** This is an indicator for MT5 providing accurate arrow signals without repainting. ***** Trade With Sam Simple Strategy Guide : https://www.mql5.com/en/blogs/post/740855
MT4 version of the indicator
Try Out and see the Difference
The Sam's Trend Blaster indicator tracks the market trend with an unmatched reliability, by ignoring sudden fluctuations and market noise. It has been designed to trend-trade intraday charts and small timeframes. Its winning ratio is around 85%. This is a

Defining Range ( DR ) and Implied Defining Range ( IDR ) indicator Pro with added features from free version
Show DR and IDR ranges Sessions on the chart for RDR Regular defining range (New York Session)
ADR After defining range (Asian session) ODR Outside defining range (London Session)
Buttons on chart to enable / disable :
Show Imbalance ( IMB ) Show Volume Imbalance ( VIB ) Show Gap's between open and close
Show Standard Deviation ( SD )
Show last 3 Sessions

This is advanced Multi-Symbol and Multi-Timeframe version of the "Candle Pattern Finder" indicator (search for candlestick patterns based on the book by Gregory L. Morris "Candlesticks charting explained. Timeless techniques for trading stocks and futures" ). The indicator searches for candlestick patterns for ALL symbols of the "Market Watch" window and for ALL standard timeframes from M1 to MN1. When patterns appear on any symbol / timeframe, the indicator gives a signal (text, sound, sending

描述 :
“市场结构 HH HL LH LL”指标是分析金融市场价格动态的强大且简单的工具。该指标帮助交易者和投资者识别趋势变化并识别价格时间序列中的重要点。
该指标的关键组成部分:
HH(较高高点):价格收盘高于前一个高点的顶部。 HH 表明上升趋势加强。 HL(较高低点):价格收盘高于前一个低点的最低值。 HL确认了上升趋势的延续。 LH(较低高点):价格收盘低于前一个高点的顶部。 LH 预示着趋势可能逆转。 LL(较低低点):价格收盘低于前一个低点的最低值。 LL 确认下降趋势的开始。
如何使用:
“市场结构HH HL LH LL”指标帮助交易者和投资者确定市场的当前趋势。上升趋势以 HH 和 HL 序列为特征,下降趋势以 LH 和 LL 序列为特征。当趋势发生变化时,它可以作为在市场上开仓或平仓的信号。
使用示例:
假设您持有一只股票的多头头寸,并且指标显示 LH 和 LL 序列,表明下降趋势可能开始。这可能是平仓或设置止损限额的信号。
下图显示了下降趋势的示例以及该趋势被突破的示例。

Exclusive Arrival: Presenting for the First Time . This is your secret weapon for predicting which way the wind will blow with the next market shift. It assists you in developing your trading strategy by predicting the direction of the next candle. Compatible with forex, stocks, and cryptocurrencies on all timeframes, but higher timeframes are recommended. MT4 Version - https://www.mql5.com/en/market/product/108931/ How does it work ? It's pretty neat. The algorithm separates green and red ca

多货币和多时间框架指标 MACD。 仪表板可以显示传统(真实)MACD 和 MetaTrader 中内置的 MACD。
在面板上,您可以看到指标的当前状态 - MACD 线的移动方向、它们的交点以及带有指标图表的弹出窗口。 在参数中,您可以指定任何所需的交易品种和时间范围。 扫描仪还可以发送有关线相互交叉以及线穿过零电平的通知。 通过单击单元格,将打开给定的符号和句点。
因此,您可以轻松扫描所有时间范围的所有货币对和交易品种,以找到 MACD 主线和信号线或零水平的交叉点。
显示/隐藏仪表板的热键默认为“D”。 默认情况下,启用/禁用弹出图表的热键为“C”。 用于切换图表“1”和“2”上的箭头的热键。 MACD(移动平均收敛/发散)指标(或“振荡指标”)是根据历史价格数据(最常见的是收盘价)计算得出的三个时间序列的集合。 这三个系列是:MACD 系列本身、“信号”或“平均”系列以及“背离”系列(两者之间的区别)。 MACD 系列是价格系列的“快速”(短期)指数移动平均线 (EMA) 和“慢速”(较长周期)EMA 之间的差异。 平均数系列是 MACD 系列本身的 EMA。

** All Symbols x All Time frames scan just by pressing scanner button ** *** Contact me after the purchase to send you instructions and add you in "Harmonic Scanner group" for sharing or seeing experiences with other users. Introduction Harmonic Patterns are best used to predict turning point. Harmonic Patterns give you high win rate and high opportunities for trade in during one day. This indicator detects the best and successful patterns based on Harmonic Trading concepts . The Harmonic Patt

Imbalance / Fair Value Gap (FVG) , this is a zone / gap created when the price move with force in a given direction. It identify a zone where the price could potentially go back. This gives perfect targets for your trades.
Imbalance is created from the high and low of 3 candles. When the wicks the of 1st and 3rd candle does not fully overlap the middle one.
This indicator will help you to easily spot mitigated/unmitigated imbalances in your chart. NEW UPDATE: Added Multi-Timeframe feature

Pack Volatility 75 1/3 In this indicator stage 1 I am pleased to present you the volatility 75 Buy/Sell Professional indicator. where in each temporary structure it will mark a sale and a safe purchase to operate manually, where the strategy is based on the lines EMA of 7 exponential periods and the EMA of 50 exponential periods. where purchasing a product comes 2 as a gift (it's the pack) purchasing any of the 3 products will be sent the remaining indicators, to be able to apply the strategy we

"TPA Sessions" indicator is a very important tool to complement "TPA True Price Action" indicator . Did you ever wonder, why many times the price on your chart suddently turns on a position you can't explain? A position, where apparently no support or resistance level, or a pivot point, or a fibonacci level is to identify? Attention!!! The first run of the TPA Session indicator must be in the open market for the lines to be drawn correctly.
Please visit our blog to study actual trades wit

uGenesys AI - 90% Accurate Daytrading Indicator
Introducing the ultimate forex trading indicator system, uGenesys AI, powered by cutting-edge AI technology and advanced analytical techniques, including Time-Series Analysis and Genetic Algorithms. Our AI-powered trading system leverages the power of time-series analysis to identify trends and patterns in historical price data, allowing traders to make informed predictions about future market movements. By analyzing vast amounts of data, our sys

多货币和多时间框架 Heikin Ashi 指标。 显示了当前的市场状况。 在扫描仪面板上,您可以看到当前趋势的方向、强度和条形数量。 盘整/反转蜡烛也用颜色显示。 您可以在参数中指定任何所需的货币和期间。 此外,当趋势发生变化或出现反转和盘整蜡烛(十字星)时,指标可以发送通知。 通过单击单元格,将打开该符号和句点。 这是 MTF 扫描仪。 Heikin-Ashi 是日本的交易指标和金融图表,意思是“平均速度”。 Heikin-Ashi 图表类似于烛台图,但具有更平滑的外观,因为它们跟踪一系列价格变动,而不是像烛台那样跟踪每个价格变动。 Heikin-Ashi 由 Munehisa Homma 在 1700 年代创建,他还创建了烛台图。 交易者和投资者使用这些图表来帮助确定和预测价格变动。
参数 Averaging Method for Smoothing — 选择平滑蜡烛价格的方法。 — Simple MA — 简单 MA
— Exponential MA — 指数 MA
— Smoothed MA — 平滑 MA
— Linear weighted MA — 线性加权

Welcome to Propsense, the best solution for new and veteran traders with a simple FREE strategy! NEW to MT5! This indicator is a unique and affordable trading tool built on the teachings of a former bank trader. With this tool, you will be able to see inefficient points with ease. Additionally, traders will have a clean Heads Up Display which will show your running and closed P/L in pips AND currency units. As a highly requested option, a candle timer has been added which will allow you to j

Dark Sprint is an Indicator for intraday trading. This Indicator is based on Trend Following strategy, also adopting the use of the atr to determine the right volatility. We can enter in good price with this Indicator, in order to follow the strong impulse on the current instrument.
Key benefits
Easily visible sprint lines Intuitive directional arrows Automated adjustment for each timeframe and instrument Easy to use even for beginners Never repaints, never backpaints, Not Lag 100% compati

相对强弱指数 (RSI) 指标的多货币和多时间框架修改。 您可以在参数中指定任何所需的货币和时间范围。 此外,该面板还可以在跨越超买和超卖水平时发送通知。 通过单击带有句点的单元格,将打开该符号和句点。 这是 MTF 扫描仪。
默认情况下,从图表中隐藏仪表板的键是“D”。
与货币强弱计类似,仪表板可以自动选择包含指定货币的货币对或以该货币为基础的货币对。 该指标还将在单独的行上计算该货币的 RSI。
参数 RSI Period — 平均周期。 RSI Applied price — 价格类型。 Clear the chart at startup — 启动时清除图表。 Set of Pairs — 符号集 — Market Watch — 来自“市场观察”的配对。 — Specified manually — 在参数“Pairs”中手动指定对。 — Current pair — 仅显示当前对。 Pairs (separated by a space or semicolon) — 由空格或分号分隔的符号列表。 货币名称的书写方式应与经纪商的名称完全相同,并保留大小

这是一个交易时段指标,可以显示四个交易时段的所有级别(开盘价-最高价-最低价-收盘价)。 该指标还可以预测会话级别。 会话可以用线条或矩形(空的或填充的)绘制,线条可以延伸到下一个会话。 您可以通过按热键(默认为“1”、“2”、“3”、“4”)轻松隐藏/显示每个会话。
您可以看到 ASR(平均会话范围)线(默认热键“A”) 。 这与 ADR 计算类似,只是它是根据最后一个 X 交易时段计算的,这使您可以看到当前(和之前)交易时段的潜在范围(今天价格可以移动多远)。 平均值的计算方式为之前会话的总和除以会话数(参数“ASR 周期(计算平均值的会话数)”),每个会话都有自己的 ASR 值。
该指标计算并绘制未来的会话及其大小。 正确识别报价历史记录中的漏洞。 它还可以在每个会话开始时绘制垂直分隔符。
指标自动确定图表的配色方案。
当价格触及会话水平或价格突破已关闭会话指定距离时,它还会发送警报。 可以禁用每个会话的警报。
参数“如果其他会话启动则停止会话”(热键“S”)允许您停止过时的会话,并在新会话中断时接收警报。
该指标可以绘制枢轴水平并就其发送警报。 这

BeST_ Elliot Wave Oscillator Strategies is an MT5 indicator which by default is the difference of two SMAs displayed as a histogram fluctuating around zero while a Signal Line generates Entry Signals either in a Reverse or in a Normal Mode and it is a very powerful tool that very often exploits huge market movements.
Signal Line comes in 2 types:
Advanced Get Type – like the corresponding one used in the homonym analysis package Mov. Average Type – as a Moving Average of the Elliot Oscillat

The Average Price indicator calculates the average prices of BUY (LONG) and SELL (SHORT) open positions, taking into account the size of open positions, commissions and swaps.
The indicator builds the average line of LONG open positions, after crossing which, from the bottom up, the total profit for all LONG positions for the current instrument becomes greater than 0.
The indicator builds the average line of SHORT open positions, after crossing which, from top to bottom, the total profit f

正在寻找一个强大的指标来让您的交易更上一层楼? 看看我们独特的基于 RSI 的指标,它结合了 MQL5中最好的相对强度指数 (RSI)、移动平均线和 Heiken-Ashi 指标。
我们的指标提供无任何滞后的实时数据,让您自信地做出明智的交易决策。 它非常适合所有级别的交易者,从初学者到专家。
通过可自定义的设置和参数,您可以轻松地根据您的交易风格和偏好调整指标。 无论您是日内交易者还是长线投资者,我们基于 RSI 的指标都可以帮助您识别趋势反转并最大化您的利润。
我们技术娴熟的开发人员团队孜孜不倦地创建了一个提供无与伦比的准确性和性能的指标。 通过结合 RSI、移动平均线和 Heiken-Ashi 指标,我们为希望保持领先地位的交易者创建了一个真正的强大工具。
它是 RSI、移动平均线和 Heiken-Ashi 指标的强大组合,没有它您就不想交易。
100% 不重涂 100% 无延迟

這是一個基於燭台價格行為的機械設計指標。 它適用於任何給定的交易工具,每當產生買入或賣出衝動時都會發出警報,但是有一個視頻和解釋文件用於驗證信號,還提供入場和出場技術。 在 youtube benjc trade Advisor 上搜尋並找到該產品的解釋影片。
最新版本具有趨勢和振盪器約束功能,可過濾訊號並使其更加準確。 它還呼籲提高無限使用和租賃產品的價格。
未來的升級將要求價格上漲。
該系統使您在訊號產生後立即進行交易。 優點是執行交易時系統訊號遭受的回撤較少。 當設定無效時,損失非常嚴重。
目的是減少您的眼睛疲勞,因為計算機會為您觀看圖表,並在設定準備就緒時向您發出警報。 它還支援推播通知,以便即使在遠端情況下也可以向您的手機電錶 ID 提供訊號,此時電腦必須在線且指示器運行。
最終該指標可以無限使用。 我建議在狙擊手進入的較小時間範圍內使用該指標,也可以降低風險的大小。
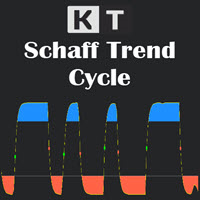
The Schaff Trend Cycle (STC) is a technical analysis tool that helps traders and investors plot highly-probable predictions on the price direction of an instrument. Due to its predictive properties, It's a good tool for foreign exchange (forex) traders to plot buy and sell signals. The Schaff Trend Cycle was developed by prominent forex trader and analyst Doug Schaff in 1999. The idea driving the STC is the proven narrative that market trends rise or fall in cyclical patterns across all time fr
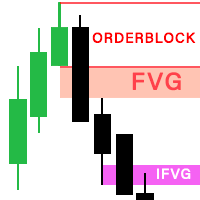
The latest version 2.0 of the FVG Indicator is fully integrated into an all-in-one package, including: Fair Value Gaps (FVG). See more => How to trade with FVG Implied Fair Value Gap (IFVG). See more => How to trade with IFVG OrderBlock (OB). See more => How to trade with OrderBlock The options in the settings section are relatively easy to navigate, and you can even use them right away upon activation without encountering difficulties when using the default configuration. The indicator utilize

An indicator for making all time frames Easily create any time frame you want. From one minute to 10,000 minutes Applicable in all symbols, markets and ... Just run this indicator in the time frame "one minute" (in the desired symbol) Select the desired timeframe settings and then run the indicator You can also choose the color of the candlesticks yourself
Features of this indicator:
Applicable to all symbols
Can be used in all time frames (it is better to run in 1 minute time frame)

VSA目标 该指标使用Vsa(成交量点差分析)系统在图表上识别专业买家或专业卖家,并建立相对于这些柱(烛台)的趋势支撑区,以及目标水平。 特征: 1. 在该指标中,您可以选择一种模式,其中只有专业买家或专业卖家将被确定,并且两个专业参与者将在同一时间被确定。 2. 您可以在符号上设置任何时间帧来确定支持区域和目标水平。 交易时,设置更大的时间框架来确定支撑区域和目标水平,并且交易本身可以在更小的时间框架上进行,以便更准确地进入交易。 3. 在指标设置中,如果使用分时交易量,您可以选择分时交易量,如果使用实际交易量,则可以选择实际交易量。 4. 在确定大型卖家或买家时,您可以手动选择该卷的卷大小和搜索期。 5. 可用于创建专家。 资料描述: 绿色虚线是买方的支持区。 绿色实线(粗线)(TP1,TP2)是您需要平仓的目标价位。 红色虚线是卖家的支持区域。 红色实线(粗线)(TP1,TP2)是您需要平仓的目标价位。
开设购买仓位的建议 在绿色条纹(专业买家)出现后,形成客户支持区。 在此区域中,您可以以最小的风险进行购买交易,前提是销售柱的点差很小。 止损位于买方支持区域下方。

KT Higher High Lower Low marks the following swing points with their respective S/R levels: Higher High: The swing high made by the price that is higher than the previous high. Lower High: The swing high made by the price that is lower than the previous high. Lower Low: The swing low made by the price that is lower than the previous low. Higher Low: The swing low made by the price that is higher than the previous low.
Features The intensity of swing high and swing low can be adjusted by cha

Description Helps you detect the structure of the market, using different types of Smart Money concepts. This should help you to upgrade your trading strategy in every way. Smart Money Features: Color candle to signal the type of structure Shows CHOCH and BOS Equal Lows and Highs Order Blocks Internal and Swings Weak and strongs high and lows Fair Value Gaps High and Lows in daily weekly and monthly timeframes Premium and discount Zones KEY LINKS: How to Install – Frequent Questions - All

KT Volume Profile shows the volume accumulation data as a histogram on the y-axis providing an ability to find out the trading activity over specified time periods and price levels.
Point of Control (POC) in a Volume Profile
POC represents a price level that coincides with the highest traded volume within the whole volume profile histogram. POC is mostly used as a support/resistance or as an essential price level where market retest before going in a specific direction.
Features Very easy

GG TrendBar Indicator - Your Multitimeframe ADX Trading Solution Experience the power of multi-timeframe trading with the "GG TrendBar MT5 Indicator." This versatile tool, built upon the ADX indicator, offers precise insights by considering multiple timeframes, ensuring you make well-informed trading decisions. Basic Details : Indicator Type : GG TrendBar Indicator (Multi-Timeframe ADX) Key Metrics : Real-time ADX analysis across multiple timeframes. Customization : Enable or disable specific ti

Fair Value Gap (FVG) Indicator: Master the ICT Method in Forex Trading
What Traders Are Saying: " Transformed my trading approach with its precise gap spotting ..." – J. Doe " The alert feature is a lifesaver, never miss a trading opportunity.. ." – Alex P. " A crucial tool for anyone following the ICT methodologies in Forex. .." – Samantha R. Unlock the secrets of price movement in the Forex market with the revolutionary Fair Value Gap (FVG) Indicator. Designed for precision and ease of use,

KT Bollinger Bands Alert is a modified version of the classic Bollinger Bands added with price touch alerts and visible price tags for each band separately.
Alert Events
When the current price touches the upper Bollinger band. When the current price touches the middle Bollinger band. When the current price touches the lower Bollinger band.
Features Separate alert events for each band. Ability to specify a custom interval between each alert to prevent repetitive and annoying alerts. Added
MetaTrader市场是独有的自动交易和技术指标商店。
阅读MQL5.community用户备忘更多地了解我们提供给交易者的独特的服务:复制交易信号,自由职业者开发的自定义应用程序,通过支付系统完成的自动付款和MQL5云网络。
您错过了交易机会:
- 免费交易应用程序
- 8,000+信号可供复制
- 探索金融市场的经济新闻
注册
登录