适用于MetaTrader 5的付费技术指标 - 30
Tracker Candle Signal est un indicateur simple et pratique, capable de déterminer le mouvement des acheteurs et vendeurs, A savoir, qui aura le dessus à la fin de la chaque bougie en fonction de l'unité de temps choisi. Il est très précis sur les grandes unités de temps 1H, 4H, Daily. En effet, je l'utilises en daily pour comprendre le comportement du marché puis en 1H pour prendre position. Surtout n'hesitez pas à me faire un retour après utilisation.
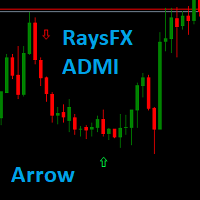
RaysFX (Average Directional Movement Index) to → ARROW
Technical indicator (ADX) helps to determine the market trend. It was developed and described in detail by Welles Wilder.
The simplest trading method based on the system of directional movement implies comparison of two direction indicators: the 14-period +DI one and the 14-period -DI.
To do this, one either puts the charts of indicators one on top of the other, or +DI is subtracted from -DI.
W. Wilder recommends buying whenever the +DI
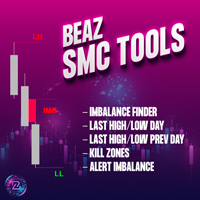
This indicator is an analysis tool for the smart money concept. It displays inducement imbalance, the line of the day, the last highs and lows of the day as well as those of the previous day. The options are customizable as desired, color, size, line type and visibility. It is possible to deactivate each option according to your way of working in order to keep your graph clean.

This MT5 indicator has been designed to be used on any currency pair and any time frame . It has the scalper and swing trader in mind. The indicator looks for short-term high-probability reversals in price and will indicate to you to go long (buy) or short (sell) if you see a green or red arrow next to the current candlestick respectively. The indicator provides the best trading opportunities to you during the active trading hours of London and New York, but it will continue to give signals al

This MT5 indicator has been designed to be used on any currency pair or indices and on the daily time frame or higher . The indicator looks for medium-term high-probability continuations in price and will indicate you to go long (buy) or short (sell) if you see a green or red arrow next to the current candlestick respectively. The indicator paints an arrow when the specific criteria are met, however, you must wait until the current candlestick has closed until you enter a trade . Therefore you w

This MT5 indicator has been designed to be used on any currency pair, but not indices, on the ONE HOUR time frame only . This indicator has the highest win rate of all my indicators but it is not perfect and there is no holy grail in trading. The indicator looks for short-term high-probability trend continuations in price and will indicate you to go long (buy) or short (sell) if you see a green or red arrow next to the current candlestick respectively. The indicator paints an arrow when the spe
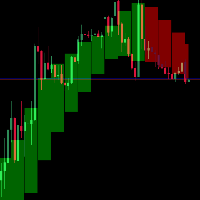
Anyone who is experienced in trading knows that longer time signals are trend signals. That's why it's always good to follow the trends of longer times to make a good trade.
With that in mind, I created the trend indicator in the background
Indicator Parameters TFBar - TimeFrame BackgroundEnabled - Enable Background NumbersOfBars - Numbers of Bar draw ColorUp - Color Up ColorDown - Color Down Smoothing - Heiken-Ashi Smoothing Average inpMA_METHOD - Smoothing Method width - Size Line bor

Ichimoku Genius (imG)
is a very Intelligent Indicator for the Perfect Entry & Exit. This is strongly recommended to: Check the Video properly to understand the Indicator setup, how does it work and exactly how to take Entries and Exit according to this Indicator. Please use this Indicator with "Pivot Points" & "Kijun-Sen" to get the Best result. Always give preference to Long Flat area of "KIJUN SEN" Line as this is act like a strong Support -or- Resistance.
Steps to Setup the Indicator: I

This Indicator help you to identify trends and patterns. It shows the short-term, medium-term and long-term trend at the same time on the screen. It supports every timeframe except monthly. This indicator NOT implement the ZigZag indicator, but it uses its own algorithm.
Supported markets: - Forex - Metal - Energies Spot - in Energies Futures only o US Crude Oils - in Indices Spot only o US Tech 100 Index o UK 100 Index o US Wall Street 30 I
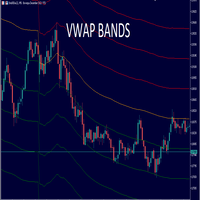
Este indicador contém 6 desvios, ótimo para ativos de alta volatilidade, podendo alterar as cores dos desvios como a largura da linha.
VWAP (Volume Weighted Average Price) nada mais é do que uma média móvel ponderada pelo volume das negociações de um ativo. Esse indicador é um dos mais utilizados pelos grandes investidores – na sua maioria institucionais –, pois permite ampla visualização da liquidez e dos pontos de interesse do ativo em análise. O volume é um dos elementos m
Interval Breakout (IB)
is a Breakout Indicator Mixing with Time Interval.
We can set a Particular Time and Support / Resistance Line Length for a Breakout Scanning. This is strongly recommended to: Check the Video properly to understand the Indicator setup, how does it work and exactly how to take Entries and Exit according to this Indicator. Give preference to Support / Resistance zone to get rid of False signal.
Steps to Setup the Indicator: Install the Custom Indicator; Set all the
The Black Swan Trading Panel was designed and built to make trading as easy as possible. Track any trading instruments with multiple time frames on one chart and thus have a complete overview of the market situation. The Black Swan Trading Panel uses three custom indicators that will give you a clear overview of the market situation regarding trend, price deviations and support/resistance zones. This indicator is highly customizable and therefore suitable for every type of trading. With this too

The Mathematical Trader is a new addition to my highly profitable indicator products. It can be used for scalping or catch the beginning of mid-term strong trends . This is an MT5 indicator only that utilises several mathematical formulations and has been designed to run on any instrument and any time frame less than the daily time frame . The lower the timeframe the more frequent the signals. The indicator will signal to you to go long (buy) or short (sell) if you see a green or red arrow next

To download MT4 version please click here . This is the exact conversion from TradingView: "WaveTrend [LazyBear]" By "zeusuk3". One of the coolest indicators out there to detect overbought and oversold zones. It can be used as a part of more complicated strategy and for confirming a potential trade setup. There are buffers to use in EAs also. The indicator is loaded light and non-repaint. - You can message in private chat for further changes you need. Thanks for downloading

Neural Bands is a scalping indicator. There are 2 different deviation bands for oversold and overbought levels. Color candles are to determine the trend if it passes the deviations and is showing a strong trend or if the color candles stop at the deviations and revert back to the mean. This indicator is a type of regression indicator trading ranges and breakouts in price. 15 min charts and above recommended. TRADE WITH THE LARGER TREND DIRECTION

Hello ! If you scroll in one chart, all charts will be scrolled If you change the time frame in one chart, it will change in all charts Of course, you can turn this feature on or off All the charts in which you want changes to be applied are specified through ID in the indicator settings You can scroll the charts of different time frames in two ways at the same time 1: Coordinated based on time That is, 1 hour candle is 60 candles one minute back 2: scroll in the form of number of candles That i
This indicator will mirror the assets in use in another Metatrader, being able to choose the timeframe and a template. This is the Metatrader 5 Server, it can work with Metatrader 4 or 5 Client versions: Metatrader 4 Mirror Chart Client: https://www.mql5.com/en/market/product/88649
Metatrader 5 Mirror Chart Client: https://www.mql5.com/en/market/product/88650 Details of how it works in the video.
This is 3 pre-filtered CCI, Commodity Channel Index, indicators pre-filtered by your choice of 3 Smoothing and/or Averaging methods. I have found certain settings to be very reliable and I plan to incorporate this into an Expert Advisor in the future. I have added a new form of Averaging: Smoothed TEMA, or Triple Smoothed EMA, Exponential Moving Average. It gives less noise than the TEMA, but provides the smoothing of the Double Smoothed EMA, so it should be a slight bit quicker. PLEASE Download
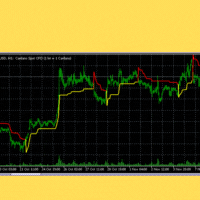
Supertrend 是一種相對不受歡迎的技術指標,如上所述,由 Olivier Sebam 開發,旨在幫助交易者識別趨勢並了解何時買賣金融資產。該指標在 TradingView 和 MetaTrader 中未作為默認設置。不過,您仍然可以在市場上找到定制的 Supertrend 指標。
當應用於圖表時,超級趨勢指標以其兩種顏色可見。雖然它們可以更改,但默認顏色通常是紅色和綠色。當它是綠色時,是買入資產的信號,當它是紅色時,是賣出資產的信號。
超級趨勢指標適用於所有時間線。它可以在較短的時間範圍內工作,如 5 分鐘或更長的圖表,如每日和每週圖表。
識別買賣信號 如上所示,買入和賣出信號在超級趨勢指標中得到了很好的標記。當價格高於指標的綠色部分時,會出現買入信號。
另一方面,當它移動到指標的紅色部分下方時,就會看到賣出信號。但是,進行多時間框架分析將幫助您確定最佳支撐位和阻力位。
超級趨勢指標的優缺點 超級趨勢指標的優點包括:
易於解釋:即使對於初學者來說,計算也不是很複雜。 預測相當準確:在超級趨勢是可用的最可靠指標之一的趨勢市場中尤其如此。 易於

TransitBlueOcean is indicator system that uses ocean wave's pattern, to help one to know when to buy and when to sell. The indicator system is very powerful like the ocean waves. Join the mql5 channel for TransitBlueOcean https://www.mql5.com/en/channels/transitblueocean How to use: Zoom in so that the Ocean will appear on your chart.
Buy when you see the candles, the candle will be above the ocean wave (buying signal).
Sell when you can't see the candles, the candles will be inside the w
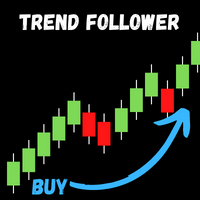
Trend Follower predicts the possible start of a trend, the indicator uses as a basis for the closing high possibility of the indicators to identify a possible entry or low possibility, the indicator just an entry parameter which can be the period .
Input parameters Period : A positive integer that indicates the period for number
Alert: Sends an audible signal when a signal occurs
Check out other products: https://www.mql5.com/en/users/junioredj16/seller
300 downloads without review ? !!!!
If continued. I will not share any product for free. :( Small and very simple timer next to the current price to show the end time of the current candle
Very useful and important for scalpers and those who work on price action.
We assure you that we welcome any suggestions to improve this indicator and make the necessary changes to improve this indicator.
You can contact us via Instagram, Telegram, WhatsApp, email or here. We are ready to answer you.

Robotizz Indicator is a powerful trading indicator using price action and moving averages. Robotizz indicares with arrows on long trades ir short trades, showing some TP and SL points too. It works with any symbol, even on forex markets or B3 Brazilian markets. You can configure moving averages periods, besides simple or exponential moving averages. Also it is possible to configure arrow position. Try Robotizz for one month and take a boost on your manual trades.

* Corrected and accelerated zigzag. (You can change the range) * The zigzag is updated with each new candle/bar. * If you want, by activating the button, only when you click the button, it searches for a pattern. If you do it automatically, it searches every time the chart is refreshed. * 17 frequently used harmonic patterns and a special pattern that you can define your own proportions. * You can keep the chart simple with the price display. You can make a triangle representation if you want. *
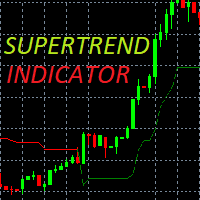
A super-trend indicator is plotted on either above or below the closing price to signal a buy or sell. The indicator changes colour, based on whether or not you should be buying. If the super-trend indicator moves below the closing price, the indicator turns green, and it signals an entry point or points to buy. If a super-trend closes above, then the indicator shows a sell signal in red. You will also note that at the point where buy or sell signal is generated is the crossover point. At the p
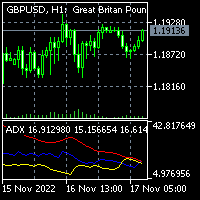
This is a two in one indicator implementation of Average Directional Index based on heiken ashi and normal candles. Normal candles and Heiken Ashi is selectable via input tab. The other inputs are ADX smoothing and DI length. This indicator lets you read the buffers: +di: buffer 6 -di: buffer 7 -adx: buffer 10 Note: This is a non-repaint indicator with light load processing. - You can message in private chat for further changes you need.
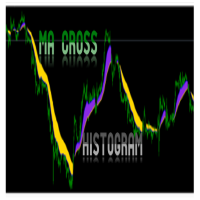
MA Histogram is MT5 Indicator for beginners which plot a histogram after Moving Average Crossover of 2 MAs. The Indicator does not have arrow or alert. It will simply plot on chart the potential Up and Down trend when trend is beginning or ending. It will show a Blue color for potential up trend and Gold color for potential down trend. Recommended Pairs: ALL Pairs including Indices for MT5 FOREX BROKERS Recommended Pairs On Deriv: BOOM 1000, Boom 500, Boom 300 and CRASH 1000, Crash 500, Cra
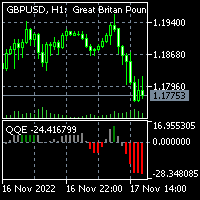
To download MT4 version please click here . - This is the exact conversion from TradingView: "QQE mod" By "Mihkel00". - It can be used to detect trend direction and trend strength. - Gray bars represent weak trends. You can set thresholds to achieve better accuracy in detecting trend strength. - There is buffer index 15 to use in EA for optimization purposes. - The indicator is loaded light and non-repaint. - You can message in private chat for further changes you need.

- This is an implementation of OCC ==> open close cross - This indicator applies twelve different averaging methods to open and close prices separately to signal the trend switching. - All MA methods are set as input as well as period and different offsets applied to linear regression and ALMA averaging. - Buffers 16 and 17 can be used in EAs to detect trend direction. - You can message in private chat for further changes you need.
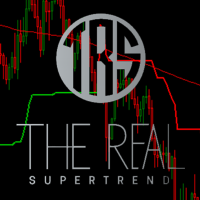
The Legendary Super Trend Indicator Now at Savings Price!!!!!
My Supertrend indicator gives them clear entry and exit signals.
The indicator is volatility-based and is in its function rather a trend-following indicator.
Through the ATR indicator, which is integrated in the calculation of the Supertrend, price gaps are also calculated and not overlooked. Thus, more accurate values can be calculated.
When measuring volatility, the average value of the current price serves as a basis.

A Metatrade 5 technical Indicator made of the best trading strategy, very easy to use and to understand. Providing good and reliable signals for scalping and swing trading. Always killing the shower on any pair , whether currency’s, stock’s, index, community , Deriv synthetics and many more. TransitKiller is a very useful technical indicator system, that analyze the market using a unique technical strategy so that it can give accurate signal’s for buying or selling , and the bull’s and bear po

This indicator helps to identify market sessions, It's High/Low, Open Range (OR), range of the sessions in pips and percentage of previous day (change%) under OHLC.
It is also editable for any brokerage market watch time. For traders who use session trading strategies such as Mark B. Fisher ACD it can be super effective, where they can edit OR from the settings to either line or box. We tried to make the settings easier to edit, for traders' use on different markets, charts and brokerage t
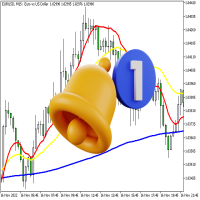
该指示器显示三条线并监视两种类型的交叉点。 指标的三行:“ MA ” - 慢速指标“移动平均线”,“ DEMA 慢速 ” - 慢速指标“ 双指数移动平均线”和“ DEMA 快速 ” - 快速指标“双指数移动平均线”。 两种交叉点 : " Alert Price MA " - 价格穿过 "MA" 线和 " Alert DEMA DEMA " - 线交叉 “DEMA 慢”和 “DEMA 快 ”。 交叉时,可以使用以下选项: 音名 - 带扩展名的文件名(例如“alert.wav”),该文件必须位于终端的“声音”文件夹中。例如,如果终端位于“C”驱动器,则声音将位于:“C:\Program Files\MetaTrader 5\Sounds” 重复 - 一个小节内的重复次数 暂停 ,以秒为单位 - 重复之间的暂停,以秒为单位 使用声音 - 标志,是否使用参数“声音名称” 使用警报 - 标记是否使用系统Alert 使用发送邮件 - 标记是否使用消息发送电子邮件 使用发送通知 - flag,是否使用Push消息
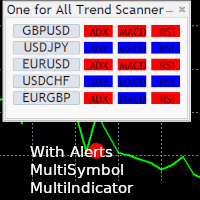
One for All Trend Scanner is a trend following multi-symbol indicator that can be used with any input: forex, stocks, commodities,... The panel shows three indicators and six symbols with the trend for every pair (symbol/indicator): up, down or no trend. The indicators are: Average Directional Movement Index (ADX) Moving Average Convergence Divergence (MACD) Relative Strength Index (RSI) You can choose which indicators will use for entry/exit and can adjust the parameters of each indicator sepa
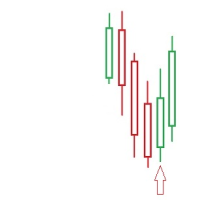
- simple Price Action Indicator - we recommend it for CURRENCY and GOLD Trades - NON Lagging ! the Alert shows instantly whats happening --> thats why the ARROW appears at the MOMENT the REVERSAL-Candle gets EXCEEDED
SETUP: - recommended SETUP is: 3 Candles bullish or bearish --> can easily be adjusted - user defined more than 4 is NOT recommended --> 50/50 its a heavy move going on - recommended Timeframe: M30 (we strictly recommend M30 ONLY!) - VOLUME Check? (last 2 tre
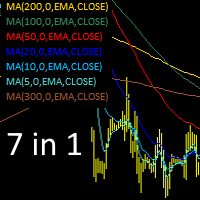
Moving Average indicators - 7 in 1. Installing 7 indicators at once, setting their parameters and properties. The indicators used (with basic properties) are shown in the upper left corner of the chart. When you click on the properties, the indicator turns on (activates) or turns off. The properties of the active indicator are displayed by its color. The properties of a disabled (not active) indicator is grayed out.
In the ind_ma indicator parameters: 1. Display the indicator on the chart (yes

- simple Price Action Indicator - a 3 Candle Pattern (1. Direction-Candle / 2. the TRAP / 3. Trigger-Candle) BUT every Signal needs ATTENTION to check for a clean Range - NON Lagging ! the Alert shows instantly whats happening - recommended SETUP is: - there is a VOLUME-Filter (in points for the 1. candle ) to avoid alerts with tiny Candles during a NON-VOLUME-Time - 10% off the Boobietrap-Candle as the ALERT-Level --> can easily be adjusted - user defined - recommended Timeframe: M30 (we
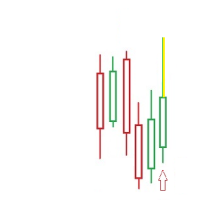
- simple Price Action Indicator - NON Lagging ! the Alert shows instantly whats happening - there is a VOLUME-Filter (Candle-Size in points) to avoid alerts with tiny Candles during a NON-VOLUME-Time plus you have a RANGE-Filter-Option (to make sure you get only the highest/lowest within that RANGE!) - recommended SETUP is: 25-30% Wicksize ( means the %percentage of the whole Candle) bullish or bearish --> can easily be adjusted - user defined - recommended Timeframe: M30 (with some experience
Adrian MOROSAN (2011) examined the same set of data using both traditional and modified RSI. He also incorporated trading volume in the method's calculating formula. Finally, findings acquired using the indicator's traditional form will be compared to those obtained using the modified version. He found that, in comparison to the original form, his version resulted in a greater advantage when a different, even opposing interpretation was used. And, in the alternative case, it resulted in much lar
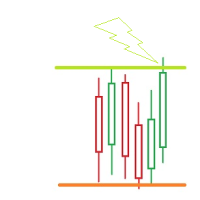
- simple PRICE Action Indicator/ Tool - SELF-Adjusting - you choose the UPPER Border of your RANGE ( Resistance) - you choose the LOWER Border of your RANGE ( Support) # Alert happens when the PRICE TOUCHes 1 of these Borders # (we release a CLOSED above/below - Version too) - popup Alert or custom sound - PUSH notification ( no email - that tool is for quicker action) - once a Border got hit --> it doesnt disappear --> it goes a selectable amount of POINTS ( RANGE(new) ) above/b
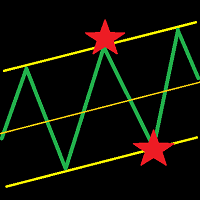
This indicator draws a trend line and a trend tunnel on the chart. You can choose several calculation methods, alerts, notifications, and other settings. It can also draw trendlines from another TimeFrame. You can also use this indicator for your ExpertAdvisor. The current values of the lines are stored in the memory buffer from where the EA can load them. You can trade the price bounce from the upper and lower lines . Settings TimeFrame – trend timeframe Description – show description of line
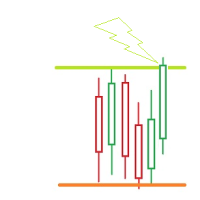
- simple PRICE Action Indicator/ Tool - SELF-Adjusting - you choose the UPPER Border of your RANGE ( Resistance) - you choose the LOWER Border of your RANGE ( Support) # Alert happens when the PRICE CLOSES above/below 1 of these Borders # (we released a TOUCH - Version too) - popup Alert or custom sound - PUSH notification - eMAIL notification - once a Border got crossed(closed candle! )--> it doesnt disappear --> it goes a selectable amount of POINTS ( RANGE(new) ) above/below t
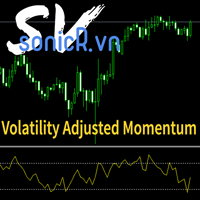
It's a indicators that computes volatility-adjusted momentum. The problem with the momentum indicator is that it's absolute and it's hard to interpret its value. For example, if you'll change the timeframe or instrument value of Momentum will be very different. We tried to solve that by expressing momentum in volatility . This way you can easier spot overbought/oversold values. You can choose to use Standard Deviation or ATR for adjustments. Our method is base on Momentum and the Cross-secti

The Quantitative Qualitative Estimation (QQE) indicator is derived from Wilder’s famous Relative Strength Index (RSI). In essence, the QQE is a heavily smoothed RSI.
Modification of this version: ( converted from tradingview script by Mihkell00, original from Glaz)
So there are Two QQEs. One that is shown on the chart as columns, and the other "hidden" in the background which also has a 50 MA bollinger band acting as a zero line.
When both of them agree - you get a blue or a red bar.

Watch permanently the strength of all majors! The strength is shown through horizontal bars in the top left corner. Additionally you get a recommendetation which pair is currently the strongest/weakest and should therefore be bought or sold. Simple and easy! I use this indicator in my own expert advisor - but I will probably NOT publish this expert advisor! Sorry guys!
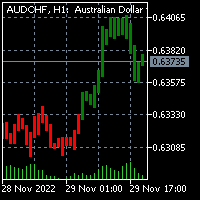
To download the MT4 version of Donchian Candles please click here . You may also check this link . This is inspired by TradingView: "Donchian Trend Ribbon" By "LonesomeTheBlue". This indicator merges Ribbon data into chart Candles. The result is one of the coolest indicators out there to detect trend direction and strength. As a trader you always need such indicator to avoid getting chopped in range markets. - You can message in private chat for further changes you need. The indicator is l

Keltner Channels (ou Canais de Keltner ) é mais um indicador de volatilidade utilizado pela análise técnica. Também chamado de envelope , esse canal foi criado por Chester Keltner para monitorar os seus investimentos no mercado futuro de café na década de 1960. Porém, com o passar do tempo, passou também a ser utilizado para outros ativos e, atualmente, é uma das ferramentas mais utilizadas pelos traders. Nesta versão customizada foram adicionados novas opções de método de média movel

Multiple Timeframe MACD indicator. This indicator was built for making multiple timeframe analysis possible in MT5 using MACD Indicator. MACD Indicator traditionally shows two lines and one histogram. MACD Line(Yellow) is calculated by subtracting 12period EMA(fast) from 26period EMA (slow). Signal Line(Blue) is created by a 9period EMA from MACD Line. Histogram is just the difference between MACD and Signal lines. Histogram is colored based on the difference between its value and the previous h

A Média Móvel é um indicador que faz parte da Análise Técnica. Com ela, é possível identificar o equilíbrio dos preços no mercado, observando tendências de alta, neutra ou baixa. Este indicador customizado traz opções extras pera definir o método de cálculo podendo-se esclolher entre SMA,EMA,SSMA,LWMA,JJMA,JurX,ParMA,T3,Vidya,AMA,HULL MA. Também conta com varias opções para escolher o método de cálculo para o preço base a ser usado no cáculo da média.

多时间框架移动平均线 OSW
(元交易者 5)
该指标将允许您添加所有类型配置的移动平均线,不同之处在于,如果您处于时间范围内,则可以在更高级别添加移动平均线,举个例子,如果您处于 5 分钟时间范围内 并且想要查看 15 分钟、1 小时和 4 小时的时间性的 20 的移动平均指数,只有在指标菜单中配置正确的参数,您才能看到它们,如指标图像中所示。 多时间框架移动平均线 OSW
(元交易者 5)
该指标将允许您添加所有类型配置的移动平均线,不同之处在于,如果您处于时间范围内,则可以在更高级别添加移动平均线,举个例子,如果您处于 5 分钟时间范围内 并且想要查看 15 分钟、1 小时和 4 小时的时间性的 20 的移动平均指数,只有在指标菜单中配置正确的参数,您才能看到它们,如指标图像中所示。
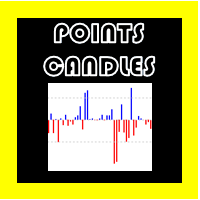
点蜡烛 OSW
(元交易者 5)
使用此指标,您可以知道图表中处理的每根蜡烛的点数大小,为您提供有关每根蜡烛的大小和方向的信息,如果看涨,指标将指向上方,如果看跌,则指向下方. 此外,您还可以隐藏或显示所有蜡烛,仅看涨蜡烛或仅看跌蜡烛,这适用于管理资产的经纪人,如 Deriv,在一个方向上提供更强的蜡烛,如果您的经纪人是正常的,这不应该是感动,除非你有发展战略? 点蜡烛 OSW
(元交易者 5)
使用此指标,您可以知道图表中处理的每根蜡烛的点数大小,为您提供有关每根蜡烛的大小和方向的信息,如果看涨,指标将指向上方,如果看跌,则指向下方. 此外,您还可以隐藏或显示所有蜡烛,仅看涨蜡烛或仅看跌蜡烛,这适用于管理资产的经纪人,如 Deriv,在一个方向上提供更强的蜡烛,如果您的经纪人是正常的,这不应该是感动,除非你有发展战略?

100 % PER MONTH PROFIT---- MY NEW SIGNAL HERE -------> https://www.mql5.com/en/signals/2162238?source=Site+Signals+My#
The Commodity Channel Index (CCI) measures the current price level relative to an average price level over a given period of time. CCI is relatively high when prices are far above their average. CCI is relatively low when prices are far below their average. Using this method, CCI can be used to identify overbought and oversold levels.
You can set the period of CCI.
The i
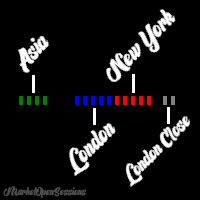
MarketOpenSessions is an indicator helps as a visual clue for which market session is at the time being. If you consider killzone, market open/close as important factor, this indicator would help you reduce effort in converting from one time zone to another. It has the following features 2 display styles: section (as colored line), and histogram 4 major configurable market sessions i.e. Asia, London, New York, and London-Close session. In additional to end of trading session of the day. Female s
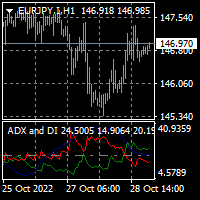
To download MT4 version please click here . This is the exact conversion from TradingView indicator: "ADX and DI" By " BeikabuOyaji". This is probably the most popular implementation of Average Directional Index available. This indicator lets you read the buffers as below: index 0: DIPlusBuffer ==> Green Line by default index 1: DIMinusBuffer ==> Red Line by default index 2: ADXBuffer ==> Navy Line by default - You can message in private chat for further changes you need. Note: This is a non-rep

CoioteOscilator é um rastreador de tendência e padrões de estruturas gráficas. O Indicador é composto de 3 elementos. oscilador principal lento: histograma com nível de 0 até 50 e 4 cores, 2 compradoras, de 0 até 30 e acima de 30 e duas vendedoras, de 0 até 30 e acima de 30. oscilador principal rápido: linha magenta com nível de -50 até 50. gatilho: linha amarela com nível de -50 até 50. O oscilador principal lento é um rastreador de tendência primaria.
O oscilador principal rápido é

This indicator is developed based on the multiple session trading to aid in analysis for all the day traders. The indicator supports all currency pairs as well as other trading instruments like indicies, commodities, metals ,etc. The way the indicator work is by making analysis on your behalf. During asian session that's when the indicator does the calculations and provided trading plans in form of areas on the chart for the current day. And this process happens everyday which allows for hands f

KT Trend Exhaustion is our personal implementation of the famous Trend Exhaustion Index developed by Clifford L. Creel, Ph.D., in 1991.
The change in price direction often comes with uncertainty. TEI helps to tackle the uncertainty by showing a crisp direction using the smoothed color-changing index.
Features
Easy to use and interpret. It comes with a multi-timeframe scanner that scans the upcoming signals across all the time-frames. It can be used as an entry signal or trend confirmation

KT Know Sure thing is a momentum oscillator based on the smoothed rate of change over four different timescales and was developed by Martin Pring. In 1992, Pring published the initial description of the indicator in Stocks & Commodities magazine's "Summed Rate of Change (KST)" article. KST creates a momentum oscillator by combining the price momentum measurements from four different price cycles. Traders can utilize KST to search for bullish or bearish divergences, signal line crossovers, and ce
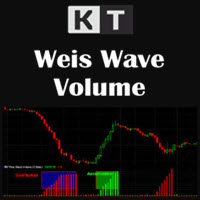
The KT Weis Wave Volume is a technical indicator based on the current market trend and description of the price movement's direction. The indicator is based on volume and displays the cumulative volumes for price increases and decreases in the price chart.
In addition, the indicator window shows a histogram of green and rising red waves.
The green color represents upward movement; the more the price rises, the larger the green volume. The red color represents a decreasing wave; the larger t

KT Forex Line can be described as an improved version of the moving average indicator. The indicator is embedded in the main trading chart and features a line that switches between blue and white depending on the prevailing direction or mood of the market.
Utilizing the indicator is simple. You do not need to understand complex graphs and intricate lines. Recognize the indicator line's color and trade accordingly.
Key Features
The indicator has customizable colors, with the blue and red b

The KT Market Speed is a unique and straightforward oscillator-based technical analysis tool that helps traders visualize the speed at which the price of an instrument changes based on the preset length. The Market Speed representation helps correctly map the price momentum: is it moving fast, slowing down, or trapped in a range? These are the questions the indicator answers, giving traders more bandwidth to execute better-informed trade positions.
Formula
It's a simple technical analysis t

KT Forex Super Scalper is created to identify market trends and plot trade signals based on the direction of the predetermined trend. It functions very similarly to moving averages but reacts quickly to changes in price actions and can signal right away once a valid trend is confirmed. The quick reactionary feature makes it a valuable tool for scalpers. However, anyone familiar with moving averages can use it for actual trading because of its signaling process and chart demonstration simplicity
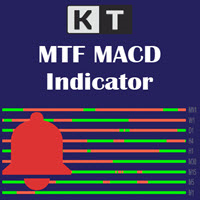
As a trader, monitoring multiple timeframes simultaneously will help you better understand the trend and know when multiple timeframes are in agreement or disagreement. The KT Multiple Time Frame (MTF) MACD displays the overall direction of an instrument in one chart by showing the moving average convergence divergence (MACD) for all time frames. The indicator displays a simple table with the respective MACD trend for each timeframe. You can also see whether MACD is gaining or losing momentum ac
Unleash the Power of Trading with the Boss Key Levels Indicator!
Are you ready to conquer the markets and elevate your trading prowess to extraordinary heights? Look no further! The Boss Key Levels Indicator is your secret weapon, designed to revolutionize the way you approach the financial markets and supercharge your trading strategy.
Harness the potential of Key Levels, those pivotal price zones that hold the key to market movements. With the Boss Key Levels Indicator, you gain acce
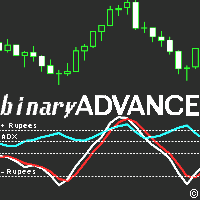
Update 2.2: Added MFI with predictive mod. Updated all indicators to reflect similar values, to combine multiple ones to rest well on overbought/oversold lines.
Update 2.3: Minor bug fixes.
Update 2.4: Removed buggy indicators DeMarker, and MACD, as it was too complicated and not as accurate as the rest due to it's nature. Added Awesome Oscillator. removed spreads, as it bogged the indicator down. Added other features, like indicator value compensators to match each other's levels when combine
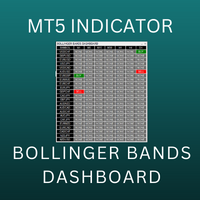
Bollinger Bands Multi Dashboard MT5 uses the value of Bollinger Bands indicator. This dashboard will monitor all symbols in the market watch. We can set up to receive an alert, notification or an email when the buy/sell signal appear on each timeframe. You can check all symbols via only 1 chart. This dashboard will check almost popular time frame (M1,M2,M3,M4,M5,M6,M10,M12,M15,M20,,M30,H1,H2,H3,H4,H6,H8,H12 and D1) in MT5. The colors can be customized. We can have a look at many pairs and many t

To download MT4 version please click here . - This is the exact conversion from TradingView: "Trend Direction Force Index - TDFI [wm]" By "causecelebre". - This indicator uses multiple levels of averaging to detect trend strength. - You can optimize filter low and filter high levels to achieve best results. - You have access to buffers to use in EAs. - This is a light-load processing and non-repaint indicator. - You can message in private chat for further changes you need.
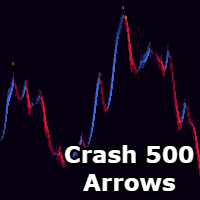
Sylvan Crash 500 Arrows!! MT5
*Only use this on Crash 500 Market. *Only for the 15M Chart. *Sells only. *This doesnt redraw or repaint but the candle needs to close for the arrow to print permanently, it does print on candle open. *It doesnt get you at the tip of highs but instead as soon as price slows down or drops from its overbought parameters. *Do not change input settings as this is already optimized.
Easily convert your candlestick patterns into signals!
Eval - Command interpreter - Command line interface - String converter - Customizable sign I bring one more indicator that was requested by a real trader. Thanks for the suggestion mate!
The String2Signal indicator will allow you to write your candlestick patterns and get the signals on the screen, integrating with EAs or using it to assist in manual operations. You type a text with your setup and the indicator converts it into the MQ

!! FLASH SALE !! Over 80% off !! For ONE week only. Now only $47 - normally $297! >>> Ends on 30 June 2023 - Don't miss it!
Buy and Sell Arrows when price breaks away from mean price. Sends Alerts – On MT5 To Your Phone To Your Email
Does not repaint .
Works on any Forex pair, any timeframe.
10 Activations allowed so you are free from limitations >> MT4 Version Here For spreads from a tiny 0.1 pips RAW/ECN Accounts, click here . Check out my Waka Esque EA signal here: >>
MetaTrader 市场 - 在您的交易程序端可以直接使用为交易者提供的自动交易和技术指标。
MQL5.community 支付系统 提供给MQL5.com 网站所有已注册用户用于MetaTrade服务方面的事务。您可以使用WebMoney,PayPal 或银行卡进行存取款。
您错过了交易机会:
- 免费交易应用程序
- 8,000+信号可供复制
- 探索金融市场的经济新闻
注册
登录