适用于MetaTrader 5的技术指标 - 43

A huge number of traders use the VolumeProfile/MarketProfile analysis method. And I think there is no need to explain such concepts as POC and VAH/VAL. However, the standard VolumeProfile representation has a drawback - we only see the current picture of the market. We see the "convexity" of the volume distribution within the period. But we don't see the main thing - the "migration" of the POC level during the price movement. Our indicator is unique. It is dynamic. The first feature is that the
An indicator of patterns #47 and #48 ("Triangle, ascending" and "Triangle, descending") from Encyclopedia of Chart Patterns by Thomas N. Bulkowski.
Parameters: Alerts - show alert when an arrow appears Push - send a push notification when an arrow appears (requires configuration in the terminal) PeriodBars - indicator period K1 - an additional parameter that influences the accuracy of pattern shape recognition K2 - an additional parameter that influences the accuracy of pattern shape recogn

趋势使您可以预测价格变动并确定交易结束的主要方向。可以使用适合交易者交易风格的各种方法来构建趋势线。 该指标根据 von Mises 分布计算趋势运动的参数。使用这种分布可以得到趋势方程的稳定值。除了计算趋势之外,还会计算可能的上下偏差水平。 该指标根据当前价格值更新其值。他的行为显示在视频中:
指标参数: iPeriod - 用于计算趋势和水平的柱数 Shift - 继续线向前的柱数 WidthTrend - 趋势线的宽度 WidthLvl1 和 WidthLvl2 - 水平线的宽度 StyleTrend - 趋势线样式 StyleLvl1 和 StyleLvl2 - 水平线样式 ClrTrend - 趋势线颜色 ClrUp - 水平线的颜色 ClrDown - 水平线的颜色

DYJ Tradays Economic Calendar is calendar Indicators of macroeconomic events for fundamental market analysis. Therein you will find financial news and indicators for the largest global economies – from the US and the EU to Australia and Japan, a total of 23 economies, involving more than 60 currency pairs. More than 800 macroeconomic indicators and events are collected from public sources in real time. Historical, current and forecast values, as well as importance characteristics are available
An indicator of pattern #49 ("Triangle, symmetrical") from Encyclopedia of Chart Patterns by Thomas N. Bulkowski. Parameters: Alerts - show alert when an arrow appears Push - send a push notification when an arrow appears (requires configuration in the terminal) PeriodBars - indicator period K - an additional parameter that influences the accuracy of pattern shape recognition ArrowType - a symbol from 1 to 17
ArrowVShift - vertical shift of arrows in pixels ShowLevels - show lines ColUp - c
An indicator of patterns #39 and #40 ("Rounding Tops" and "Rounding Bottoms") from Encyclopedia of Chart Patterns by Thomas N. Bulkowski. Parameters: Alerts - show alert when an arrow appears Push - send a push notification when an arrow appears (requires configuration in the terminal) PeriodBars - indicator period K - an additional parameter that influences the accuracy of pattern shape recognition. Changes from 0 to 1 ArrowType - a symbol from 1 to 17 ArrowVShift - vertical shift of arrows

An indicator of patterns #11 and #12 ("Diamond Tops" and "Diamond Bottoms") from Encyclopedia of Chart Patterns by Thomas N. Bulkowski. Parameters: Alerts - show alert when an arrow appears Push - send a push notification when an arrow appears (requires configuration in the terminal) PeriodBars - indicator period K - an additional parameter that influences the accuracy of pattern shape recognition ArrowType - a symbol from 1 to 17 ArrowVShift - vertical shift of arrows in pixels ShowLevels - s
An indicator of patterns #37 and #38 ("Rectangle Tops" and "Rectangle Bottoms") from Encyclopedia of Chart Patterns by Thomas N. Bulkowski. Parameters: Alerts - show alert when an arrow appears Push - send a push notification when an arrow appears (requires configuration in the terminal) PeriodBars - indicator period VertexCount - the number of tops and bottoms: 2, 3, 4. ArrowType - a symbol from 1 to 17 ArrowVShift - vertical shift of arrows in piхels ShowLevels - show levels ColUp - colo
An indicator of patterns #7 and #8 ("Bump-and-Run" and "Bump-and-Run Reversal") from Encyclopedia of Chart Patterns by Thomas N. Bulkowski. Parameters: Alerts - show alert when an arrow appears Push - send a push notification when an arrow appears (requires configuration in the terminal) PeriodBars - indicator period K - an additional parameter that influences the accuracy of pattern shape recognition ArrowType - Character: from 1 to 17 ArrowVShift - vertical shift of arrows in pixels ShowL

Description
Trend Influencer is an indicator that determines the potential dynamics of the influence of trend wave movements on the market. The indicator is based on the value of moving averages corrected by the standard deviation. The indicator is displayed as a main dash-dotted moving average and a signal solid moving average. The signal moving average is colored blue or red depending on what type of trend is currently observed in the market. The indicator also draws inhibition levels - blue

O Indicador BOPCoiote é uma releitura do indicador Balance of Power proposto por Igor Livshin em Agosto de 2001, publicado na Stocks and Commodities Magazine. Uma média móvel de 14 períodos é recomendada para gráficos diários. Embora o número de períodos possa variar dependendo da natureza do mercado e dos prazos.
O nível em que ele agrupa seus fundos e topos é considerado uma das propriedades mais importantes do indicador BOP.
Durante as tendências de alta, suas máximas frequentemente tocam

算术平均值或中位数可用于确定时间序列的中心趋势的度量。这两种方法都有一些缺点。算术平均值由简单移动平均线指标计算。它对排放和噪音很敏感。中位数表现更稳定,但在区间边界处会丢失信息。 为了减少这些缺点,可以使用伪中值信号滤波。为此,取一个小长度的中位数,并将其递归地应用于所研究的金融时间序列周期的所有值。由于这种方法,该指标使您能够更准确地识别周期性和趋势性价格变动。 指标的外部参数: 启动指标时,在“参数”选项卡中,选择将用于计算的价格常数(默认为关闭); iPeriod - 指标周期。此参数的值越高,指标对最新价格变化的敏感性就越低。此参数的最小值为 3; MaxBars - 限制计算的历史深度。如果指标需要很长时间才能启动,这会很有用。如果 MaxBars = 0,则没有限制,指标将应用于整个图表。

這是第二種格式的分時圖。 有對 OpenCL 的支持。 設置非常簡單 - 您可以選擇一周中的哪幾天計算指標: 例如,對於此類金融工具,其報價在周末不更新,您必須在第 6 天和第 7 天選擇一周中的任何其他日子,但是,例如,對於比特幣,如果經紀人更新報價,您可以 指定第 6 天 - 星期六,第 7 天 - 星期日。 如果您願意,您還可以自定義顏色。 這是一條自適應且平滑的顏色線。 該指標在策略測試器中不起作用 - 購買前請觀看視頻。 /////////////////////////////////////////// 我希望這個指標對您成功交易非常有用。 /////////////////////////////////////////// 祝你好運。

Binary MA Cross MA Cross indicator by 4Umbella
Create for traders both experienced and inexperienced to use it because it is a basic indicator
How to use : 1. MA Fast : Moving Average fast (Period 4 upto 50) 2. MA Middle : Moving Average Middle (Period 10 upto 100) 3. MA Slow : Moving Average Slow (Period 50 upto 200) to control trend markets.
and trader can be set for Apply to price (Close, Open,Low,High,Median,Typical,weightd)
For alert you can set to alert Next bar or instant bar

///////////////////////////////////////////////// /////////////////////////////////
标准平均真实范围指标的改进版本。
这现在是精度和彩色平均线的两倍。
设置非常简单 - 您需要指定主周期和平均周期。
该指标的读数很容易理解,其含义与标准平均真实范围的含义相同。
///////////////////////////////////////////////// ///////////////////////////////////
我希望该指标对您成功交易非常有用。
祝你好运。 ///////////////////////////////////////////////// /////////////////////////////////

///////////////////////////////////////////////// /////////////////////////////////
该指标显示 1 分钟内价格变化的范围。 非常适合风险管理。 这是刻度图的标准平均真实范围指标的改进版本。
这现在是精度和彩色平均线的两倍。
设置非常简单 - 您只需要在必要时更改颜色。
该指标的读数很容易理解,其含义与标准平均真实范围的含义相同。 如果您在策略测试器中没有看到指标读数,请尝试快进,然后, 当读数出现时,在图形窗口中减慢速度。 由于策略测试器的特殊性,数据并不总是在那里正确显示。 在真实数据的终端中一切正常。
///////////////////////////////////////////////// ///////////////////////////////////
我希望该指标对您成功交易非常有用。
祝你好运。 ///////////////////////////////////////////////// ///////////////////////////

Unlike any indicator you’ve seen, Trend Volley is an advanced purpose-built trend trading charting system that has been successfully used in nearly every tradable market. It is unique in many ways. Trend Volley’s internal trend detector algorithm studies the market and dynamically chooses the right values for the internal parameters, to adapt to the price and to decrease consecutive trend failures. It can be applied to any financial assets: forex, cryptocurrencies, metals, stocks, indices. ITS

One of the best tools for analyzing volume, Weis Wave was devised by David Weis to facilitate reading the directional flow.
For the disciples of the Wyckoff method, this means an evolution, facilitating a predictive reading of the market, always looking for Accumulation and Distribution zones for traded assets.
For better understanding, in this indicator we try to cover every reading of EFFORT (traded volume) versus RESULT (price change). Thus, you can apply the indicator on the chart twice
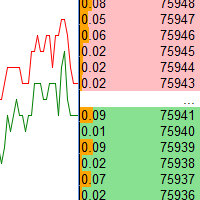
Depth of market display. Up to sixteen instruments can be displayed. There is auto-scrolling of prices, which can be turned off by clicking on "A" at the top of the window. It is quite a beautiful indicator, it can act as a splash screen, it will not be so boring to look like a regular chart, just right for meditation, especially after big losses in the market. The indicator is not for trading, so your deposit will be more complete. The video displays fast playback of previously saved data. Atte

Simple and fast MACD oscillator with MACD and signal lines and two-color histogram.
I wasn't happy with the Meta Trader MACD oscillator as it's not immediate to read and the other ones I tried felt a bit laggy or added unneeded features on top, so I decide to make one that feels familiar to me. I hope you will find it useful!
Contact me for any issues or bugs and I will try to help the best I can.

A lot of professional traders use high quality divergence signals as a part of their strategy to enter a position. Spotting correct divergences quickly can often be hard, especially if your eye isn’t trained for it yet. For this reason we’ve created a series of easy to use professional oscillator divergence indicators that are very customisable so you get only the signals you want to trade. We have this divergence indicator for RSI, MACD, Stochastics, CCI and OBV. RSI: https://www.mql5.com/en/

A lot of professional traders use high quality divergence signals as a part of their strategy to enter a position. Spotting correct divergences quickly can often be hard, especially if your eye isn’t trained for it yet. For this reason we’ve created a series of easy to use professional oscillator divergence indicators that are very customisable so you get only the signals you want to trade. We have this divergence indicator for RSI, MACD, Stochastics, CCI and OBV. RSI: https://www.mql5.com/en/ma

A lot of professional traders use high quality divergence signals as a part of their strategy to enter a position. Spotting correct divergences quickly can often be hard, especially if your eye isn’t trained for it yet. For this reason we’ve created a series of easy to use professional oscillator divergence indicators that are very customisable so you get only the signals you want to trade. We have this divergence indicator for RSI, MACD, Stochastics, CCI and OBV. RSI: https://www.mql5.com/en/

A lot of professional traders use high quality divergence signals as a part of their strategy to enter a position. Spotting correct divergences quickly can often be hard, especially if your eye isn’t trained for it yet. For this reason we’ve created a series of easy to use professional oscillator divergence indicators that are very customisable so you get only the signals you want to trade. We have this divergence indicator for RSI, MACD, Stochastics, CCI and OBV. RSI: https://www.mql5.com/en/

A lot of professional traders use high quality divergence signals as a part of their strategy to enter a position. Spotting correct divergences quickly can often be hard, especially if your eye isn’t trained for it yet. For this reason we’ve created a series of easy to use professional oscillator divergence indicators that are very customisable so you get only the signals you want to trade. We have this divergence indicator for RSI, MACD, Stochastics, CCI and OBV. RSI: https://www.mql5.com/en/

Moving Average Crossover Scanner and Dashboard For MT5 Advanced Moving Average Scanner Moving Averages Crossover Dashboard MT4 Version of the product can be downloaded: https://www.mql5.com/en/market/product/69260 The indicator scans the market and sends signals and alerts for Moving Average crossovers, death cross and golden cross.
Crossovers are one of the main moving average ( MA ) strategies.
MA Crossover ( cut ) strategy is to apply two moving averages to a chart: one longer and one s

One of the most famous phrases in the trading world is "The Trend Is Your Friend".
Trading following the current trend is one of the most successful ways in terms of probability. The hard part of it is to recognize when the market is trending or not.
that's the role of our indicator we called The Trend Is Your Friend Until It Is Not. Apart from its big name it is really easy to use and see when the market is trending or ranging. Through a little window of 3 colors you will identify if the ma
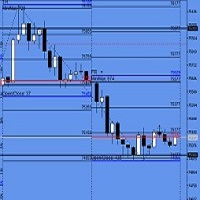
Open close levels.
Open close levels - is an indicator for MetaTrader 5, which displays High/Low, Open/Close, ATR levels (set manually) of the day, week, month on the chart. Marks round levels, signs the days of the week, numbers every week. All levels are marked with price tags with a price symbol. Also, the indicator automatically calculates and displays on the chart the distance that the price has passed from High to Low and from Open to Close by day, week and month.
The indicator di

Counts the lifetime of Candle Extra until its closing.
It is used to assist in the entry of operations... ...We operate at the close of one-minute Candles, that is, when the timer is at 00:xx:01. We open an order, and the value of that operation is also displayed by the tool.
Extra: To 'unlock' the price scale. Double click on the scale and the graph will be 'horizontally centered'. In addition to allowing the expansion and contraction of the price scale, we can navigate the chart by dra

Multi Time Frame Sub Panel for MT5. Monitor multiple time frames from a single chart window.
Here are some of the options available with the MTF Moving Average: Select the timeframes to be displayed (can manually type in other TF's) Customize the amount of timeframes to be displayed Define the width (number of bars) for each timeframe box Modify all the colors Display two moving averages
MTF, MA, Multi-TF, Multiple TF, Moving Average, SubPanel, Sub-panel,

For anyone studying forex charts, the aim is to identify trends, and spot reversals. If you have years of experience it may be easy, but most of us need something to make the trend apparent. If you're familiar with the popular renko charting method, you know that it was developed for this purpose. But renko charting has a flaw; the trend is often broken by false reversals. So I developed my own version - the Kenko Trend Indicator. The kenko trend indicator draws renko style trend following block

Half Trend TPSL Buy Sell Indicator calculates the open and close of the price bars over the selected period of time and applies its own calculation method to find an average line of the price movement. ATR based Take Profit and Stop Loss ATR is a measure of volatility over a specified period of time. The most common length is 14, which is also a common length for oscillators, such as the relative strength index (RSI) and stochastics. A higher ATR indicates a more volatile market, while a lowe

An indicator of patterns #35 and #36 ("Pipe bottoms" and "Pipe tops") from Encyclopedia of Chart Patterns by Thomas N. Bulkowski. Parameters: Alerts - show alert when an arrow appears Push - send a push notification when an arrow appears (requires configuration in the terminal) PeriodBars - An indicator period (number of bars that form a top/a bottom) K1 - an additional parameter that influences the accuracy of pattern shape recognition K2 - an additional parameter that influences the accuracy

Version 1.0 The Trend Snatcher is Multi timeframe indicator that can be used to catch swings on the price market chart The indicator uses two lines that targets the highest buying and lowest selling levels , the signal indicated by the two lines crossing The indicator is suitable for scalping and Swing trading, It can also be used as additional Confluence to enter a trade when Price is at a significant level of supply and demand or Trendline touch
HOW IT WORKS? Buying : Place your Buy

Sends alert when price moves from the previous alarm price by predefined points (or bps). Four alarm modes: push notifications, pop-up, e-mail and / or FTP. Highly customizable alert text and user-configurable indicator color / width / style.
Input parameters: Alert offset, in points : Alert is triggered when price moves from the previous alert by predefined points (if the last alert has not been registered, the current price is used as the last alert). The alert price is updated automaticall

Automatically plots the 'Golden Fibonacci Ratio’ between the High and Low of the previous day... ...Highs and Lows are great Support and Resistance zones.
Breakouts of Fibonacci levels are key points for entry and exit of trades.
Pink lines indicate that the previous day's Candle closed lower. Blue colored lines indicate that the previous day's Candle closed higher.

RSI Arrow1 is an arrow indicator based on the RSI, is easy to use; no internal adjustments to be made. the user can change the indicator period as desired in the settings. It can be used on all markets but it will all depend on your Trade strategy. There is no better Time Frame for its use; the use will depend on the Trader himself.
Settings:
RSI Period Push Notification Email Notification Audible Alert Down levels Up levels

HLBand is an indicator which can show trend, volatility channels, and it has 3 line levels: upper, middle and lower.
HLBand MT5 version is a perfect translation of HLBand MT4, it works absolutely identical to MT4 version.
Indicators Inputs
BandPeriod - the period used for calculating values of bands. PriceField - the price used for calculations, it can have two values: 0:High/Low, 1:Close/Close.

Stable Signals is a simple indicator with simple and reliable signals. The first advantage a trader gets when using forex arrow indicators is convenience. There is no need to look for the intersection of moving averages or oscillator lines by straining your eyes and peering at the chart. It is enough to see 1-2 arrows - and this is already a signal. The good thing is that the arrow is colored. The trader is always looking for good indicators. It is very convenient to use arrow Forex indicators,
An indicator of patterns #32 and #33 ("Measured Move Up/Down") from Encyclopedia of Chart Patterns by Thomas N. Bulkowski. Parameters: Alerts - show alert when an arrow appears Push - send a push notification when an arrow appears (requires configuration in the terminal) PeriodBars - indicator period MinMovment - minimum movement value (in points) BackMovment - maximum value of return movement (as decimals) ArrowType - a symbol from 1 to 17 ArrowVShift - vertical shift of arrows in points Sh
MT4 version - https://www.mql5.com/ru/market/product/69932
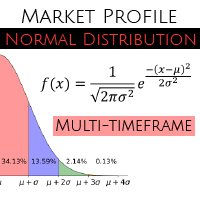
Unlike other indicators of this type, this version has: The ability to display data from smaller timeframes on the current chart. For example, displaying data from the M1 period on the H1 chart. Calculation of values using the Gaussian formula (normal distribution formula). Flexible system of settings. Settings: basePeriod - base period. indicatorMode - display mode. Sets the value of each interval: by4h (4 hours), by6h

Binary Options Assistant (BOA) Multi Currency Dashboard for Binary Options (MT5) .
You can use any of the BOA Signals Indicators with the dashboard. Just change the BOA Signals Indicator Name in the dashboard settings to the indicator you want to get signals from. For example: CHILL. BLAZE: BOA_BLAZE_Indicator_v1 Strategy : BLW Online Trading Binary Options Strategy (3 Moving Average)
LAVA: BOA_LAVA_Indicator_v1 Strategy: Lady Trader Binary Options Strategy (Bollinger Bands & Stoc
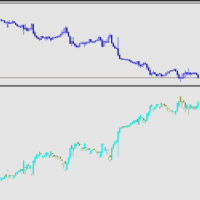
反转K线指标! 指标将主图的K线在副图中进行反转显示. 交易实用必备工具指标 波浪自动计算指标,通道趋势交易 完美的趋势-波浪自动计算通道计算 , MT4版本 完美的趋势-波浪自动计算通道计算 , MT5版本 本地跟单复制交易 Easy And Fast Copy , MT4版本 Easy And Fast Copy , MT5版本 本地跟单复制交易 模拟试用 Easy And Fast Copy , MT4 模拟账号运行 Easy And Fast Copy , MT5 模拟账号运行 The indicator of the attached figure shows that it is a mirror image of the candlestick chart of the main chart. The ordinate of the figure indicator is mirrored with the main image, and the coordinate value is a negative number.
For graphic reference o
The Lots Risk Sizer indicator will help you quickly determine the volume of a position in lots
The indicator has a collapsible panel at the touch of a button. When installed on a chart, it is located in the lower right corner in the form of a triangular button. Indicator parameters:
Risk - the amount of risk in the account currency (usd, eur, etc....). Enter only a whole number
Lots - risk in lots
Show description (On/Off) - show a text description of the displayed values
Display state

Индикатор работает только с реальными биржевыми тиковыми данными. Для вычислений используются тики BID ASK и данные с ленты сделок . Индикатор проверялся на бирже CME на инструментах с узким и стабильным спредом ( S&P500, NASDAQ, CLE и др.), пояснения на скринах. Исполнение индикатора в виде кластера в правой части графика. Каждому ценовому уровню графика выбранного участка между линиями (или отдельной свечи) соответствует полоска кластера, окрашенная в удобный для пользователя цвет (по умол
Binary Options Assistant (BOA) BLAZE Signals Indicator provides signals based on Christian’s at BLW Online Trading Binary Options Strategy. Indicators: 3 Moving Averages
Stop missing trades, stop jumping from chart to chart looking for trade set-ups and get all the signals on 1 chart! U se any of the BOA Signals Indicator with the Binary Options Assistant (BOA) Multi Currency Dashboard . All BOA Signal Indicator settings are adjustable to give you more strategy combinations. The signals c

Индикатор показывает настроение слабой стороны и может использоваться как для внутридневной торговли, так и для скальпинга. Всё будет зависеть от контекста графика. Этот индикатор строит ценовой график в виде блоков (вертикальных прямоугольников, занимающих три ценовых уровня каждый), чем-то напоминающих ренко бары. Принцип построения основан на определённом изменении уровней BID и ASK (пояснения на скрине). При установке индикатора основной график становится невидимым и на белом поле происх
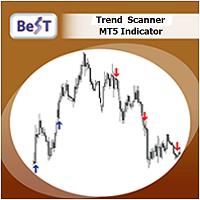
BeST_Trend Scanner is an MT5 Indicator that uses a proprietary algorithm in order to identify the most likely levels and probable moment for an upside or a downside trending price move.
BeST_Trend Scanner is a very useful tool that defines in advance and with a high statistical percentage of accuracy the subsequent Resistance & Support Levels of the anticipated upside or downside trending move of price and so
When used at its Reverse Entries Mode :
It generates Buy or Sell arrows at the
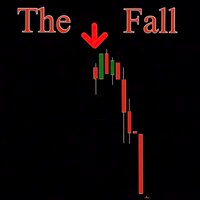
Hurry and buy before price doubles! *Non-Repainting Indicator Message Me Immediately After Purchase For VIP Installation Help and Free Trend Filter Indicator "The Fall" is an indicator that shows precise Sell reversals. A great arsenal to add to any chart. "The Fall" is designed to alert SELLS only. So Of course, Only Take The Arrows In a Downtrend Only For Best Results I Recommend www.CoinexxBroker.com as a great broker and the one I personally use *Non-Repainting *For Desktop MT5 Only *G
This indicator shows No Demand and No Supply signals for high probability trade entries and exits. Very powerful when combined with specific support and resistance zones to identify turning points in the market.
No Demand – the situation of a deficit of buyers in the up-move. Possible short position. Definition: (look at the below screenshots for illustration) Signal candle volume is lower than the previous two. Signal candle is bullish. Signal candle has an upper wick/pin. Confirmation candle

The indicator Bottom Touch determines the bottom in the market, from which a rebound or a global reversal may start with a high probability. Works best on more volatile markets and H1 , H4 , D1 timeframes. Does not work on timeframes above W1.
Consists of two lines Green and Gray . Bounces from the Gray line occur less frequently, but have the highest probability of a bounce or even a market reversal. Bounces off the Green line are more frequent, but less likely to bounce.
WALKING ON THE CLOUD
TREND INDICATOR GREEN ARROW : UPTREND BLU ARROW : DOWNTREND
BASED ON SEVERAL TREND INDICATORS :
MOVING AVERAGE / ICHIMOKU KYNKO HYO / SUPERTREND / PARABOLIC SAR
HELP YOUR TRADING WITH THIS POWERFULL INDICATOR ! PROFITABLE IN EVERY TIMEFRAME AND IN EVERY CHART BUT THE SIGNALS ARE MORE ACCURATE IN H1 TIMEFRAME,SO I SUGGEST THIS TF RECEIVE DIRECTLY TO YOUR PHONE THE SIGNAL WHEN A NEW ARROW APPEARS PLEASE CONTACT ME FOR EVERYTHING

The Fractals indicator displays on the chart only fractals with the specified parameters in the indicator settings. This allows you to more accurately record a trend reversal, excluding false reversals. According to the classical definition of a fractal, it is a candlestick - an extremum on the chart, which was not crossed by the price of 2 candles before and 2 candles after the appearance of a fractal candle. This indicator provides the ability to adjust the number of candles before and after t

The only Market Ticker on the market! Add a professional novelty to your workspace, with built in mini-charts
A scrolling Market Ticker that displays price changes from all symbols in the Market Watch list. Provides an easy snapshot of symbol prices, and keeps scrolling automatically while you trade and analyse the chart. The ticker color (+/- price changes) are based on either the current or completed candle, and the previous candle.
Options include: - MTF, eg choose to show price changes o

Binary Options Assistant (BOA) BOIL Signals Indicator provides signals based on Ana Trader Binary Options Strategy. Indicators: Stochastic
Stop missing trades, stop jumping from chart to chart looking for trade set-ups and get all the signals on 1 chart! U se any of the BOA Signals Indicator with the Binary Options Assistant (BOA) Multi Currency Dashboard . All BOA Signal Indicator settings are adjustable to give you more strategy combinations. The signals can be seen visually and heard au

Binary Options Assistant (BOA) BURN Signals Indicator provides signals based on Ana Trader Binary Options Strategy. Indicators: MACD & Stochastic
Stop missing trades, stop jumping from chart to chart looking for trade set-ups and get all the signals on 1 chart! U se any of the BOA Signals Indicator with the Binary Options Assistant (BOA) Multi Currency Dashboard . All BOA Signal Indicator settings are adjustable to give you more strategy combinations. The signals can be seen visually and hea
Binary Options Assistant (BOA) COLD Signals Indicator provides signals based on Amalia Trader Binary Options Strategy. Indicators: Keltner & Stochastic
Stop missing trades, stop jumping from chart to chart looking for trade set-ups and get all the signals on 1 chart! U se any of the BOA Signals Indicator with the Binary Options Assistant (BOA) Multi Currency Dashboard . All BOA Signal Indicator settings are adjustable to give you more strategy combinations. The signals can be seen visually

This indicator is a trend indicator . It is based on moving averages. Very simple and very useful. One thing to keep in mind is that it is a trend indicator , so it is better to use it when the market is trending. Use on any pairs . It is not re paint indicator . It should not be used in ranging markets . Stop Loss, Entry and Exit can also be used with this indicator. You can see how to use this indicator in the screenshots. More useful on M15, H1, H4 time frames. Thanks For All.
MT4 Version i

Stochastic force is an advanced version of the stochastic oscillator. Instead of using the regular price a more efficient price data is provided as an input for the oscillator which takes into account the price efficiency, volume and market noise. Also price is pre-filtered with the selected average type and then post-filtered by a hull moving average which provides a smooth transition of the oscillator. It eliminates maximum false signals and has the potential to become an integral part of any
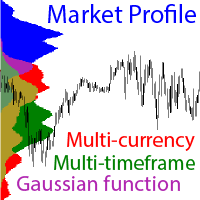
MT4 version - https://www.mql5.com/en/market/product/70776 Attention ! For correct work you need to download data for all instruments in all t imeframes ! The ability to display multiple currency pairs. The a bility to display data from smaller timeframes on the current chart. For example, displaying data from the M1 period on the H1 chart. Calculation of values using the Gaussian f unction (normal distribution formula). Flexible system of settings. Settings : symbol 1 – The Name of the
Binary Options Assistant (BOA) LAVA Signals Indicator provides signals based on Lady Trader Binary Options Strategy (Bollinger Band & Stochastic). Indicators: Bollinger Bands & Stochastic
Stop missing trades, stop jumping from chart to chart looking for trade set-ups and get all the signals on 1 chart! U se any of the BOA Signals Indicator with the Binary Options Assistant (BOA) Multi Currency Dashboard . All BOA Signal Indicator settings are adjustable to give you more strategy combinatio

Pick a start time and an end time and get levels based on the high and low of that time frame. Great for trading Session open or session breakout. The indicator draws a box around the start and end time, and then draws lines that extend until the next session start. If your wanting to determine high and low before NY, you could set, depending on your brokers time zone, a start of 12:00 and end of 15:00 and it would show you the price range of pre-ny, and then you can trade based on that.

The indicator helps the trader in identifying potential liquidity levels. The algorithm used in this indicator checks the behavior of the asset taking into account the price levels, momentum and volume analysis. Features:- Parameters for signal optimization and alerts. Usage:- The levels formed by the indicator can be helpful to traders in identifying potential entries, breakouts or reversals. it can assist traders of technical trading background or even pure price action trading.
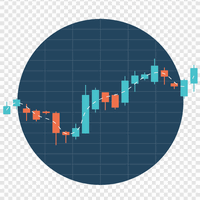
一些交易者在交易时以交易时段为指导。图 1 显示了一周内的平均价格波动。可以看出,不同日期的交易时段在持续时间和活动上有所不同。 该指标旨在估计每周周期内特定时间间隔的平均价格变动。它分别考虑了价格的上下波动,并可以确定市场可能出现高波动的时刻。 在图表上,向上运动显示在中线上方,向下运动显示在中线下方。绿色直方图显示了根据历史数据计算的平均移动。红色直方图显示实际价格变动。以点为单位的价格变动之间的累积差异会额外显示在右上角。计数器在每周开始时重置为零。 该指标可以在 M1 - D1 的所有时间范围内工作。所有指示灯设置与其外观相关,不影响其操作。 实时工作时,指标使用交易品种图表中的可用数据。并且在策略测试器中使用指标时,需要使其能够累积历史统计数据。

In combination with the BT you can test python strategies. The BT has a history of M1 bars from 2016 onwards (over 5 years, source DukasCopy). At this moment the history for the basic 28 instruments will be available.
All time frames are deducted from these M1 bars (M5, M10, M15, M20, M30, H1, H2, H3, H4, H6, H8, H12, D1). Stepping through the history in M1 bar increment or multiple M1 bar increments. Orders and positions will be updated every increment.
All history bars of the instruments

The BWmfi Bar indicator is designed to work with the Bill Williams system
The indicator displays MFI signals on the chart, highlighting bars the corresponding MFI signals
You can choose 4 options for the indicator operation by setting the corresponding number 1,2,3,4 in the settings, in the "Input parameters" tab:
Normal graph without MFI signals In this mode, the bars will be painted in the colors of the MFI bars This regime is used in his trading by Justin Williams, the daughter of Bil
Binary Options Assistant (BOA) CHILL Signals Indicator provides signals based on Katie Tutorials Binary Options Strategy. Indicators: 3 Moving Averages & RSI
Stop missing trades, stop jumping from chart to chart looking for trade set-ups and get all the signals on 1 chart! U se any of the BOA Signals Indicator with the Binary Options Assistant (BOA) Multi Currency Dashboard . All BOA Signal Indicator settings are adjustable to give you more strategy combinations. The signals can be seen vi
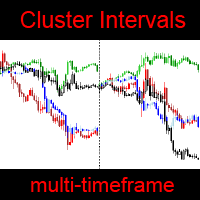
MT4 version — https://www.mql5.com/en/market/product/70972 With this indicator, you will be able to observe the relative price changes of other instruments on the current chart. Settings : refreshEveryTick — updates every tick.
sym1 — The Name of the instrument. If empty or equal to "0", then it is ignored. numberOfIntervals — number of intervals. i ndicatorMode — display mode. Sets the value of each interval: by4h (4 hours), by6h (6 hours), etc. Mode byDeep
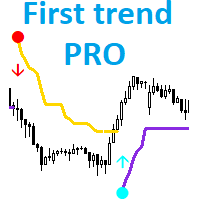
Трендовый индикатор который подойдет как для новичка, так и для профессионального трейдера. Алгоритм индикатора отфильтровывает незначительные колебания цены при этом выделяет основные трендовые движения. First trend PRO подойдет для неопытных трейдеров. Индикатор показывает точки входа и текущее направление движения цены. Благодаря этому вы всегда будите в курсе текущего положения дел на рынке. Преимущества First trend PRO : First trend PRO подходит для всех символов Meta Trader 5: валют, мет

The BWmfi Bar indicator is designed to work with the Bill Williams system The indicator displays MFI signals on the chart, highlighting candles the corresponding MFI signals
You can choose 4 options for the indicator operation by setting the corresponding number 1,2,3,4 in the settings, in the "Input parameters" tab:
Normal graph without MFI signals In this mode, the bars will be painted in the colors of the MFI bars
This regime is used in his trading by Justin Williams, the daughter of Bi
MetaTrader市场是 出售自动交易和技术指标的最好地方。
您只需要以一个有吸引力的设计和良好的描述为MetaTrader平台开发应用程序。我们将为您解释如何在市场发布您的产品将它提供给数以百万计的MetaTrader用户。
您错过了交易机会:
- 免费交易应用程序
- 8,000+信号可供复制
- 探索金融市场的经济新闻
注册
登录