 MetaTrader 5
 专家
专家
 指标
指标
 程序库
程序库
 实用工具
实用工具
 窗口小部件
窗口小部件
 规则
规则
适用于MetaTrader 5的技术指标 - 142
 技术指标的信号外汇和股票市场的开仓交易和平仓交易起着至关重要的作用。指标的本质就是一种交易品种的数学转换,旨在预测未来的价格变化。
测试技术指标可以更有利于预测市场行为并从中获利。
技术指标的信号外汇和股票市场的开仓交易和平仓交易起着至关重要的作用。指标的本质就是一种交易品种的数学转换,旨在预测未来的价格变化。
测试技术指标可以更有利于预测市场行为并从中获利。 
The UTS Trading Stat indicator, developed by Ultron Trading Solutions, is a customizable tool designed to track and display trading statistics for the current chart's symbol. It presents a visual dashboard on the chart, offering real-time insights into trading performance with a toggleable panel (STAT SHOW/STAT HIDE) for user convenience. Below is a detailed description of its features and functionality: Trading Statistics Displayed : Current Positions : Number of open profit/loss trades and tot

PaintPatternCandle - The Most Advanced Candlestick Pattern Indicator on the Market Detailed Description (300+ Lines) What is PaintPatternCandle? PaintPatternCandle is a revolutionary indicator for MetaTrader 5 that automatically identifies and colors 13 candlestick patterns in real time. Developed by ETHERNAL, it transforms your technical analysis into an intuitive visual process, highlighting buy and sell opportunities with vibrant colors.
Unique Features 13 Recognized Patterns:
E

ISIS Indicator - The Power of Moving Average Crossovers for Accurate Trading ISIS Indicator Overview ISIS is an advanced technical indicator for MetaTrader 5, designed to identify accurate buy (BUY) and sell (SELL) signals based on the crossover of two configurable moving averages. It is designed to be used in conjunction with the OSIRIS robot, but can also be applied manually by traders looking for trend-based strategies.
With a smart combination of a fast moving average (Fast MA) and a sl

Session Time Pro 2.0 — MetaTrader 5 指标 产品描述 Session Time Pro 2.0 是一款专为交易者设计的市场分析指标。它提供对交易时段的高级可视化,包括时间范围、价格波动和市场趋势预测。该指标可以通过线条、区域或彩色蜡烛图突出显示特定交易时段,帮助交易者识别价格行为模式并优化交易决策。 使用手册 主要参数 DrawCandles :启用彩色蜡烛图以表示交易时段。 TimeLineStart :设置交易时段的开始时间(格式 HHMM,例如 "0900")。 TimeLineEnd :设置交易时段的结束时间(格式 HHMM,例如 "1700")。如果留空,交易时段将持续到当天结束。 ShowMonday...ShowSunday :指定要显示交易时段的星期几。 BarsToScan :调整图表上分析的 K 线数量。 ShowFutureSession :允许显示未来交易时段。 SessionLabel :为交易时段添加自定义标签。 ShowRange :显示交易时段的价格波动范围。 LineColor :定义视觉标记的颜色。 LineThic
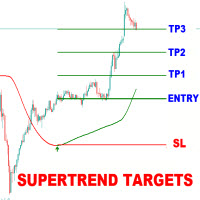
Supertrend Targets Signal is a powerful trend-following and breakout confirmation indicator designed to help traders identify high-probability entry points , visualize dynamic target zones , and receive clean, reliable signals across various market conditions. The core trend logic is built on a custom Supertrend that uses an ATR-based band structure with long smoothing chains—first through a WMA, then an EMA—allowing the trend line to respond to major shifts while ignoring noise. A key addition

1. CONSTITUTION Shoot [Point] is momentum indicator composed of one oscillator and three floating levels [upper, middler, lower]. The oscillator crosses the floating levels forming Shoot Points! The inputs can be used to adjust the oscillator, the floating levels and the alert signals. It is designed only for the MT5 platform. 2. OPERATION As entry signal: When combined with a trend filter [preferably the Currency Strength Meter], it provides very good entry points. bullish entry signal: oscill

Easy Scalper Every Candle
MT5 Indicator is a technical analysis tool designed for gold (XAUUSD) and major forex pairs. It generates buy and sell signals on each candle using multiple filters, volume dynamics, and market structure logic. The indicator is developed for scalpers and intraday traders who require structured, rule-based signals without unnecessary complexity. Key Features 1. Candle-Based Logic Generates buy and sell signals on every candle. Uses multi-condition filters to reduce noise

Automated Anchored Volume Weighted Average Price You set a period, and the indicator will find the highest and lowest price point in the period and derive a AVWAP from there. It also prints out a median line. You can use the generated VWAP lines as a channel, as S/R levels or as a volatility indicator. It's based on tick volume to be compatible with most CFD brokers.
Happy trading!

Absolument. Voici la description pour l'indicateur LSCB Gold, maintenant en chinois (simplifié). LSCB Gold:流动性扫荡与盘整突破指标 LSCB Gold (Liquidity Sweep & Consolidation Breakout) 是一款专业的量化技术指标,专为 XAUUSD(黄金) 交易对的剥头皮交易(scalping)而设计。其核心策略是通过捕捉市场在低波动性盘整期后,进行流动性扫荡(liquidity sweep)时出现的高概率交易机会。 它在您的图表上直接提供清晰、不重绘的买卖信号,并根据当前市场波动性,附带建议的止损(SL)和止盈(TP)水平。 ## 核心策略 该指标的逻辑建立在两阶段的市场分析之上: 盘整检测 (Consolidation Detection): 指标首先识别市场的盘整或窄幅震荡期。它通过监控**平均真实波幅(ATR)**来实现。当ATR值跌至其自身移动平均线的某个阈值以下时,市场被认为处于低波动状态,这通常意味着市场在大幅波动前正在积

Un indicatore avanzato che identifica in automatico le zone chiave di supporto e resistenza su tre timeframe diversi , mostrandole con rettangoli colorati direttamente sul grafico. Ogni zona viene estesa in avanti, etichettata e aggiornata dinamicamente con il movimento del prezzo. Caratteristiche principali 3 Timeframe configurabili (es. M15, H1, H4) Zone di resistenza e supporto calcolate automaticamente Colori personalizzabili per ciascun timeframe Etichette automatiche con indicazi

VolaTrend - Smart Volatility Trend Analyzer Transform your trading with instant market condition recognition - know whether to trend trade or range trade at a single glance! What Makes VolaTrend Different? Tired of cluttered charts with multiple indicators? VolaTrend revolutionizes market analysis by combining three powerful volatility indicators into ONE intelligent system that gives you instant market clarity through a single, customizable button. No more guessing. No more chart clutter. Ju

ATR Momentum Dashboard - Professional Currency Volatility Analyzer Transform Your Trading with Real-Time Currency Strength Analysis The ATR Momentum Dashboard is a cutting-edge indicator that provides instant visibility into currency volatility across all major forex pairs. Built for professional traders who demand precision and clarity in their market analysis. Key Features Real-Time Currency Ranking : Automatically ranks all 8 major currencies (USD, EUR, GBP, JPY, AUD, CAD, CHF, NZD) by

技术指标,使用让·梅乌斯(Jean Meeus)天文算法在交易图表上显示月相。以连续曲线呈现月球周期,科学精度相当于专业天文台水平。兼容 MT5 上的任何品种和时间周期,包括外汇、商品、指数和股票。包含信息面板,显示当前月相、照明百分比以及用于技术分析的参考水平。颜色和样式设置完全可自定义。基于精确的天文计算提供实时月球数据,使交易者能够客观地将月球信息纳入其市场分析。 该指标在我们经过验证的 MQL5 信号 "NaviMoonCycle"(ID: 2354163)中被积极使用,该信号在真实的 OANDA 账户上以真实资金进行交易。该信号在主要外汇货币对上应用基于本指标识别的月球周期阶段的策略。 在此处验证实时结果、月度表现和交易历史: https://www.mql5.com/en/signals/2354163 亲眼见证使用这一基于月球的策略所实现的稳定月度回报。

概述 Advanced Key Levels Predictor EA 是一款为 MetaTrader 5 平台开发的高级智能交易系统(EA),结合了先进的技术分析与预测算法,能够识别关键市场水平并预测未来的价格走势。该EA提供全面的图表显示功能,通过清晰的可视化指标帮助交易者做出明智的交易决策。 主要功能 关键水平检测 支撑与阻力位 :利用高级算法自动识别重要的支撑与阻力水平 斐波那契回撤 :计算并显示关键斐波那契水平(23.6%、38.2%、50%、61.8%、78.6%) 枢轴点 :提供每日枢轴点及其对应的支撑和阻力 水平强度分析 :根据历史价格反应评估每个水平的重要性 预测分析 线性回归预测 :通过统计分析预测未来价格走势 移动平均趋势分析 :基于动量的趋势预测 RSI 动量预测 :使用 RSI 模式进行短期预测 置信评分系统 :为每个预测结果提供置信度评分 高级图表与可视化 实时水平显示 :动态显示所有关键水平 预测线条 :可视化显示未来的价格移动趋势 信息面板 :显示EA统计和市场信息的全面仪表板 多色编码 :不同类型的水平和预测使用不同颜色表示 可自定义

Title: Hourly Sweep Zone Indicator by Daniel Butogwa Description: "Market makers move in silence. But their footprints scream in price. This indicator exposes them." The Hourly Sweep Zone Indicator by Daniel Butogwa is a sniper-grade institutional trading tool designed to identify and visualize liquidity zones , hourly price extremes , and smart money footprints on the chart — live and historically. It automatically draws hourly high/low sweep zones using clean, minimal rectangles that high

请仔细查看附图后再继续阅读 在继续阅读前,请认真查看所附图片 此指标基于 NADARAYA‑WATSON 核回归通道理论 ,结合 RSI 价格动量分析 ,并融入 流动性分析 概念,为追求精准交易的专业交易者提供了一个强大且适应性极高的工具,用于优化进出场时机。 如果您购买了此指标,请通过 电子邮件联系我 并附上 付款凭证截图 ,我将向您发送 详细的交易指导文档 ,帮助您高效使用此工具进行交易。 I. NADARAYA‑WATSON 通道与 RSI 指标(适用于 MT5) 这是一款为 MetaTrader 5 设计的高级指标,融合了自适应的 Nadaraya‑Watson 回归通道与基于 RSI 的超买/超卖水平和背离检测,提供清晰、可操作的交易信号。 II. 主要功能 II.1 自适应 Nadaraya‑Watson 回归通道 根据价格走势动态调整,提供精准的上下通道,用于识别潜在反转或趋势延续。 II.2 RSI 集成 将 RSI 的超买(70)和超卖(30)水平直接映射到图表上,与通道配合以增强信号精度。 II.3 背离检测与流动性分析 在可自定义的窗口内自动识别牛市和熊市背离,帮

Have you ever wondered why most systems are not effective in live trading? My answer is that it's all the fault of the so-called "Smart Money" or the institutional ones,, they constantly create spikes first up then down and vice versa to screw all the retail investors by tearing away their capital, confusing them and making the markets move randomly without any rules. But in all this there is a famous strategy, which in 2009 won the world championship, exploiting and rowing against the instituti

CDS Fractal Blade Session - AIO A precision-engineered, all-in-one custom dynamic system designed to identify and exploit high-probability breakouts during key market trading sessions. The CDS Fractal Blade Session is moves beyond simple session boxes, integrating a sophisticated multi-layered approach to define the most critical price levels with surgical accuracy. This premium indicator serves as the core engine for the CDS Asian Fakeout EA and other automated systems developed b

SPEKULATOR 是一个手动交易系统和指标,帮助您识别关键支撑区域和市场方向。
用简单的策略和隐藏的智慧掌握市场。 您可以在图表上选择任意一个顶部(TOP)和底部(BOTTOM),指标将自动绘制: 您趋势方向的支撑区。
如果是多头趋势,将显示绿色区域;如果是空头趋势,将显示红色区域。该支撑区的灵敏度可以在设置中调整。该区域基于您选择的趋势,表示支撑最可能出现的位置。 高偏差线和低偏差线 根据甘氏九宫格(W.D. Gann’s Square of 9)计算的角度线 入场规则如下: 如果价格向上突破高偏差线,可以做多 如果价格向下突破低偏差线,可以做空 如果价格在偏差线之间震荡,可以在区间内高抛低吸,同时遵守支撑区的方向 甘氏角度线可用作止盈参考 关键水平是360度线: 如果价格高于该线,市场可能会上涨 如果价格低于该线,市场可能会继续下跌 加载指标后,它会出现在图表上的第20根到第50根K线之间。
点击该线即可激活,激活后可以将其移动到任意顶部或底部。 SPEKULATOR 是少数几个将清晰逻辑与优雅视觉效果结合在一起的指标之一。
您可以选择启用区域之间的颜色渐变,使图表显示更为平

The Kecia Market Manager is an advanced MT5 indicator that transforms multi-asset correlation analysis into actionable trading intelligence. By employing 6 sophisticated statistical frameworks and professional-grade visualizations, this tool reveals hidden market relationships, pair trading opportunities, and portfolio hedging strategies across unlimited currency pairs in real-time. Key Features: Multi-Metric Analysis Engine : Pearson correlation coefficient with rolling windows Cointegration te
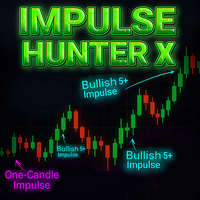
Impulse Hunter X Indicator – Professional Market Movement Radar Impulse Hunter X is a professional trading tool designed to help traders detect new, strong market impulses. It identifies and alerts you to powerful price movements, ensuring you never miss a trading opportunity. Every impulse type has been meticulously tested and refined for accuracy. Before using, make sure to configure the input parameters, especially the candle body size for stronger impulses! Key Features Detects stron

SAM Waves PRO – Professional Signal Indicator for Day Trading SAM Waves PRO is the extended version of the popular SAM Waves indicator, designed specifically for disciplined intraday Forex traders. It includes real-time notifications via push, email, and sound alerts, ensuring you never miss a qualified trading signal. Backtested on over 5.5 years of historical data, the strategy has achieved a consistent win rate above 60 percent when traded using a fixed stop loss and take profit between 20 an

Indicator Title: Supply and Demand Zones Short Description: This indicator for MetaTrader 5 automatically identifies and draws supply and demand zones on the price chart, providing key visual information for trading decisions. Based on the analysis of price action and candle structure, the indicator highlights areas where the price is likely to react. Detailed Description: The Supply and Demand Zones indicator analyzes price history to identify specific candlestick patterns that suggest the pres
Gold Signal Quality Selector Stop Guessing. Start Trading Gold with Institutional-Grade Clarity. Are you tired of the chaotic nature of the Gold (XAUUSD) market? Frustrated with generic indicators that generate endless false signals and drain your capital? The truth is, Gold doesn't move like other assets. It demands a specialized tool built for its unique volatility and personality. It's time to stop using one-size-fits-all tools and start trading with an intelligent edge. Introducing Gold Sign
HiLo Matrix Indicator by Daniel Butogwa — Version 1.00 Precision Session Zones & Hourly Sweep Levels for the True Forex Scalper Overview HiLo Matrix is a powerful MT5 indicator designed to map key intraday market structure levels across major Forex sessions: Asian (Tokyo), London, and New York . This tool visually highlights session price ranges with clean, customizable colored boxes and lines to give you the sniper’s edge on timing, liquidity hunts, and breakout setups. It also includes critic


Radar DI – Indicador de Taxa de Juros para Mini Índice e Mini Dólar com Exportação CSV e Integração IA Radar DI é um indicador especializado que transforma as variações da taxa de juros DI (Depósitos Interfinanceiros) em sinais operacionais estratégicos para os ativos mini índice (WIN) e mini dólar (WDO) . NOVA FUNCIONALIDADE: Exportação CSV + Integração com IA Agora o Radar DI permite exportar todos os dados em formato CSV , incluindo: Variações dos DIs Variação do Mini Índice (WIN)

ATR 手动过滤器 手动ATR过滤器 — 精准控制波动性,避免失真 这是什么? ATR MANUAL FILTER 是为注重准确性的交易者设计的工具。
与传统ATR指标使用所有K线进行自动计算不同,本工具允许您 手动选择真正反映市场行为的K线 。这样可以排除新闻行情、异常K线以及噪音,从而获得更真实的波动率评估。 该指标帮助您判断价格还有多少潜在波动空间,以及当前走势是否已经接近尾声。 为什么需要它? 节省时间 — 无需手动计算ATR 提供基于交易者判断的真实ATR值 显示已使用的日内波动百分比 显示根据平均ATR剩余的潜在波动空间 当K线超过日内ATR的75%时发出警告(阈值可自定义) 功能特色 手动选择K线 — 直接在图表上点击选择 自动为每个选中的K线添加箭头和编号 表格显示完整的K线数据: 最高价和最低价 ATR值 已走完的日内百分比 超过设定阈值时发出警告(例如 75%、90% 等,可自由设置) 现代化紧凑型控制面板,带“清除”按钮 自动保存所选K线 再次点击可取消选择 截图展示了什么? 左侧为表格,显示所选K线的 High、Low、ATR 和已走百分比。
表格下方显示以下内


The SMC LuxStyle Clean is a simplified Smart Money Concept (SMC) indicator for MetaTrader 5 that visually highlights key market structure elements such as Break of Structure (BOS), Change of Character (CHoCH), Fair Value Gaps (FVG), and Order Blocks (OB) with minimal clutter. It uses lightweight logic and controlled label placement to avoid overlapping and maintains chart readability, making it ideal for traders who prefer clean visual cues without overwhelming signals.

Indicator using MA + ATR Filter This is a simple trend-following indicator that combines a Moving Average (MA) with an Average True Range (ATR) filter to identify potential buy and sell signals. The MA helps determine the general direction of the market, while the ATR acts as a volatility filter to reduce false signals. Arrows are plotted on the chart to mark entry points when price crosses beyond dynamic thresholds based on the MA and ATR values. Optional alerts notify the trader of signal even
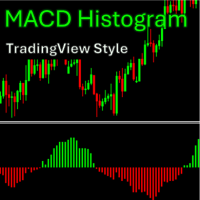
Advanced MACD Indicator for MetaTrader 5 , designed with momentum clarity of the price in real-time responsiveness. Features: Precise calculations of MACD and signal line Histogram-only display – no distracting lines Dynamic coloring: green = above zero, red = below zero Supports all timeframes and assets (including NAS100) Perfect for: Traders switching from TradingView to MT5 Cleaner visuals for quick momentum signal reading Strategies based on MACD divergences This indicator can be

ClaroFxAlgo SmartLine Alert – Precision Trendline & Alert Tool for MetaTrader 5 ClaroFxAlgo SmartLine Alert is an intelligent chart annotation and alert system designed for MetaTrader 5. Perfect for traders who rely on clean technical setups, this tool transforms manual trendline drawing into a dynamic, alert-based system with professional-grade features.
Key Benefits Smart Trendlines
Instantly convert trendlines into horizontal rays, extend lines, select price anchors, and switch styles

This is an indicator that shows the current trend. It does not show the moment to open an order. It is a filter for your trading signals: trade only in the direction of the trend indicated by the indicator, and close orders when the trend is opposite. This indicator does not use any standard oscillators or indicators. All its calculations are based only on the prices of the last N bars of the chart. The indicator has the ability to display values from a larger timeframe chart. Features of the
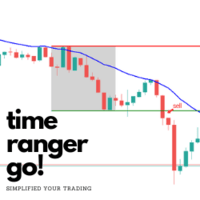
Hi I'm here to help simplified your trading, simple and profitable This is my new indicator that can help you trading. V2 New Feature : Buy and Sell Signal Alert Options
This indicator is : Time Range Indicator with MA as Trend Confirmation You can customize start and end hour of Time Range You can choose your Moving Average as Trend Confirmation You can customize color of this Indicator
My Simple XAUUSD settings: - Start 02:00 PM (Start of London Session) - End 04:00 PM (London Session) - MA
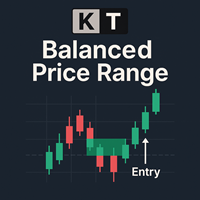
KT Balanced Price Range 指标会高亮显示两个连续相反的 公平价值缺口 (FVG) 的重叠区域。这个概念被称为平衡价格区(BPR),在价格行为交易者中非常受欢迎,尤其是使用聪明资金理念(SMC)和内部圈交易者(ICT)方法的交易者。 交易者通常使用这些 BPR 区域来寻找高概率的交易机会,特别是在回调或趋势延续过程中。BPR 区域往往是市场可能反转、继续或突破的关键点,是把握进出场时机的重要位置。
功能特点
从零开始开发,仅基于经过验证的 FVG 重叠来识别 BPR 区域,确保交易信号质量。 可自定义的 BPR 百分比阈值,用于过滤无效区域,专注于高价值交易点位。 为每个交易机会明确设定止损与盈利目标,基于风险回报比,避免猜测。 内置“最大利润”线,可直观显示每个信号的最高收益,便于绩效跟踪。 完全可定制的视觉外观,包括颜色与线条粗细,可完美融合任意图表样式。 支持所有标准的 MetaTrader 警报方式,确保不错过任何交易信号。
多头 BPR 当一个空头 FVG 之后迅速出现多头 FVG,并且价格保持在重叠区域附近时,就形成了多头 BPR。
空头 BPR

TARGET SMART ORDER Indicator
Custom indicator for MetaTrader 5 that displays detailed information about each trade directly on the chart, showing real-time profit/loss, Take Profit and Stop Loss levels for each active order.
Main Features:
Real Profit Display Real-Time Profit/Loss: Shows the current value of each position.
Continuous Update: Values are updated tick by tick
Dynamic Colors: Green for profit, red for loss.
TP/SL Lines: Draws horizontal targets at Take Profit and Stop Loss l

ZLEMA Trend – No lag - No loss - Your Sweet Spot for Market Turning Points Discover the charm of precision trading with ZLEMA , a refined tool crafted to help traders capture top and bottom reversals with confidence and clarity. This custom MT5 indicator uses a dual Zero Lag Exponential Moving Average (ZLEMA) strategy – featuring ZLEMA 5 and ZLEMA 9 – delicately blended to reduce lag and highlight price momentum in real time. When these two lines cross and diverge, the indicator whispers a p

WickExtreme Price Printer — Trade Where Price Tells the Truth Introducing the WickExtreme Price Printer , a precision tool designed for serious traders who believe that price wicks are not noise—they are signals . Built on the timeless principles of Jesse Livermore's price-reading tactics , this indicator reveals real-time market intent by printing key high and low wick prices directly on the chart, with clean, vintage-style visuals. Features: Wick Price Printing : Automatically prints the price

ATR波动区间指标
五级动态波动率分析工具 - 智能识别市场状态 【指标原理】
基于平均真实波幅(ATR)算法,自动将市场波动划分为五个渐进层级,通过色带与数值直观呈现当前波动强度。 核心功能
五级波动分类系统
• 极低波动(青色)
• 较低波动(亮绿)
• 中等波动(黄色)
• 较高波动(橙色)
• 极端波动(红色)
自适应区间 - 根据最近200根K线自动校准阈值
双重视觉反馈 - 色带边界+实时数值标签(精确到小数点后2位)
抗重绘技术 - 所有信号仅基于已完成K线 参数设置
基础周期:默认ATR(6) - 平衡灵敏度与稳定性
字体/颜色:支持完全自定义
适用场景:
→ 短线交易(M1-M30)
→ 波段交易(H1-H4)
→ 头寸规模管理 三大核心价值 市场状态诊断 - 快速识别震荡/趋势环境 策略适配提示 - 自动匹配最佳交易时段 风险预警系统 - 提前规避异常波动 终端特性
• 原生MT5指标 - 零延迟计算
• 多货币/多周期同步分析
• 资源占用率<0.5%
• 全经纪商兼容 "让波动率可见可控 - 您的智能交易气象站" ※

Three Bar Supertrend 结合了精确的三根K线反转形态识别与 Supertrend 趋势过滤器,帮助交易者识别高概率的买入或卖出机会。内建可选的SMA趋势过滤器进一步增强准确性,适用于所有交易品种和周期,是日内及波段交易的理想工具。 主要功能 : 检测经典3根K线反转形态(多头与空头) 结合Supertrend趋势确认机制 可启用SMA快速与慢速均线过滤,提升信号质量 只在有效反转处绘制绿/红箭头 零重绘、无滞后,忠实反映市场行为 参数设置 : Supertrend的ATR周期与倍数 快速/慢速SMA周期 启用/禁用SMA过滤器 箭头与K线间距设置 适用市场 :
外汇、指数、加密货币、黄金等所有品种
支持所有时间周期(M1到日线甚至更高)

Session Sweeps Matrix Indicator v1.00 By Daniel Butogwa — Built for the serious Forex sniper scalper Overview Session Sweeps Matrix v1.00 is a powerful MT5 indicator designed to give traders a clear edge by mapping key market levels during the four major Forex sessions: Tokyo, Frankfurt, London, and New York . This tool automatically plots session highs and lows, along with daily high and low levels, as clean, color-coded horizontal lines with clear labels for easy identification. Key

Overview The MACD Divergence Indicator is a powerful tool designed to detect potential trend reversals by analyzing divergences between price action and the MACD (Moving Average Convergence Divergence) indicator. It automatically identifies and highlights bullish and bearish divergence signals directly on the chart, making it easier for traders to spot high-probability trading opportunities. Key Features Customizable Settings: Includes adjustable parameters to suit various trading styles and ti

B5 and B3 assistant is an indicator developed to add a bit of certainty.
The indicator provides the trader with clear "predictive" entries.
Each entry is marked on the chart, with a point value and estimated amount of spikes.
HOW TO USE THE INFDICATOR:
Load onto your Boom 500 or B300 chart.
Wait for signal.
Use signal information to place SL and TP.
EXAMPLE OF HOW TO TAKE TRADES:
You will get an on chart alert and push notification which will be as follows: OPTION 1:
incoming spike ale

Boost your technical analysis with our Weekday Lines Indicator — a powerful yet lightweight tool designed for traders who want to clearly visualize daily market structure.
Key Features: Auto Draws Vertical Lines for each trading day: Monday through Friday
Customizable Colors & Styles to match your chart theme
Day Labels (Mon, Tue, etc.) appear next to lines for easy tracking
Works in All Timeframes — especially useful in intraday and swing trading
No Lag, No Clut

HumaI Power Zones – 为专业交易者打造的精准 OHLC 显示 产品介绍
HumaI Power Zones 是一款精心打造的指标工具, 能够精准识别并绘制日线(D1)、周线(W1)、月线(MN1)和年线(Y1 )的关键 OHLC(开盘价、最高价、最低价、收盘价) 水平。 这些关键水平会以实时方式呈现,并严格基于历史结构绘制,保持稳定、可靠,适用于任何时间周期和交易风格。无论您专注于短线交易还是高周期分析, HumaI Power Zones 都为您的决策提供了清晰且聚焦的结构框架。 核心功能 机构级精准 OHLC 水平
自动绘制 D1、W1、MN1 和 Y1 各周期的开盘、最高、最低和收盘价。 智能提醒系统
一旦价格触及关键区域即刻提醒,基于当前蜡烛图,无延迟。 区域触碰记录功能
实时追踪价格触碰各水平的次数,帮助判断区域强度。 极简视觉设计
采用高对比线条,不干扰图表,为专业交易环境打造。 时间框架智能适配
自动调整显示内容,确保您只看到当下所需的信息。 固定水平且不重绘
所有水平都锁定时间,不随图表变化重新绘制,确保稳定性和精准度。 适合对象
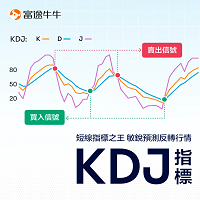
The KDJ indicator is a very useful momentum oscillation indicator made up of three indicator lines K, D, J. Many people also refer to the KDJ indicator as a “random indicator” because it actually adds a J line as an auxiliary on the basis of a traditional random indicator (containing only K, D lines). The KDJ indicator has a certain degree of comprehensiveness, drawing on the advantages of the William Indicator (WMSR) and Moving Averages (MA) to help investors better judge market trends and ide

“Naturu” 是一个使用大自然对称性作为算法的手动指标。
用简单策略和隐藏智慧,掌控市场! 加载指标后,您会看到两条线——上线(Top)和下线(Bottom)。
单击一次即可激活某条线。要移动,只需点击您想放置该线的那根K线。 您设定一个高点和一个低点,指标会自动计算: 洋红色区域,显示多空双方兴趣最接近之处,也就是最有可能成为支撑/阻力的区域。 灰色区域,标示下一层次的关注区。 青绿色线条,表示多方的目标价位。 金色线条,表示空方的目标价位。 手动指标赋予您完全的控制和灵活性,让您根据实时市场环境和个人直觉调整级别。它们迫使您更深入地亲自分析价格走势,帮助您真正理解支撑、阻力和形态是如何形成的。依靠人工判断,可以过滤掉自动系统常常误判的大量“噪音”,减少错误信号。而且,因您亲自设定每个级别,可在突发新闻或极端行情时立即调整,无需等候代码更新。 隐藏于简单游戏背后的神圣力量!

In the fast-paced world of cryptocurrency trading, understanding market dynamics is crucial for making informed decisions. One of the key indicators that traders use to analyze market behavior is Volume Delta, which offers insights into the balance between buying and selling pressure. This article explores the concept of Volume Delta, its significance in order flow analysis, and how it can be used effectively in trading strategies. By providing a clear understanding of this indicator, traders ca
### **User Guide for CVD Indicator Installation and Usage in MT5** **Indicator Name:** Cumulative Volume Delta (CVD) **Version:** 1.00 **Purpose:** Visualizes buy/sell pressure balance through volume analysis.
---
### **Installation** 1. Download `CVD.mq5` file. 2. In MT5: - `File` → `Open Data Folder` - Navigate to `MQL5/Indicators` - Paste the file into the folder. 3. Restart MT5. 4. In the "Navigator" panel: - Right-click `CVD` → "Attach to Chart"
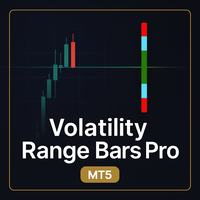
Volatility Range Bars Pro(MT5) Visualize Volatility. Sharpen Your Entries. Trade with Confidence. Volatility Range Bars Pro is a powerful MetaTrader 5 indicator designed for traders who want instant clarity on market volatility and pip-based positioning. Whether you're scalping or day trading, this tool gives you a visual "volatility ruler" that helps you: Instantly gauge current market volatility Estimate take-profit and stop-loss distances at a glance Stay grounded in your risk-reward strategy

The Dual Trend Analyzer: An MQL5 Tool for Statistical Correlation Analysis The Dual Trend Analyzer is a powerful MQL5 tool developed to analyze and visualize the statistical correlation between two distinct financial symbols (assets). This tool allows you to choose from three of the most widely recognized correlation methods: Pearson, Spearman, or Kendall-Tau . Identify Correlation Patterns with the Dual Trend Analyzer This indicator is designed to unveil the statistical correlation between two
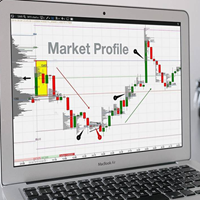
Индикаторы профиля объёма: основные понятия Определение Профиль объёма — это продвинутый индикатор технического анализа, который показывает торговую активность за условленный период времени на определённых ценовых уровнях. С учётом таких пользовательских параметров, как количество строк и период времени, индикатор строит на графике гистограмму, отражающую доминирующие или значимые ценовые уровни, основанные на объёме. По сути, профиль объёма берёт в расчёт общий объём, торгуемый на определённом
MNK Trend Line Indicator This indicator builds a linear trend line based on the method of least squares (OLS). It helps you detect the main price trend for any symbol or timeframe. Customizable period Shows trend strength Can be used in expert advisors (via iCustom) Works on any instrument and timeframe. Индикатор по методу наименьших квадратов (МНК), также известный как Least Squares Moving Average (LSMA) , — это разновидность скользящей средней, которая использует линейную регрессию для оценки

指标工作原理 多市场方向(MultiMarket Direction)是一款为MetaTrader平台设计的强大且多功能的指标,旨在帮助交易者可视化市场趋势并识别潜在的入场点。该指标结合了经过时间验证的技术分析工具,如指数移动平均线(EMA)和高/低水平,为市场动态提供清晰且全面的视图。 指标在图表上显示以下内容: EMA 21、EMA 81 和 EMA 200 :三条具有可自定义周期的移动平均线(默认值:20、50 和 200),用于分析短期、中期和长期趋势。EMA 21(蓝色)对价格快速变化反应灵敏,EMA 81(橙色)跟踪中期趋势,EMA 200(绿色)反映整体市场方向。 最高和最低水平 :线条(最高为红色,最低为绿色)显示指定周期内(默认:200根K线)的最高和最低收盘价,帮助识别关键支撑和阻力位。 买入和卖出信号 :指标根据EMA 21和EMA 81的交叉生成箭头信号(买入为黄色,卖出为红色),并通过MACD过滤器(周期7和12)进行确认。这有助于捕捉潜在的趋势反转或延续。 提醒功能 :支持可自定义的通知(警报、推送通知或电子邮件),实时通知交易者新信号的出现。 指标如何工作

Supertrend AI(聚类版)– 含信号功能 是一款新一代自适应趋势跟随指标,专为精准交易设计,适用于外汇、加密货币和指数市场。该指标通过多种 Supertrend 设置结合实时性能反馈进行动态聚类,自动选择最优的 ATR 系数应对不同市场环境。 功能特点: 基于聚类的 ATR 系数选择 无重绘买入/卖出信号 显示多空趋势线(Supertrend) 提供完整缓冲区,便于 EA 集成 简洁可视化界面 适合日内和波段交易 工作原理:
每根K线会在多个 Supertrend 设置下进行评估,并通过性能评分函数进行平滑处理,再按表现聚成3类。最终选择表现最好的组生成趋势线和交易信号。 参数说明: atrPeriod :ATR 周期(默认:10) minMult :最小 ATR 倍数(默认:1.0) maxMult :最大 ATR 倍数(默认:5.0) step :倍率步长(例如:0.5 = 测试 1.0、1.5、2.0…) perfAlpha :性能平滑因子(默认:10.0,值越大对近期价格变化越敏感) maxIter :保留参数,未来可能用于聚类迭代控制 fromCluster :

Advanced Market Structure Pro - Multi-Timeframe Trend Analysis Indicator Overview Advanced Market Structure Pro is a sophisticated technical analysis indicator that combines Zero Lag EMA (ZLEMA) technology with adaptive volatility bands to identify high-probability trend changes and continuation signals across multiple timeframes. This indicator provides traders with a complete market structure analysis system suitable for all trading styles, from scalping to position trading. Key Features 1. Ze
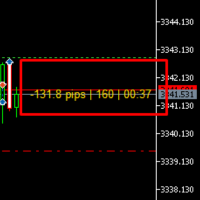
Ultimate Trading Companion Indicator for MT5 – Spread, Candle Timer & Trade Pips Monitor Ultimate Trading Companion Indicator for MT5 is a real-time chart utility designed to display key trading information directly on the terminal chart. It provides live data on open trade performance, spread conditions, and candle timing in a single integrated panel. The indicator is intended for traders who monitor active positions and require continuous awareness of basic market and trade execution metrics
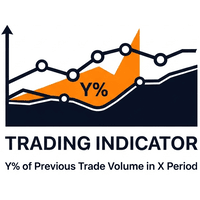
This indicator calculates and visualizes the price range containing the top 70% (Configurable) of the traded volume for the previous selected timeframe, using a flexible binning approach. This allows the trader to clearly see between what price range the majority of volume traded, this aligns very well with support and resistance levels as well, making both intraday trading between the highs and lows and to detect breakout zones possible, especially on the larger timeframes. The trader can selec
This custom Support and Resistance Indicator with Signal Arrows is designed for MetaTrader 5 (MT5) to help traders identify key price zones and potential reversal points in the market. It combines classical support and resistance detection with smart signal generation for better trading decisions. Key Features: Automatic Support & Resistance Detection:
The indicator scans historical price data within a defined lookback period to identify swing highs (resistance) and swing lows (support) usin

Reversal Arrow Pro — Precise Buy/Sell Reversal Signal Indicator
Reversal Arrow Pro is a leading indicator designed to detect the early stages of high-probability market reversals. Unlike traditional tools that react after a trend has formed, this indicator aims to anticipate turning points using a proprietary formula based on advanced momentum analysis. What is a Leading Indicator?
Most popular indicators, such as Moving Averages, MACD, and Stochastic Oscillators, are considered lagging i
MFI-MULTI – Multi-Timeframe Trend & Volatility Indicator Description:
MFI-MULTI is a powerful monitoring tool based on the Money Flow Index (MFI), specifically designed for swing traders . It allows you to analyze trend direction and volatility across multiple timeframes simultaneously , without switching between charts. Thanks to a clear and intuitive visual interface (built-in HUD), MFI-MULTI displays: The trend direction per timeframe , calculated from the average angle of the MFI’s MA

Indicador para continuação da tendência e ótimo para reversão
Criado especialmente para o par xauusd no time frame de m1
Ema 10 e Ema 30 verde significa tendência de alta e só considerar setas verdes
Ema 10 e Ema 30 vermelho significa tendência de baixa e só considerar setas vermelhas
Indicador criado para gerar dinheiro, de forma consistente e de fácil leitura
Seja disciplinado.
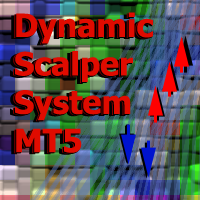
“ Dynamic Scalper System MT5 ”指标专为在趋势波内进行剥头皮交易而设计。
已在主要货币对和黄金上进行测试,并可与其他交易工具兼容。
提供顺势短线建仓信号,并提供额外的价格变动支持。
指标原理:
大箭头决定趋势方向。
在趋势波内,我们采用一种生成小箭头形式的剥头皮交易信号的算法。
红色箭头代表看涨方向,蓝色箭头代表看跌方向。
敏感的价格变动线会沿着趋势方向绘制,并与小箭头信号协同作用。
信号运作方式如下:当线在适当时刻出现时,将形成入场信号;在出现线时,持仓;线完成后,平仓。
建议的操作时间范围为M1 - H4。
箭头在当前K线上方形成,如果下一根K线已开仓,则不会重新绘制上一根K线上方的箭头。
输入参数
Trend Wave Period - 趋势方向(大箭头)的周期,改变趋势波的时间间隔。值 1 表示趋势方向的最长持续时间,参数值越大,持续时间越短。
Scalper Arrows Period - 信号箭头(小箭头)的计算周期,改变入场信号的生成频率。值 3 表示最频繁的生成频率,参数值越大,箭头频率越低,准确度越高。
这些参数可以根据不同

TimeGap Block SMC v3.00 TimeGap Block SMC is an indicator for MetaTrader 5 that automatically detects price areas where the market passed through a range too quickly and spent almost no time inside the zone. Such areas often point to an imbalance between supply and demand. When price returns to these areas, the market may show a reaction: a bounce, a slowdown, partial filling of the zone, or a breakout. The indicator is built on Smart Money Concepts logic and helps analyze market structure witho

IC T Smart Money Concepts Professional v 3.0 0 The Ultimate ICT Trading Solution Transform your trading with the most advanced Inner Circle Trader indicator on MQL5 ! Professional -grade tool implementing authentic ICT methodology with bullet proof stability . Why Choose This IC T Indicator? Professional Implementation Zero Validation Errors - Passes all Met aTrader tests perfectly Enhance d Data Handling - Works with limite d broker

FVG Analysis — 公允价值缺口(Fair Value Gap)的识别与跟踪 FVG Analysis 是一款能够在图表上自动识别价格失衡区域的指标——这类区域在 Smart Money Concepts 中被称为公允价值缺口(Fair Value Gap)——并跟踪它们从形成到被回补的整个生命周期。这些区域出现在市场以极强的冲量运行、以致于留下未被相邻K线填补的价格缺口之处,而价格往往会在随后重新回到这些区域,以恢复平衡。 本指标的核心是经典的三K线缺口定义。当第一根与第三根K线的影线之间留有未被填补的空间,且冲量K线本身确认了方向时,缺口便记录在三根K线的中间那一根上:对于看跌缺口,较旧K线的最低价高于较新K线的最高价,且中间K线为阴线;对于看涨缺口,则呈镜像关系。这种方法过滤掉随机噪声,只突出在结构上具有意义的缺口。 每一个被识别出的区域都会以矩形的形式绘制在图表上:看跌与看涨缺口各自采用可自定义的颜色,区域可以填充并置于背景,从而不会遮挡价格走势。矩形从缺口形成的时刻延伸至当前时间,直观地展示该区域保持未被回补的时长,以及价格已逼近到何种程度。 本指标特别注重对区域回

Order Block ICT — SMC An Order Block indicator based on the ICT / Smart Money Concepts methodology. It automatically detects and draws bullish and bearish order block zones on your chart, tracks their mitigation, and removes zones once they are spent. See the areas where smart money stepped into the market — without marking up the chart by hand. What the indicator does Scans price history and detects order blocks through several scenarios at once: a classic candle sequence, an impulsive move, an
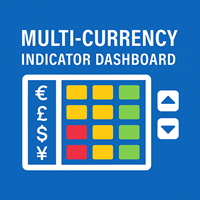
The Multi-Currency Indicator Dashboard is an assisting tool designed to monitor up to 10 currency pairs across 6 essential indicators in one compact, color-coded dashboard. Ideal for traders who value efficiency, this tool eliminates the need to switch between charts or timeframes. Whether you're a scalper, swing trader, or trend follower, this dashboard gives you an instant visual overview of market conditions across your preferred symbols and indicators. Note : This indicator is not limited to
MetaTrader市场是独有的自动交易和技术指标商店。
阅读MQL5.community用户备忘更多地了解我们提供给交易者的独特的服务:复制交易信号,自由职业者开发的自定义应用程序,通过支付系统完成的自动付款和MQL5云网络。
